The Top Trends That Matter in 2014
•Download as PPTX, PDF•
2 likes•1,314 views

See how these 2014 trends will increase the need for healthcare data analytics, understand the impact these 26 trends will have in your organization, and learn the fundamental details of these trends.

Recommended
Recommended
More Related Content
Viewers also liked
Viewers also liked (6)
More from Health Catalyst
More from Health Catalyst (20)
Recently uploaded
Recently uploaded (20)
The Top Trends That Matter in 2014
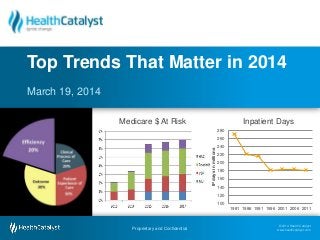
- 1. March 19, 2014 Top Trends That Matter in 2014 100 120 140 160 180 200 220 240 260 280 1981 1986 1991 1996 2001 2006 2011 IPdaysinmillions Inpatient Days March 19, 2014 Top Trends That Matter in 2014 © 2014 Health Catalyst www.healthcatalyst.comProprietary and Confidential Medicare $ At Risk Inpatient Days
- 2. © 2014 Health Catalyst www.healthcatalyst.com Proprietary and Confidential Follow the discussion on Twitter, #TimeforAnalytics 2014 .. The year of 2 According to a baseline study of early Accountable Care Organizations (ACOs), ACO patients had 5.8% lower total costs of care than non-ACO patients ($7,694 vs. $8,164). Source: The Commonwealth Fund, January 2014 Medicare ACOs are groups of doctors, hospitals, and other health care providers, who come together voluntarily to give coordinated high quality care to the Medicare patients they serve. 90 87 69 38 0 10 20 30 40 50 60 70 80 90 100 MidWest East South East West Geographic Location of Medicare ACOs Source: Medicare Fact Sheet, 2013 ACO Accountable Care Organization 500 as of year end 2013, projected to double in a year Medicare added 123 new ACOs (MSSPs) in January 2014 121 90 66 44 30 0 20 40 60 80 100 120 140 Composition of Medicare ACOs Source: Medicare Fact Sheet, 2013
- 3. © 2014 Health Catalyst www.healthcatalyst.com Proprietary and Confidential Follow the discussion on Twitter, #TimeforAnalytics 2014 … The year of 3 Analytics Analytics is the discovery and communication of meaningful patterns in data per Wikipedia.
- 4. © 2014 Health Catalyst www.healthcatalyst.com Proprietary and Confidential Follow the discussion on Twitter, #TimeforAnalytics 2014… The year of 4 Acute Acute/Post Post Acute Payment Retrospective Retrospective Retrospective Prospective Participants 3 44 14 37 Organizations 32 192 165 75 Episode All acute patients, all DRGs Selected DRGs, hospital plus post-acute period Selected DRGs, post-acute period only Selected DRGs, hospital plus readmissions Services included in the bundle All Part A services paid as part of the MS-DRG payment All non-hospice Part A and B services during the initial inpatient stay, post-acute period and readmissions All non-hospice Part A and B services during the post- acute period and readmits. All Part non-hospice A and B services (including the hospital and physician) during initial inpatient stay and readmissions 48 Bundled Payment Groupings Major joint upper extremity 483 Major joint and limb reattachment procedure of upper extremity with complication or comorbidity or major complication or comorbidity Bundled Payment
- 5. © 2014 Health Catalyst www.healthcatalyst.com Proprietary and Confidential Follow the discussion on Twitter, #TimeforAnalytics 2014… The year of 5 Bill posted on Internet $55,000 for appendix operation Consumer Transparency HFMA’s common-sense best practices bring consistency, clarity, and transparency to patient financial communications.
- 6. © 2014 Health Catalyst www.healthcatalyst.com Proprietary and Confidential Follow the discussion on Twitter, #TimeforAnalytics 2014… The year of 6 We have definitely been hearing from members that they are seeing an increase in bad debt and even in charity care for people with high- deductible health plans," Caroline Steinberg, vice president for trends analysis at the American Hospital Association, told KHN. "A lot of these folks tend to not understand the structure of their benefits until they get to the hospital, and they're not covered as thoroughly as they thought.“ Source: Kaiser Family High Deductible Plan The rate of workers in high- deductible plans has more than doubled since 2009 to 19 percent, KHN says, citing figures from the Kaiser Family Foundation.
- 7. © 2014 Health Catalyst www.healthcatalyst.com Proprietary and Confidential Follow the discussion on Twitter, #TimeforAnalytics 2014… The year of 7 17.2% 10% 11% 12% 13% 14% 15% 16% 17% 18% 2000 2002 2004 2006 2008 2010 2012 Health Expenditure as % of GDP 3.8% 3.8% 3.6% 3.7% 0.0% 0.5% 1.0% 1.5% 2.0% 2.5% 3.0% 3.5% 4.0% 2009 2010 2011 2012 Health Care Spending Growth Expenditure The number of people employed in healthcare dropped by 6,000 in December, the first time total healthcare employment declined since July 2003, CNN Money.
- 8. © 2014 Health Catalyst www.healthcatalyst.com Proprietary and Confidential Follow the discussion on Twitter, #TimeforAnalytics 2014… The year of Frequent Conditions AHRQ 8 Frequencies
- 9. © 2014 Health Catalyst www.healthcatalyst.com Proprietary and Confidential Follow the discussion on Twitter, #TimeforAnalytics 2014… The year of Congress has 3 months to consider 2 very similar bipartisan bills in the House and Senate that would repeal Medicare's sustainable growth rate (SGR) formula for physician pay. Both measures would shift compensation from fee-for-service to pay- for-performance and consolidate 3 Medicare incentive programs, including meaningful use of electronic health records, into a single program. 9 Delayed 20% decrease in Jan SGR – Sustainable Growth Rate
- 10. © 2014 Health Catalyst www.healthcatalyst.com Proprietary and Confidential Follow the discussion on Twitter, #TimeforAnalytics 2014… The year of 10 FY 2014 Final Inpatient PPS Rule Creates HAC Reduction Program with two Domain measurements that overlaps in its entirety with existing HAC program and VBP. HAC – Hospital Acquired Conditions
- 11. © 2014 Health Catalyst www.healthcatalyst.com Proprietary and Confidential Follow the discussion on Twitter, #TimeforAnalytics 2014… The year of 11 Outlook grim for docs' ICD-10 readiness October 1, 2014 ICD-10 Physician practices are still behind schedule in terms of preparation for ICD-10, yet generally are optimistic about readiness for its implementation, according to a recent survey conducted by medical claims clearinghouse Navicure. Seventy-four percent of survey respondents said they still haven't started implementing their ICD-10s. What can be taken as a bit of good news is that 76 percent of respondents to a series of KPMG surveys indicated they have completed an impact assessment, widely considered the first key step en route to ICD-10.
- 12. © 2014 Health Catalyst www.healthcatalyst.com Proprietary and Confidential Follow the discussion on Twitter, #TimeforAnalytics 2014… The year of 12 Two-thirds of primary care and one- third of specialists currently depend on an exclusive relationship with a hospital for some or all of their incomes. Many of these are employed. But private health insurers and large medical groups are options for physicians seeking cover, and the terms of their deals dis-intermediate traditional hospital referral relationships. Source: Deloitte 311 362 423 536 592 263 304 363 439 482 67 90 99 122 133 - 200 400 600 800 1,000 1,200 1,400 2009 2010 2011 2012 2013 Physician Growth in Healthcare System Specialist PCP Extenders Joint accountability with physicians
- 13. © 2014 Health Catalyst www.healthcatalyst.com Proprietary and Confidential Follow the discussion on Twitter, #TimeforAnalytics 2014… The year of 13 Potential for revenue losses to competitors, penalties from regulators, new contract methodologies is increasing. See shift below in FFS (Fee for service). 82% 12% 5% 1% 2010 59% 5% 12% 23% 1% 2012 24% 5% 15% 55% 1% 2014 Budget FFS Partial Risk Full Risk Population Mgt Bundled Payment Risk
- 14. © 2014 Health Catalyst www.healthcatalyst.com Proprietary and Confidential Follow the discussion on Twitter, #TimeforAnalytics 2014… The year of 14 Pharmacy Workflow Project Business Impact: – Reduced the number of trips to the hospital pharmacy due to inventory shortage by 8 trips per month – Reduced the surcharges paid to the trucking company – Reduced the pharmacy headcount by two full time equivalents (FTE) Lean
- 15. © 2014 Health Catalyst www.healthcatalyst.com Proprietary and Confidential Follow the discussion on Twitter, #TimeforAnalytics 2014… The year of 15 A measure in the new Efficiency Domain A claims-based measure that include risk- adjusted and price-standardized payments for all Part A and Part B services provided from 3 days prior to a hospital admission (index admission) through 30 days after the hospital discharge Measure under VBP starting 2015 M & A Merger and Acquisitions Deals Hospitals 2010 72 125 2011 90 156 2012 100 247 MSPB – Medicare Spend Per Beneficiary
- 16. © 2014 Health Catalyst www.healthcatalyst.com Proprietary and Confidential Follow the discussion on Twitter, #TimeforAnalytics 2014… The year of Operating Income- on operations Median in 2012 3.15%, California Median 3% 16 -3% -2% -1% 0% 1% 2% 3% 2013 2014 2015 2016 2017 2018 Operating Income Projections Projection with no interventions. 0% 1% 2% 3% 4% 5% 6% 7% 8% 9% $0 $50 $100 $150 $200 $250 $300 $350 $400 $450 2009 2010 2011 2012 2013 Operating Income (In thousands) Net income and operating income
- 17. © 2014 Health Catalyst www.healthcatalyst.com Proprietary and Confidential Follow the discussion on Twitter, #TimeforAnalytics 2014… The year of 17 JP Morgan – Revenue growth: in the expansion of outpatient care and in clinical integration leading to value-based care. 0% 1% 2% 3% 4% 5% 6% 7% 440 460 480 500 520 540 560 580 600 2009 2010 2011 2012 2013 Outpatient Visits (In thousands) 50% 50% 49% 47% 45% 28% 29% 29% 30% 31% 19% 19% 19% 20% 21% 0% 10% 20% 30% 40% 50% 60% 70% 80% 90% 100% 2009 2010 2011 2012 2013 Revenue Diversification Hospital Outpatient Physician Other Outpatient- Growth Area Up 2.9% from 2011
- 18. © 2014 Health Catalyst www.healthcatalyst.com Proprietary and Confidential Follow the discussion on Twitter, #TimeforAnalytics 2014… The year of 18 Outpatient Home Physician Hospice Cemetery Skilled Nursing FacilityInpatient Home Health Care Population-Centric Management Population Health
- 19. © 2014 Health Catalyst www.healthcatalyst.com Proprietary and Confidential Follow the discussion on Twitter, #TimeforAnalytics 2014… The year of 19 The Physician Quality Reporting System (PQRS) has been using incentive payments, and will begin to use payment adjustments in 2015, to encourage eligible health care professionals (EPs) to report on specific quality measures. EPs who do not participate in 2013 and receive a payment adjustment will be paid 1.5% less than the than the Medicare PFS amount for services provided in 2015. Increases to 2% in 2016. 2013 P2014 F2014 Measures 258 296 284 Measures Removed N/A 46 45 PQRS
- 20. © 2014 Health Catalyst www.healthcatalyst.com Proprietary and Confidential Follow the discussion on Twitter, #TimeforAnalytics 2014… The year of 20 2013 1% 2014 2% 2015 3% Readmission • 2013- 1% $280M for 2,213 hospitals - Average fine .42% • 2014- 2% $227M for 2,225 hospitals - Average fine .38% • Overall readmit rate for Medicare 18.4%(down from 19%) Adds hip/knee and COPD to program In FY 15 RAC Audit Reference pricing Retail Readmit rate 2015
- 21. © 2014 Health Catalyst www.healthcatalyst.com Proprietary and Confidential Follow the discussion on Twitter, #TimeforAnalytics 2014… The year of Represent 14% of expenses in California hospitals- second largest category of expenses. What are best practices? 21 2011 Supply Per Adjusted Discharge Small Medium Large Major Teaching All $ 961 $ 1,176 $ 1,434 $ 2,076 $ 1,354 CMI adjusted Source: HFMA Supply Chain
- 22. © 2014 Health Catalyst www.healthcatalyst.com Proprietary and Confidential Follow the discussion on Twitter, #TimeforAnalytics 2014… The year of 22 Two midnight rule Starting Oct 2013, CMS introduced the two midnight rule. The final rule for the 2014 Inpatient Prospective Payment System stated an appropriate inpatient admission is when the patient stays in the hospital for at least two midnights.
- 23. © 2014 Health Catalyst www.healthcatalyst.com Proprietary and Confidential Follow the discussion on Twitter, #TimeforAnalytics 2014… The year of 23 Inpatient grew at -1.5% over 2011 And Outpatient grew 2.9%. Inpatient Surgeries declined -2.2%. 100 120 140 160 180 200 220 240 260 280 1981 1986 1991 1996 2001 2006 2011 IPdaysinmillions US Inpatient Days US Inpatient Days -5% -4% -3% -2% -1% 0% 1% 2% 3% 4% 5% 6% 210 215 220 225 230 235 240 2009 2010 2011 2012 2013 DischargesThousands Mid West System Discharges
- 24. © 2014 Health Catalyst www.healthcatalyst.com Proprietary and Confidential Follow the discussion on Twitter, #TimeforAnalytics 2014… The year of Adding 2 new outcome measures for 2015: PSI, CLABSI Adding new efficiency: Medicare Spending per Beneficiary 24 2013 1%` 2014 1.25% 2015 1.5% 70% 45% 20% 10% 10% 30% 30% 30% 25% 25% 25% 30% 40% 40% 20% 25% 25% 0% 10% 20% 30% 40% 50% 60% 70% 80% 90% 100% FY 2013 FY 2014 FY 2015 FY 2016 FY 2017 Clinical Process Patient Experience Outcome Measures Efficiency Measures Metric Weighting Value Based Purchasing
- 25. © 2014 Health Catalyst www.healthcatalyst.com Proprietary and Confidential Follow the discussion on Twitter, #TimeforAnalytics 2014… The year of W 25 Workflow 2012 study by former Centers for Medicare and Medicaid Services (CMS) administrator Donald M. Berwick and RAND Corporation analyst Andrew D. Hackbarth estimated waste consumed $476 billion to $992 billion, or 18 percent to 37 percent of healthcare spending. Waste
- 26. © 2014 Health Catalyst www.healthcatalyst.com Proprietary and Confidential Follow the discussion on Twitter, #TimeforAnalytics 2014… The year of Extra Yellow Zebra Year of the Horse 26
- 27. © 2014 Health Catalyst www.healthcatalyst.com Proprietary and Confidential Follow the discussion on Twitter, #TimeforAnalytics Now what? Learning culture Focus and measurement Get ready Remember the value equation Value= Quality / Cost 27
- 28. © 2014 Health Catalyst www.healthcatalyst.com Proprietary and Confidential Follow the discussion on Twitter, #TimeforAnalytics Questions 28 • Learn about the Health Catalyst approach http://www.healthcatalyst.com/catalyst- approach/ • Contact us to learn more about our solutions and communication tools www.healthcatalyst.com/company/contact-us
Editor's Notes
- 28