Data compareCanna 001
- 1. Stuck Assy Problem by Design Problem
Specification data
Part name : Cover Printer
Part code : 1061380-00
Model : Canna/Caviar
Drawing No. : 1061380-01
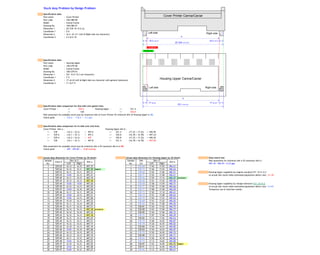
Dimension 1 : (E) 530 +0/-0.6 (L)
Coordinate 1 : E-6
Dimension 2 : 16.2 +0/-0.1 Left & Right side (no character)
Coordinate 2 : E-2 & E-10
Specification data
Part name : Housing Upper
Part code : 1061379-00
Model : Canna/Caviar
Drawing No. : 1061379-01
Dimension 1 : 531 +0.4/-0.2 (no character)
Coordinate 1 : F-5
Dimension 2 : 17 ±0.22 Left & Right side (no character with general tolerance)
Coordinate 2 : F-1 & F-9
Specification data comparison for Out-side Line (green line)
Cover Printer : >> 530.6 Housing Upper : >> 531.4
<< 530 << 530.8
Risk assesment for probably stuck assy by maximum dim of Cover Printer VS minimum dim of Housing Upper is OK.
Check point : 530.8 - 530.6 = 0.2 gap
Specification data comparison for In-side Line (red line)
Cover Printer dim a : Housing Upper dim b :
>> 530 - (16.2 + 16.2) = 497.6 >> 531.4 - (17.22 + 17.22) = 496.96
<< 529.4 - (16.1 + 16.1) = 497.2 << 530.8 - (16.78 + 16.78) = 497.24
<> 529.4 - (16.2 + 16.2) = 497 <> 530.8 - (17.22 + 17.22) = 496.36
>< 530 - (16.1 + 16.1) = 497.8 >< 531.4 - (16.78 + 16.78) = 497.84
Risk assesment for probably stuck assy by minimum dim a VS maximum dim b is NG.
Check point : 497 - 497.84 = -0.84 overlap
Actual data dimension for Cover Printer by 30 shoots Actual data dimension for Housing Upper by 30 shoots Data match test
Risk assesment for minimum dim a VS maximum dim b :
Left Right Left Right 497.18 - 496.95 = 0.23 gap
1 529.65 16.13 16.15 497.37 1 530.68 17.02 17.05 496.61
2 529.62 16.12 16.11 497.39 bigest 2 530.73 17.06 17.03 496.64
3 529.53 16.11 16.11 497.31 3 530.60 17.03 17.06 496.51 Housing Upper capability by original standard 531 +0.4/-0.2
4 529.43 16.09 16.13 497.21 4 530.71 17.02 17.08 496.61
5 529.45 16.11 16.15 497.19 5 530.66 17.03 17.16 496.47 smallest
6 529.43 16.12 16.13 497.18 6 530.60 17.01 17.03 496.56
7 529.44 16.09 16.09 497.26 7 530.68 17.08 17.09 496.51 Housing Upper capability by change tolerance 531 +0/-0.6
8 529.50 16.12 16.13 497.25 8 530.71 17.05 17.00 496.66 at actual dim result make estimated population dafect rate : 0.04%
9 529.47 16.09 16.10 497.28 9 530.77 17.08 17.00 496.69 Temporary use at injection vendor.
10 529.46 16.11 16.11 497.24 10 530.73 17.02 17.10 496.61
11 529.43 16.09 16.13 497.21 11 530.74 17.01 17.08 496.65
12 529.49 16.08 16.13 497.28 12 530.70 17.02 17.03 496.65
13 529.44 16.10 16.11 497.23 13 530.68 17.01 17.02 496.65
14 529.54 16.11 16.14 497.29 14 530.66 17.02 17.08 496.56
15 529.44 16.11 16.12 497.21 15 530.81 17.04 17.02 496.75
16 529.45 16.14 16.13 497.18 smallest 16 530.80 17.03 17.00 496.77
17 529.45 16.10 16.10 497.25 17 530.82 17.04 17.06 496.72
18 529.43 16.12 16.13 497.18 18 530.72 17.07 17.06 496.59
19 529.49 16.12 16.12 497.25 19 530.82 17.16 17.02 496.64
20 529.44 16.12 16.11 497.21 20 530.79 17.00 16.92 496.87
21 529.41 16.12 16.12 497.17 21 530.78 17.20 16.93 496.65
22 529.42 16.10 16.13 497.19 22 530.80 17.04 16.91 496.85
23 529.46 16.08 16.10 497.28 23 530.84 17.04 16.93 496.87
24 529.43 16.13 16.15 497.15 24 530.70 17.03 16.92 496.75
25 529.45 16.13 16.13 497.19 25 530.80 17.12 16.97 496.71
26 529.50 16.11 16.12 497.27 26 530.65 17.02 16.78 496.85
27 529.46 16.09 16.10 497.27 27 530.75 17.12 16.83 496.80
28 529.47 16.10 16.12 497.25 28 530.87 17.03 16.89 496.95 bigest
29 529.50 16.09 16.13 497.28 29 530.91 17.13 16.96 496.82
30 529.47 16.08 16.12 497.27 30 530.66 17.12 16.93 496.61
Dim 17
Dim b
at actual dim result make estimated population defect rate : 21.4%
Sample
No.
Chart E
Dim 16.2
Dim a
Sample
No.
Dim
531
531 +0.4/-0.2
17 ±0.22
Left side Right side
Housing Upper Canna/Caviar
Cover Printer Canna/Caviar
17 ±0.22
b
16.2 +0/-0.1 16.2 +0/-0.1
(E) 530 +0/-0.6 L
a
Left side Right side
In-side line
Out-side line