1. www.sematopia.com Jan 1, 2006 - Apr 26, 2011
Dashboard Comparing to: Site
Visits
2,000 2,000
1,000 1,000
0 0
Jan 2 Jun 27 Dec 20 Jun 14 Dec 7 May 31 Nov 23 May 18 Nov 10 May 5 Oct 28 Apr 22
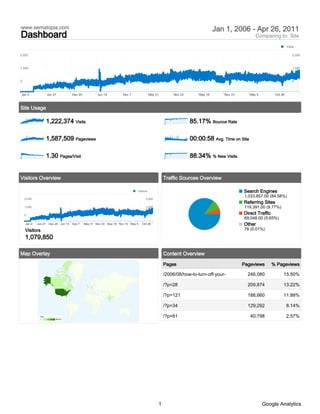
Site Usage
1,222,374 Visits 85.17% Bounce Rate
1,587,509 Pageviews 00:00:58 Avg. Time on Site
1.30 Pages/Visit 88.34% % New Visits
Visitors Overview Traffic Sources Overview
Visitors Search Engines
1,033,857.00 (84.58%)
2,000 2,000
Referring Sites
1,000 1,000 119,391.00 (9.77%)
0 0
Direct Traffic
69,048.00 (5.65%)
Jan 2 Jun 27 Dec 20 Jun 14 Dec 7 May 31 Nov 23 May 18 Nov 10 May 5 Oct 28 Apr 22 Other
Visitors 78 (0.01%)
1,079,850
Map Overlay Content Overview
Pages Pageviews % Pageviews
/2006/08/how-to-turn-off-your- 246,080 15.50%
/?p=28 209,874 13.22%
/?p=121 188,660 11.88%
/?p=34 129,292 8.14%
Visits
585,622
/?p=61 40,798 2.57%
1
1 Google Analytics
2. www.sematopia.com Jan 1, 2006 - Apr 26, 2011
Visitors Overview Comparing to: Site
Visitors
2,000 2,000
1,000 1,000
0 0
Jan 2 Jun 27 Dec 20 Jun 14 Dec 7 May 31 Nov 23 May 18 Nov 10 May 5 Oct 28 Apr 22
1,079,850 people visited this site
1,222,374 Visits
1,079,850 Absolute Unique Visitors
1,587,509 Pageviews
1.30 Average Pageviews
00:00:58 Time on Site
85.17% Bounce Rate
88.34% New Visits
Technical Profile
Browser Visits % visits Connection Speed Visits % visits
Firefox 558,523 45.69% Unknown 430,938 35.25%
Internet Explorer 482,871 39.50% Cable 318,037 26.02%
Chrome 68,921 5.64% DSL 307,152 25.13%
Safari 66,919 5.47% T1 117,575 9.62%
Opera 26,532 2.17% Dialup 41,498 3.39%
2 Google Analytics
3. www.sematopia.com Jan 1, 2006 - Apr 26, 2011
Traffic Sources Overview Comparing to: Site
Visits
2,000 2,000
1,000 1,000
0 0
Jan 2 Jun 27 Dec 20 Jun 14 Dec 7 May 31 Nov 23 May 18 Nov 10 May 5 Oct 28 Apr 22
All traffic sources sent a total of 1,222,374 visits
5.65% Direct Traffic Search Engines
1,033,857.00 (84.58%)
Referring Sites
9.77% Referring Sites 119,391.00 (9.77%)
Direct Traffic
69,048.00 (5.65%)
84.58% Search Engines Other
78 (0.01%)
Top Traffic Sources
Sources Visits % visits Keywords Visits % visits
google (organic) 949,900 77.71% learn ajax 24,426 2.36%
(direct) ((none)) 69,048 5.65% php rest 13,973 1.35%
yahoo (organic) 37,709 3.08% check engine light 13,911 1.35%
drweb.de (referral) 21,340 1.75% free php ide 9,297 0.90%
stumbleupon.com (referral) 12,612 1.03% learning ajax 8,769 0.85%
3 Google Analytics
4. www.sematopia.com Jan 1, 2006 - Apr 26, 2011
Content Overview Comparing to: Site
Pageviews
3,000 3,000
1,500 1,500
0 0
Jan 2 Jun 27 Dec 20 Jun 14 Dec 7 May 31 Nov 23 May 18 Nov 10 May 5 Oct 28 Apr 22
Pages on this site were viewed a total of 1,587,509 times
1,587,509 Pageviews
1,363,241 Unique Views
85.17% Bounce Rate
Top Content
Pages Pageviews % Pageviews
/2006/08/how-to-turn-off-your-check-engine-light/ 246,080 15.50%
/?p=28 209,874 13.22%
/?p=121 188,660 11.88%
/?p=34 129,292 8.14%
/?p=61 40,798 2.57%
4 Google Analytics
5. www.sematopia.com Jan 1, 2006 - Apr 26, 2011
Map Overlay Comparing to: Site
Visits
1 585,622
1,222,374 visits came from 223 countries/territories
Site Usage
Visits Pages/Visit Avg. Time on Site % New Visits Bounce Rate
1,222,374 1.30 00:00:58 88.38% 85.17%
% of Site Total: Site Avg: Site Avg: Site Avg: Site Avg:
100.00% 1.30 (0.00%) 00:00:58 (0.00%) 88.34% (0.05%) 85.17% (0.00%)
Country/Territory Visits Pages/Visit Avg. Time on % New Visits Bounce Rate
Site
United States 585,622 1.23 00:00:51 91.54% 87.34%
Canada 81,923 1.36 00:01:05 87.01% 83.36%
India 70,900 1.52 00:01:20 86.00% 81.06%
United Kingdom 64,274 1.31 00:00:58 86.20% 84.20%
Germany 46,590 1.53 00:01:10 85.40% 79.38%
Australia 24,517 1.30 00:00:59 87.18% 84.22%
France 18,713 1.29 00:00:59 83.29% 84.84%
Netherlands 18,147 1.32 00:00:56 87.11% 83.63%
Italy 13,594 1.27 00:00:51 87.31% 84.46%
5 Google Analytics