Download to read offline
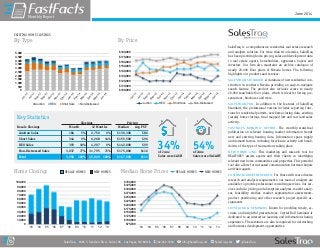

Supply and demand continue to exist in a state of relative equilibrium in the Las Vegas housing market. Prices in both the resale and new home market remain relatively stable, even as the mix of sales continues to evolve away from distressed transactions. Just over a third of sales during the month were to cash buyers compared to 55 percent a year ago, signaling significant investor pullback


