csx 2139FE10-4B11-4C82-BD4F-5D64241207D9_AAR_2009_WK03_csx
- 1. CSX
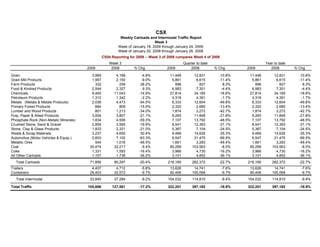
Weekly Carloads and Intermodal Traffic Report
Week 3
Week of January 18, 2009 through January 24, 2009
Week of January 20, 2008 through January 26, 2008
CS54 Reporting for 2009 -- Week 3 of 2009 compares Week 4 of 2008
Week 3 Quarter to date Year to date
2009 2008 % Chg 2009 2008 % Chg 2009 2008 % Chg
Grain 3,969 4,168 -4.8% 11,448 12,831 -10.8% 11,448 12,831 -10.8%
Grain Mill Products 1,957 2,150 -9.0% 5,861 6,615 -11.4% 5,861 6,615 -11.4%
Farm Products 332 259 28.2% 896 827 8.3% 896 827 8.3%
Food & Kindred Products 2,544 2,327 9.3% 6,983 7,301 -4.4% 6,983 7,301 -4.4%
Chemicals 9,400 11,043 -14.9% 27,814 34,185 -18.6% 27,814 34,185 -18.6%
Petroleum Products 1,312 1,342 -2.2% 4,318 4,391 -1.7% 4,318 4,391 -1.7%
Metals (Metals & Metals Products) 2,036 4,473 -54.5% 6,333 12,604 -49.8% 6,333 12,604 -49.8%
Primary Forest Products 684 809 -15.5% 2,320 2,680 -13.4% 2,320 2,680 -13.4%
Lumber and Wood Products 801 1,213 -34.0% 1,874 3,272 -42.7% 1,874 3,272 -42.7%
Pulp, Paper & Allied Products 3,004 3,807 -21.1% 9,265 11,848 -21.8% 9,265 11,848 -21.8%
Phosphate Rock (Non-Metalic Minerals) 1,834 4,506 -59.3% 7,107 13,792 -48.5% 7,107 13,792 -48.5%
Crushed Stone, Sand & Gravel 2,854 3,565 -19.9% 8,541 12,393 -31.1% 8,541 12,393 -31.1%
Stone, Clay & Glass Products 1,833 2,321 -21.0% 5,367 7,104 -24.5% 5,367 7,104 -24.5%
Waste & Scrap Materials 3,237 4,650 -30.4% 9,468 14,626 -35.3% 9,468 14,626 -35.3%
Automotive (Motor Vehicles & Equip.) 2,603 7,102 -63.3% 6,547 21,475 -69.5% 6,547 21,475 -69.5%
Metallic Ores 544 1,016 -46.5% 1,661 3,283 -49.4% 1,661 3,283 -49.4%
Coal 30,474 32,217 -5.4% 95,299 103,563 -8.0% 95,299 103,563 -8.0%
Coke 1,331 1,593 -16.4% 3,966 4,730 -16.2% 3,966 4,730 -16.2%
All Other Carloads 1,107 1,736 -36.2% 3,101 4,852 -36.1% 3,101 4,852 -36.1%
Total Carloads 71,856 90,297 -20.4% 218,169 282,372 -22.7% 218,169 282,372 -22.7%
Trailers 4,437 4,712 -5.8% 13,626 14,741 -7.6% 13,626 14,741 -7.6%
Containers 29,403 32,572 -9.7% 90,406 100,069 -9.7% 90,406 100,069 -9.7%
Total Intermodal 33,840 37,284 -9.2% 104,032 114,810 -9.4% 104,032 114,810 -9.4%
Total Traffic 105,696 127,581 -17.2% 322,201 397,182 -18.9% 322,201 397,182 -18.9%