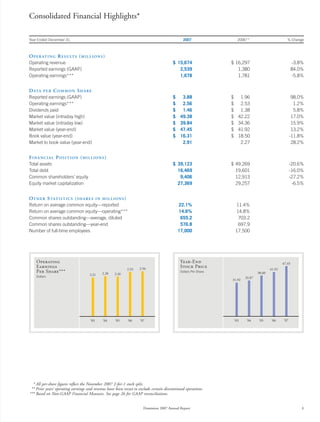
1. Consolidated Financial Highlights*
Year Ended December 31, 2007 2006** % Change
O P E R AT I N G R E S U LT S ( M I L L I O N S )
Operating revenue $ 15,674 $ 16,297 -3.8%
Reported earnings (GAAP) 2,539 1,380 84.0%
Operating earnings*** 1,678 1,781 -5.8%
D ATA COMMON SHARE
PER
Reported earnings (GAAP) $ 3.88 $ 1.96 98.0%
Operating earnings*** $ 2.56 $ 2.53 1.2%
Dividends paid $ 1.46 $ 1.38 5.8%
Market value (intraday high) $ 49.38 $ 42.22 17.0%
Market value (intraday low) $ 39.84 $ 34.36 15.9%
Market value (year-end) $ 47.45 $ 41.92 13.2%
Book value (year-end) $ 16.31 $ 18.50 -11.8%
Market to book value (year-end) 2.91 2.27 28.2%
FINANCIAL POSITION (MILLIONS)
Total assets $ 39,123 $ 49,269 -20.6%
Total debt 16,469 19,601 -16.0%
Common shareholders’ equity 9,406 12,913 -27.2%
Equity market capitalization 27,369 29,257 -6.5%
OT H E R S TAT I S T I C S ( S H A R E S IN MILLIONS)
Return on average common equity—reported 22.1% 11.4%
Return on average common equity—operating*** 14.6% 14.8%
Common shares outstanding—average, diluted 655.2 703.2
Common shares outstanding—year-end 576.8 697.9
Number of full-time employees 17,000 17,500
Year-End
Operating 47.45
Stock Price
Earnings 2.56
2.53 41.92
Per Share*** Dollars Per Share 38.60
2.28 2.26
2.21
Dollars 33.87
31.92
’07
’07 ’03 ’04 ’05 ’06
’03 ’04 ’05 ’06
* All per-share figures reflect the November 2007 2-for-1 stock split.
** Prior years’ operating earnings and revenue have been recast to exclude certain discontinued operations.
*** Based on Non-GAAP Financial Measures. See page 26 for GAAP reconciliations.
Dominion 2007 Annual Report 1