SlideShare a Scribd company logo
1 of 11
Day 15 Probability Models.notebook                                        April 03, 2013


          AIM: Probability Models


                                      Do Now
           The star basketball player for a professional basketball team

           gets hurt    of the way through the last basketball season. On
           the timeline below are the wins and losses of the team with and
           without their star player.

                          29 wins and 11 losses        7 wins and 13 losses

         Start of season                                           End of Season
                                                  Injury!


           This year the team expects to play the same number of games
           as last year, and their star player will only miss the first quarter
           of the year. If the team maintains the same proportion of wins
           and losses with and without their star player as they did last
           year, approximately how many games should fans expect the
           team win this year?

                 A   24
                 B   27
                 C   36
                 D   38


                                                                                           1
Day 15 Probability Models.notebook                              April 03, 2013


    Common Core Math Standard 7.SP.7

    Develop a probability model (which may not be uniform) by observing
    frequencies in data generated from a chance process.

    For example, find the approximate probability that a spinning penny
    will land heads up or that a tossed paper cup will land open-end down.
    Do the outcomes for the spinning penny appear to be equally likely
    based on the observed frequencies?


                                                                                 2
Day 15 Probability Models.notebook                              April 03, 2013


                              Anticipatory Set

           Today we will create a Probability Model for spinning a
           penny and tossing a paper cup. A Probability Model is a
           mathematical representation of a random phenomenon,
           which includes the sample space and the probability
           associated with each event.

          Sample Space of Spinning a Penny:


          Sample Space of Tossing a Paper Cup:


                                                                                 3
Day 15 Probability Models.notebook                             April 03, 2013


       Predicted Probabilities associated with Spinning a Penny:


       Predicted Probabilities associated with Tossing a Paper Cup:


                                                                                4
Day 15 Probability Models.notebook                               April 03, 2013


           Questions:
           1.) Explain your predicted probabilities associated
           with Spinning a Penny.


           2.) Explain your predicted probabilities associated
           with Tossing a Paper Cup.


                                                                                  5
Day 15 Probability Models.notebook   April 03, 2013


                                                      6
Day 15 Probability Models.notebook                              April 03, 2013


        Experimental Probabilities associated with Spinning a Penny:


        Experimental Probabilities associated with Tossing a Paper
        Cup:


                                                                                 7
Day 15 Probability Models.notebook                             April 03, 2013


      Questions:
      1.) How did your predicted probabilities compare with the
      experimental probabilities?


      2.) What are the key differences between a penny and a cup that
      effects the probability models?


      3.) How would you re-design the cup to increase the likelihood of
      the cup landing open-end down.


                                                                                8
Day 15 Probability Models.notebook                                                                     April 03, 2013


                               Coin Spin Unfair?

            If the coin is spun, rather than tossed, it can have a much­larger­than­50% chance of ending with the 
            heavier side down. Spun coins can exhibit “huge bias” (some spun coins will fall tails­up 80% of the 
            time).


                                      Coin Flipper


                                                                                                                        9
Day 15 Probability Models.notebook             April 03, 2013


                               Homework

                        Prepare for Friday's
                        Probability Quiz


                                                                10
Attachments


     Develop a probability model.doc

     Day 12 Theoretical Probability.pdf

More Related Content

Viewers also liked

Day 10 experiment with dice
Day 10 experiment with diceDay 10 experiment with dice
Day 10 experiment with diceErik Tjersland
 
Day 4 Area Of Polygons
Day 4 Area Of PolygonsDay 4 Area Of Polygons
Day 4 Area Of PolygonsErik Tjersland
 
Assessment sample questions
Assessment sample questionsAssessment sample questions
Assessment sample questionsErik Tjersland
 
Day 8 irregular figures
Day 8 irregular figuresDay 8 irregular figures
Day 8 irregular figuresErik Tjersland
 
Day 1 Intro To Functions
Day 1 Intro To FunctionsDay 1 Intro To Functions
Day 1 Intro To FunctionsErik Tjersland
 
Day 5 box plots part 1
Day 5 box plots part 1Day 5 box plots part 1
Day 5 box plots part 1Erik Tjersland
 
Day 3 Angles In Polygons
Day 3 Angles In PolygonsDay 3 Angles In Polygons
Day 3 Angles In PolygonsErik Tjersland
 
Day 12 factoring trinomials senteo
Day 12 factoring trinomials senteoDay 12 factoring trinomials senteo
Day 12 factoring trinomials senteoErik Tjersland
 

Viewers also liked (11)

Day 15 Surface Area
Day 15 Surface AreaDay 15 Surface Area
Day 15 Surface Area
 
Day 14 surface area
Day 14 surface areaDay 14 surface area
Day 14 surface area
 
Day 10 experiment with dice
Day 10 experiment with diceDay 10 experiment with dice
Day 10 experiment with dice
 
Day 4 Area Of Polygons
Day 4 Area Of PolygonsDay 4 Area Of Polygons
Day 4 Area Of Polygons
 
Assessment sample questions
Assessment sample questionsAssessment sample questions
Assessment sample questions
 
Day 8 irregular figures
Day 8 irregular figuresDay 8 irregular figures
Day 8 irregular figures
 
Day 1 Intro To Functions
Day 1 Intro To FunctionsDay 1 Intro To Functions
Day 1 Intro To Functions
 
Day 5 box plots part 1
Day 5 box plots part 1Day 5 box plots part 1
Day 5 box plots part 1
 
Day 3 Angles In Polygons
Day 3 Angles In PolygonsDay 3 Angles In Polygons
Day 3 Angles In Polygons
 
Day 12 factoring trinomials senteo
Day 12 factoring trinomials senteoDay 12 factoring trinomials senteo
Day 12 factoring trinomials senteo
 
Polynomial stations
Polynomial stationsPolynomial stations
Polynomial stations
 

More from Erik Tjersland

Linear equations lesson 8 day 2 graphing linear equations
Linear equations lesson 8 day 2 graphing linear equationsLinear equations lesson 8 day 2 graphing linear equations
Linear equations lesson 8 day 2 graphing linear equationsErik Tjersland
 
Linear equations lesson 8 day 1 graphing linear equations
Linear equations lesson 8 day 1 graphing linear equationsLinear equations lesson 8 day 1 graphing linear equations
Linear equations lesson 8 day 1 graphing linear equationsErik Tjersland
 
Linear equations lesson 7 slope formula
Linear equations lesson 7 slope formulaLinear equations lesson 7 slope formula
Linear equations lesson 7 slope formulaErik Tjersland
 
Module 4.5 lesson 10 scale area
Module 4.5 lesson 10 scale areaModule 4.5 lesson 10 scale area
Module 4.5 lesson 10 scale areaErik Tjersland
 
Module 4.5 lesson 9 computing actual lengths
Module 4.5 lesson 9 computing actual lengthsModule 4.5 lesson 9 computing actual lengths
Module 4.5 lesson 9 computing actual lengthsErik Tjersland
 
Linear equations lesson 6 slope
Linear equations lesson 6 slopeLinear equations lesson 6 slope
Linear equations lesson 6 slopeErik Tjersland
 
Module 4.5 lesson 7 scale factor as a percent
Module 4.5 lesson 7 scale factor as a percentModule 4.5 lesson 7 scale factor as a percent
Module 4.5 lesson 7 scale factor as a percentErik Tjersland
 
Module 4.5 lesson 6 scale map
Module 4.5 lesson 6 scale mapModule 4.5 lesson 6 scale map
Module 4.5 lesson 6 scale mapErik Tjersland
 
Linear equations lesson 5 horizontal and vertical lines
Linear equations lesson 5 horizontal and vertical linesLinear equations lesson 5 horizontal and vertical lines
Linear equations lesson 5 horizontal and vertical linesErik Tjersland
 
Module 4.5 lesson 4 scale area problems
Module 4.5 lesson 4 scale area problemsModule 4.5 lesson 4 scale area problems
Module 4.5 lesson 4 scale area problemsErik Tjersland
 
Module 4.5 lesson 3 computing actual lengths from scale drawings
Module 4.5 lesson 3 computing actual lengths from scale drawingsModule 4.5 lesson 3 computing actual lengths from scale drawings
Module 4.5 lesson 3 computing actual lengths from scale drawingsErik Tjersland
 
Module 4.5 lesson 2 unit rate as the scale factor
Module 4.5 lesson 2 unit rate as the scale factorModule 4.5 lesson 2 unit rate as the scale factor
Module 4.5 lesson 2 unit rate as the scale factorErik Tjersland
 
Linear equations lesson 4 graphing linear equations
Linear equations lesson 4 graphing linear equationsLinear equations lesson 4 graphing linear equations
Linear equations lesson 4 graphing linear equationsErik Tjersland
 
Module 4.5 lesson 1 scale drawings
Module 4.5 lesson 1 scale drawingsModule 4.5 lesson 1 scale drawings
Module 4.5 lesson 1 scale drawingsErik Tjersland
 
Review for module 4 exam
Review for module 4 examReview for module 4 exam
Review for module 4 examErik Tjersland
 
Linear equations lesson 3 consecutive integers
Linear equations lesson 3 consecutive integersLinear equations lesson 3 consecutive integers
Linear equations lesson 3 consecutive integersErik Tjersland
 
14 mixed review with percents with answers
14   mixed review with percents with answers14   mixed review with percents with answers
14 mixed review with percents with answersErik Tjersland
 
Module 4 lesson 12 relative error
Module 4 lesson 12 relative errorModule 4 lesson 12 relative error
Module 4 lesson 12 relative errorErik Tjersland
 
Linear equations lesson 2 geometric word problems
Linear equations lesson 2 geometric word problemsLinear equations lesson 2 geometric word problems
Linear equations lesson 2 geometric word problemsErik Tjersland
 

More from Erik Tjersland (20)

Linear equations lesson 8 day 2 graphing linear equations
Linear equations lesson 8 day 2 graphing linear equationsLinear equations lesson 8 day 2 graphing linear equations
Linear equations lesson 8 day 2 graphing linear equations
 
Linear equations lesson 8 day 1 graphing linear equations
Linear equations lesson 8 day 1 graphing linear equationsLinear equations lesson 8 day 1 graphing linear equations
Linear equations lesson 8 day 1 graphing linear equations
 
Linear equations lesson 7 slope formula
Linear equations lesson 7 slope formulaLinear equations lesson 7 slope formula
Linear equations lesson 7 slope formula
 
Module 4.5 lesson 10 scale area
Module 4.5 lesson 10 scale areaModule 4.5 lesson 10 scale area
Module 4.5 lesson 10 scale area
 
Module 4.5 lesson 9 computing actual lengths
Module 4.5 lesson 9 computing actual lengthsModule 4.5 lesson 9 computing actual lengths
Module 4.5 lesson 9 computing actual lengths
 
Linear equations lesson 6 slope
Linear equations lesson 6 slopeLinear equations lesson 6 slope
Linear equations lesson 6 slope
 
Module 4.5 lesson 7 scale factor as a percent
Module 4.5 lesson 7 scale factor as a percentModule 4.5 lesson 7 scale factor as a percent
Module 4.5 lesson 7 scale factor as a percent
 
Module 4.5 lesson 6 scale map
Module 4.5 lesson 6 scale mapModule 4.5 lesson 6 scale map
Module 4.5 lesson 6 scale map
 
Linear equations lesson 5 horizontal and vertical lines
Linear equations lesson 5 horizontal and vertical linesLinear equations lesson 5 horizontal and vertical lines
Linear equations lesson 5 horizontal and vertical lines
 
Module 4.5 lesson 4 scale area problems
Module 4.5 lesson 4 scale area problemsModule 4.5 lesson 4 scale area problems
Module 4.5 lesson 4 scale area problems
 
Module 4.5 lesson 3 computing actual lengths from scale drawings
Module 4.5 lesson 3 computing actual lengths from scale drawingsModule 4.5 lesson 3 computing actual lengths from scale drawings
Module 4.5 lesson 3 computing actual lengths from scale drawings
 
Module 4.5 lesson 2 unit rate as the scale factor
Module 4.5 lesson 2 unit rate as the scale factorModule 4.5 lesson 2 unit rate as the scale factor
Module 4.5 lesson 2 unit rate as the scale factor
 
Linear equations lesson 4 graphing linear equations
Linear equations lesson 4 graphing linear equationsLinear equations lesson 4 graphing linear equations
Linear equations lesson 4 graphing linear equations
 
Module 4.5 lesson 1 scale drawings
Module 4.5 lesson 1 scale drawingsModule 4.5 lesson 1 scale drawings
Module 4.5 lesson 1 scale drawings
 
Review for module 4 exam
Review for module 4 examReview for module 4 exam
Review for module 4 exam
 
Linear equations lesson 3 consecutive integers
Linear equations lesson 3 consecutive integersLinear equations lesson 3 consecutive integers
Linear equations lesson 3 consecutive integers
 
14 mixed review with percents with answers
14   mixed review with percents with answers14   mixed review with percents with answers
14 mixed review with percents with answers
 
Module 4 lesson 13
Module 4 lesson 13Module 4 lesson 13
Module 4 lesson 13
 
Module 4 lesson 12 relative error
Module 4 lesson 12 relative errorModule 4 lesson 12 relative error
Module 4 lesson 12 relative error
 
Linear equations lesson 2 geometric word problems
Linear equations lesson 2 geometric word problemsLinear equations lesson 2 geometric word problems
Linear equations lesson 2 geometric word problems
 

Day 15 probability models

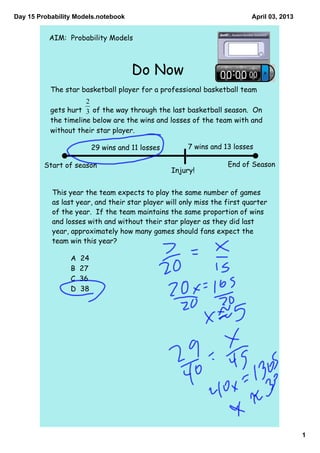
  • 1. Day 15 Probability Models.notebook April 03, 2013 AIM: Probability Models Do Now The star basketball player for a professional basketball team gets hurt of the way through the last basketball season. On the timeline below are the wins and losses of the team with and without their star player. 29 wins and 11 losses 7 wins and 13 losses Start of season End of Season Injury! This year the team expects to play the same number of games as last year, and their star player will only miss the first quarter of the year. If the team maintains the same proportion of wins and losses with and without their star player as they did last year, approximately how many games should fans expect the team win this year? A 24 B 27 C 36 D 38 1
  • 2. Day 15 Probability Models.notebook April 03, 2013 Common Core Math Standard 7.SP.7 Develop a probability model (which may not be uniform) by observing frequencies in data generated from a chance process. For example, find the approximate probability that a spinning penny will land heads up or that a tossed paper cup will land open-end down. Do the outcomes for the spinning penny appear to be equally likely based on the observed frequencies? 2
  • 3. Day 15 Probability Models.notebook April 03, 2013 Anticipatory Set Today we will create a Probability Model for spinning a penny and tossing a paper cup. A Probability Model is a mathematical representation of a random phenomenon, which includes the sample space and the probability associated with each event. Sample Space of Spinning a Penny: Sample Space of Tossing a Paper Cup: 3
  • 4. Day 15 Probability Models.notebook April 03, 2013 Predicted Probabilities associated with Spinning a Penny: Predicted Probabilities associated with Tossing a Paper Cup: 4
  • 5. Day 15 Probability Models.notebook April 03, 2013 Questions: 1.) Explain your predicted probabilities associated with Spinning a Penny. 2.) Explain your predicted probabilities associated with Tossing a Paper Cup. 5
  • 7. Day 15 Probability Models.notebook April 03, 2013 Experimental Probabilities associated with Spinning a Penny: Experimental Probabilities associated with Tossing a Paper Cup: 7
  • 8. Day 15 Probability Models.notebook April 03, 2013 Questions: 1.) How did your predicted probabilities compare with the experimental probabilities? 2.) What are the key differences between a penny and a cup that effects the probability models? 3.) How would you re-design the cup to increase the likelihood of the cup landing open-end down. 8
  • 9. Day 15 Probability Models.notebook April 03, 2013 Coin Spin Unfair? If the coin is spun, rather than tossed, it can have a much­larger­than­50% chance of ending with the  heavier side down. Spun coins can exhibit “huge bias” (some spun coins will fall tails­up 80% of the  time). Coin Flipper 9
  • 10. Day 15 Probability Models.notebook April 03, 2013 Homework Prepare for Friday's Probability Quiz 10
  • 11. Attachments Develop a probability model.doc Day 12 Theoretical Probability.pdf