Download to read offline
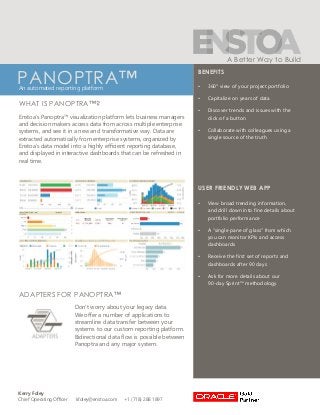

Enstoa’s Panoptra™ visualization platform lets business managers and decision makers access data from across multiple enterprise systems, and see it in a new and transformative way. Data are extracted automatically from enterprise systems, organized by Enstoa’s data model into a highly efficient reporting database, and displayed in interactive dashboards that can be refreshed in real time.


