1. Benchmarking collective motions in Elastic Network Models
Fuglebakk
*.,
E
Reuter
*.,
N
Hinsen
§.
K
!
The work reveals potential problems with interpreting crystallographic B-factors as thermal fluctuations
of solvated proteins. Since collective motions are restrained in the crystalline environment, relying on
B-factors for parameterization leads to overly stiff models.
Edvin Fuglebakk
University of Bergen
Edvin.Fuglebakk@uib.no
* Deartment of Molecular Biology, University of Bergen, Norway and Computational Biology Unit, University of Bergen, Norway
§ Centre de Biophysique Moléculaire (UPR 4302 CNRS), Orléans, France and Synchrotron SOLEIL, Division Expériences, Saint Aubin, France
1.0
Null model
A model with equal variance along all principal
components was constructed and denoted 𝚺0. The effect
of stiffening long range interactions is illustrated below by
the ANM which has uniform force constants for pairs of
atoms within a distance cutoff, and no interaction past that
cutoff.
C
0
1.0
0
1.0
1.0
!
myoglobin
!
0
C
lysozyme
Elastic Network Models
Elastic network models (ENMs) models a protein structure as a
network of Hookean springs, connecting each pair of atoms or pair of
residues. From the harmonic potential (U) we can calculate the
covariance matrix (𝚺) of the (Gaussian) Boltzmann distribution of
these models, as well as the atomic fluctuations.
prion
C
!
F
!
B
F
B
F
B
0.8
!
!
C
C
0.6
!
C
0)
!
!
2
!
0
1.0
0
1.0
0
1.0
F
B
F
B
F
prion
lysozyme
myoglobin
B
phospholipase
trio
groel
0.0
The figure depicts an ENM of Hemoglobin. ri depicts the position of
atom i and ri0 the same position at the minimal potential energy. For
most models k is a function of interatomic distance.
0.4
0
rj
0.2
(i,j)2atom pairs
rj )
0
ri
groel
U=
1
0 0
k(ri , rj ) (ri
2
trio
!
X
phospholipase
!
CB( ,
!
0.8
Measures
We compare the coupled motion of elastic network models and
Molecular Dynamics simulations with CB1/n where CB is the
Bhattacharyya coefficient and n is the degrees of freedom (rank of
covariance matrices). For ENMs the Boltzmann distribution (p) is
Gaussian and CB is:
!
!
!
CB =
Z
1
4
2
(pA (r) pB (r)) dr =
|⌃A | |⌃B |
1
2
1
4
(⌃A + ⌃B )
atcase
C
0
1.0
HCA, REACH, GM
ANM0.8
ANM1.8
pfANM
GNM0.8
B
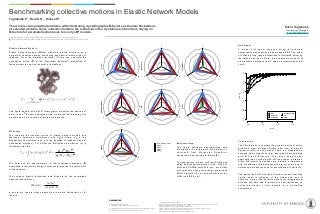
The comparison is done with four ENMs with
weak long-range interactions (HCA, REACH,
βGM and ANM0.8 (cutoff=0.8 nm), two ENMs
with relatively strong long-range interactions
ANM1.8 (cutoff=1.8 nm) and pfANM, and the
GNM (cutoff=0.8 nm).
We here use an approximation to the covariance matrices (𝚺)
expressed in the more principal components required to explain 95%
of the variance.
!
We compare atomic fluctuations and B-factors by the normalized
squared inner product:
!
T
Benchmarking
The figure contrasts benchmarking with
covariances (C), and atomic fluctuations (F),
obtained from Molecular Dynamics
simulations, and isotropic B-factors (B).
!
!
!
2
a b
SIP(a, b) = T
(a a) (bT b)
!
a and b are vectors whose elements are atomic fluctuations or Bfactors.
REFERENCES
!
The poster summarizes the article:
E. Fuglebakk, N. Reuter, and K. Hinsen, JCTC, 2013.
!
The Bhattacharyya distance was first used for comparing coupled protein motion in:
E. Fuglebakk, J. Echave, and N. Reuter, Bioinformatics, 2012.
!
1.8
2.3
cutoff
1
2
F
1.3
!
!
The elastic network models compared:
HCA: K. Hinsen, A.-J. Petrescu, S. Dellerue, M.-C. Bellissent-Funel, and G. R. Kneller, Chem. Phys., 2000.
REACH: K. Moritsugu and J. C. Smith, Biophys. J.,2007.
βGM: C. Micheletti, P. Carloni, and A. Maritan, Proteins, 2004.
ANM: A. Atilgan, S. Durell, R. Jernigan, M. Demirel, O. Keskin, and I. Bahar, Biophys. J., 2001.
pfANM: L. Yang, G. Song, and R. Jernigan, PNAS., 2009.
GNM: I. Bahar, A. R. Atilgan, and B. Erman, Folding Des., 1997.
Conclusions
The CB allows us to compare the coupled motion of atoms
predicted from different ENMs and from Molecular
Dynamics (MD) or a null model. There is a disagreement
between which models perform best when benchmarking
with MD and B-factors, the latter being better
approximated by models with stiff long range interaction.
Since MD atomic fluctuations are typically in agreement
with covariances, the discrepancies are not solely due to
difference in measures used for quantification of similarity.
!
Comparing the ANM with the null model, reveals that high
cutoffs leads to stiffening of the model and loss of
collective motion. We therefore believe the disagreement
between MD-data and B-factors are due restrictions on
collective motion of the protein in a crystalline
environment.