All Major US Inflation Indicators Fall Below Fed Targets in May
•Download as PPTX, PDF•
1 like•1,728 views

All major US inflation measures fell below the Fed's target of 2 percent during May.

Recommended
Recommended
More Related Content
What's hot
What's hot (20)
Viewers also liked
Viewers also liked (7)
Similar to All Major US Inflation Indicators Fall Below Fed Targets in May
Similar to All Major US Inflation Indicators Fall Below Fed Targets in May (20)
More from Ed Dolan
More from Ed Dolan (20)
Recently uploaded
Recently uploaded (20)
All Major US Inflation Indicators Fall Below Fed Targets in May
- 1. Data for the Classroom from Ed Dolan’s Econ Blog http://dolanecon.blogspot.com/ US Inflation Data: All Inflation Indicators Point Sharply Lower in May Posted June 14, 2012 Terms of Use: These slides are made available under Creative Commons License Attribution— Share Alike 3.0 . You are free to use these slides as a resource for your economics classes together with whatever textbook you are using. If you like the slides, you may also want to take a look at my textbook, Introduction to Economics, from BVT Publishers.
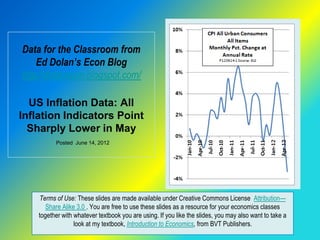
- 2. Headline CPI Falls in May at Fastest Rate since 2008 The headline number in the latest BLS inflation report, the seasonally adjusted Consumer Price Index (CPI- U) fell by .3 percent in May Using unrounded data and stating the monthly change at an annual rate, seasonally adjusted inflation was -3.31 percent, the sharpest decrease since 2008 Without seasonal adjustment, the CPI decreased at an annual rate of about 1.2 percent in April Posted June 14, 2012 on Ed Dolan’s Econ Blog http://dolanecon.blogspot.com
- 3. Core Inflation was Sharply Lower on Weak Energy Prices Food and energy prices are volatile and usually account for much of the month-to-month change in the CPI Their effect can be removed by taking food and energy out of the CPI. The result is called the core inflation rate. The monthly change in core inflation, stated at an annual rate, was 0.24 percent in May, down sharply form April Seasonally adjusted energy prices fell by more than 4 percent in May, and gasoline by more than 6 percent Posted June 14, 2012 on Ed Dolan’s Econ Blog http://dolanecon.blogspot.com
- 4. Trimmed Mean Inflation Follows Core Down Another way to remove volatility is the 16% trimmed mean CPI published by the Federal Reserve Bank of Cleveland. It removes the 8% of prices that increase most and the 8% that increase least in each month, whatever they are The 16 percent trimmed mean CPI increased at an annual rate of 1.1 percent in May, down sharply from the April rate Posted June 14, 2012 on Ed Dolan’s Econ Blog http://dolanecon.blogspot.com
- 5. Which Measure is Best? The CPI for all items gives the most accurate measure of current changes in the cost of living Economists at the Fed look closely at the core and trimmed mean CPIs to judge the effect of monetary policy on underlying inflationary trends The Fed considers inflation of about 2 percent to be consistent with prudent monetary policy All of the measures shown fell short of the Fed’s target in May Posted June 14, 2012 on Ed Dolan’s Econ Blog http://dolanecon.blogspot.com
- 6. The Longer Term Trend To see longer term trends in inflation, it is useful to look at year- on-year changes, which compare each month’s price level with that of the same month in the year before All y-o-y measures of inflation rates slowed during the global recession, then rose again for most of 2011. The three measures shown here have moved steadily downward in 2012. All are close to or below the Fed’s targets Posted June 14, 2012 on Ed Dolan’s Econ Blog http://dolanecon.blogspot.com