SlideShare a Scribd company logo
1 of 1
Download to read offline
First Quarter 2011                                                                Toronto CMA Condominium Apartment Completions
                                                                                  (Annualized, 12-Month Moving Average)
GTA Resale Condo Market Remained Resilient in Q1 2011                                  18,000
                                                                                       16,000
New condominium apartment completions continued to trend upward in the                 14,000
Greater Toronto Area during the last half of 2010 and first quarter of 2011.           12,000
                                                                                       10,000
Many of these completions translated into listings on the TorontoMLS®
                                                                                        8,000
system as investors and buyers whose housing needs had changed during                   6,000
the construction period listed their units for sale. This resulted in increased         4,000
                                                                                        2,000
supply in the resale condominium apartment market. It is important to note,
                                                                                            0
however, that we have not seen an over-supply situation emerge.

Sales of condominium apartments continue to account for a healthy share of
                                                                                  Source: CMHC; TREB Adjustment
listings. Resale market conditions for condos in the first quarter of 2011
were not as tight as those experienced in the first three months of 2010, but     Condominium Apartment Sales-to-Active Listings Ratio and
we continued to see enough competition between buyers to exert upward             Median Price Growth (All Areas)
                                                                                                                   70%   Annual Median Price Change (Right Scale)      25%
pressure on the median condominium apartment selling price. During the


                                                                                                                                                                              Annual Median Price Growth
                                                                                                                   60%   Sales-to-Active Listings Ratio (Left Scale)   20%


                                                                                  Sales-to-Active Listings ratio
first three months of the year, the median selling price ranged between
                                                                                                                   50%                                                 15%
$280,000 and $302,000. This resulted in year-over-year price growth
                                                                                                                   40%                                                 10%
ranging between four and five per cent, which is a sustainable pace of
                                                                                                                   30%                                                 5%
growth reflecting more balanced market conditions compared to the same
                                                                                                                   20%                                                 0%
period in 2010 when double-digit annual price growth was reported.
                                                                                                                   10%                                                 -5%
The rates of price growth reported through the first quarter were in line with                                     0%                                                  -10%
what was reported for all housing types in the GTA and in line with overall
expectations for 2011.
                                                                                   Source: Toronto Real Estate Board
                                                                                   Written By:
                                                                                   Jason Mercer
                                                                                   TREB Senior Manager of Market Analysis.
                                                                                   jmercer@trebnet.com

More Related Content

More from Brent Reid

TREB Housing Market Charts - September 2013
TREB Housing Market Charts - September 2013TREB Housing Market Charts - September 2013
TREB Housing Market Charts - September 2013Brent Reid
 
TREB Housing Market Charts
TREB Housing Market ChartsTREB Housing Market Charts
TREB Housing Market ChartsBrent Reid
 
TREB Housing Market Charts - July 2013
TREB Housing Market Charts - July 2013TREB Housing Market Charts - July 2013
TREB Housing Market Charts - July 2013Brent Reid
 
TREB Housing Market Charts -- April 2013
TREB Housing Market Charts -- April 2013TREB Housing Market Charts -- April 2013
TREB Housing Market Charts -- April 2013Brent Reid
 
Toronto Real Estate Board Housing Market Charts for March 2013
Toronto Real Estate Board Housing Market Charts for March 2013Toronto Real Estate Board Housing Market Charts for March 2013
Toronto Real Estate Board Housing Market Charts for March 2013Brent Reid
 
Treb housing market_charts-march_2013
Treb housing market_charts-march_2013Treb housing market_charts-march_2013
Treb housing market_charts-march_2013Brent Reid
 
TREB Housing Market Charts February 2013
TREB Housing Market Charts February 2013TREB Housing Market Charts February 2013
TREB Housing Market Charts February 2013Brent Reid
 
Toronto (TREB) Housing Market Charts January 2013
Toronto (TREB) Housing Market Charts January 2013Toronto (TREB) Housing Market Charts January 2013
Toronto (TREB) Housing Market Charts January 2013Brent Reid
 
TREB Housing Market Charts December 2012
TREB Housing Market Charts December 2012TREB Housing Market Charts December 2012
TREB Housing Market Charts December 2012Brent Reid
 
TREB Housing Market Charts November 2012
TREB Housing Market Charts November 2012TREB Housing Market Charts November 2012
TREB Housing Market Charts November 2012Brent Reid
 
Homebuyers' Road Map by CREA
Homebuyers' Road Map by CREAHomebuyers' Road Map by CREA
Homebuyers' Road Map by CREABrent Reid
 
TREB Housing Market Charts for October 2012
TREB Housing Market Charts for October 2012TREB Housing Market Charts for October 2012
TREB Housing Market Charts for October 2012Brent Reid
 
TREB Housing Market Charts -- September 2012
TREB Housing Market Charts -- September 2012TREB Housing Market Charts -- September 2012
TREB Housing Market Charts -- September 2012Brent Reid
 
TREB Housing Market Charts August 2012
TREB Housing Market Charts August 2012TREB Housing Market Charts August 2012
TREB Housing Market Charts August 2012Brent Reid
 
TREB Housing Market Charts for July 2012
TREB Housing Market Charts for July 2012TREB Housing Market Charts for July 2012
TREB Housing Market Charts for July 2012Brent Reid
 
TREB Housing Market Charts June 2012
TREB Housing Market Charts June 2012TREB Housing Market Charts June 2012
TREB Housing Market Charts June 2012Brent Reid
 
TREB Housing Market Charts -- May 2012
TREB Housing Market Charts -- May 2012TREB Housing Market Charts -- May 2012
TREB Housing Market Charts -- May 2012Brent Reid
 
TREB Housing Market Charts -- April 2012
TREB Housing Market Charts -- April 2012TREB Housing Market Charts -- April 2012
TREB Housing Market Charts -- April 2012Brent Reid
 
TREB Housing Market Charts March 2012
TREB Housing Market Charts March 2012TREB Housing Market Charts March 2012
TREB Housing Market Charts March 2012Brent Reid
 
TREB Housing Market Charts February 2012
TREB Housing Market Charts February 2012TREB Housing Market Charts February 2012
TREB Housing Market Charts February 2012Brent Reid
 

More from Brent Reid (20)

TREB Housing Market Charts - September 2013
TREB Housing Market Charts - September 2013TREB Housing Market Charts - September 2013
TREB Housing Market Charts - September 2013
 
TREB Housing Market Charts
TREB Housing Market ChartsTREB Housing Market Charts
TREB Housing Market Charts
 
TREB Housing Market Charts - July 2013
TREB Housing Market Charts - July 2013TREB Housing Market Charts - July 2013
TREB Housing Market Charts - July 2013
 
TREB Housing Market Charts -- April 2013
TREB Housing Market Charts -- April 2013TREB Housing Market Charts -- April 2013
TREB Housing Market Charts -- April 2013
 
Toronto Real Estate Board Housing Market Charts for March 2013
Toronto Real Estate Board Housing Market Charts for March 2013Toronto Real Estate Board Housing Market Charts for March 2013
Toronto Real Estate Board Housing Market Charts for March 2013
 
Treb housing market_charts-march_2013
Treb housing market_charts-march_2013Treb housing market_charts-march_2013
Treb housing market_charts-march_2013
 
TREB Housing Market Charts February 2013
TREB Housing Market Charts February 2013TREB Housing Market Charts February 2013
TREB Housing Market Charts February 2013
 
Toronto (TREB) Housing Market Charts January 2013
Toronto (TREB) Housing Market Charts January 2013Toronto (TREB) Housing Market Charts January 2013
Toronto (TREB) Housing Market Charts January 2013
 
TREB Housing Market Charts December 2012
TREB Housing Market Charts December 2012TREB Housing Market Charts December 2012
TREB Housing Market Charts December 2012
 
TREB Housing Market Charts November 2012
TREB Housing Market Charts November 2012TREB Housing Market Charts November 2012
TREB Housing Market Charts November 2012
 
Homebuyers' Road Map by CREA
Homebuyers' Road Map by CREAHomebuyers' Road Map by CREA
Homebuyers' Road Map by CREA
 
TREB Housing Market Charts for October 2012
TREB Housing Market Charts for October 2012TREB Housing Market Charts for October 2012
TREB Housing Market Charts for October 2012
 
TREB Housing Market Charts -- September 2012
TREB Housing Market Charts -- September 2012TREB Housing Market Charts -- September 2012
TREB Housing Market Charts -- September 2012
 
TREB Housing Market Charts August 2012
TREB Housing Market Charts August 2012TREB Housing Market Charts August 2012
TREB Housing Market Charts August 2012
 
TREB Housing Market Charts for July 2012
TREB Housing Market Charts for July 2012TREB Housing Market Charts for July 2012
TREB Housing Market Charts for July 2012
 
TREB Housing Market Charts June 2012
TREB Housing Market Charts June 2012TREB Housing Market Charts June 2012
TREB Housing Market Charts June 2012
 
TREB Housing Market Charts -- May 2012
TREB Housing Market Charts -- May 2012TREB Housing Market Charts -- May 2012
TREB Housing Market Charts -- May 2012
 
TREB Housing Market Charts -- April 2012
TREB Housing Market Charts -- April 2012TREB Housing Market Charts -- April 2012
TREB Housing Market Charts -- April 2012
 
TREB Housing Market Charts March 2012
TREB Housing Market Charts March 2012TREB Housing Market Charts March 2012
TREB Housing Market Charts March 2012
 
TREB Housing Market Charts February 2012
TREB Housing Market Charts February 2012TREB Housing Market Charts February 2012
TREB Housing Market Charts February 2012
 

TREB Condo Market Commentary

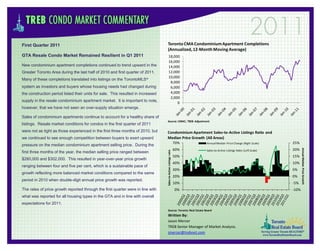
  • 1. First Quarter 2011 Toronto CMA Condominium Apartment Completions (Annualized, 12-Month Moving Average) GTA Resale Condo Market Remained Resilient in Q1 2011 18,000 16,000 New condominium apartment completions continued to trend upward in the 14,000 Greater Toronto Area during the last half of 2010 and first quarter of 2011. 12,000 10,000 Many of these completions translated into listings on the TorontoMLS® 8,000 system as investors and buyers whose housing needs had changed during 6,000 the construction period listed their units for sale. This resulted in increased 4,000 2,000 supply in the resale condominium apartment market. It is important to note, 0 however, that we have not seen an over-supply situation emerge. Sales of condominium apartments continue to account for a healthy share of Source: CMHC; TREB Adjustment listings. Resale market conditions for condos in the first quarter of 2011 were not as tight as those experienced in the first three months of 2010, but Condominium Apartment Sales-to-Active Listings Ratio and we continued to see enough competition between buyers to exert upward Median Price Growth (All Areas) 70% Annual Median Price Change (Right Scale) 25% pressure on the median condominium apartment selling price. During the Annual Median Price Growth 60% Sales-to-Active Listings Ratio (Left Scale) 20% Sales-to-Active Listings ratio first three months of the year, the median selling price ranged between 50% 15% $280,000 and $302,000. This resulted in year-over-year price growth 40% 10% ranging between four and five per cent, which is a sustainable pace of 30% 5% growth reflecting more balanced market conditions compared to the same 20% 0% period in 2010 when double-digit annual price growth was reported. 10% -5% The rates of price growth reported through the first quarter were in line with 0% -10% what was reported for all housing types in the GTA and in line with overall expectations for 2011. Source: Toronto Real Estate Board Written By: Jason Mercer TREB Senior Manager of Market Analysis. jmercer@trebnet.com