1. Released at 7:00 a.m. Eastern time in The Daily, January 7, 2011
Labour Force Survey
December 2010 Note to readers
Following the release of final population estimates from each
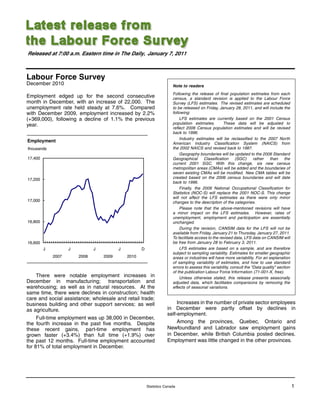
Employment edged up for the second consecutive census, a standard revision is applied to the Labour Force
month in December, with an increase of 22,000. The Survey (LFS) estimates. The revised estimates are scheduled
unemployment rate held steady at 7.6%. Compared to be released on Friday, January 28, 2011, and will include the
with December 2009, employment increased by 2.2% following:
(+369,000), following a decline of 1.1% the previous LFS estimates are currently based on the 2001 Census
year. population estimates. These data will be adjusted to
reflect 2006 Census population estimates and will be revised
back to 1996.
Industry estimates will be reclassified to the 2007 North
Employment American Industry Classification System (NAICS) from
thousands the 2002 NAICS and revised back to 1987.
Geography boundaries will be updated to the 2006 Standard
17,400 Geographical Classification (SGC) rather than the
current 2001 SGC. With this change, six new census
metropolitan areas (CMAs) will be added and the boundaries of
seven existing CMAs will be modified. New CMA tables will be
17,200 created based on the 2006 census boundaries and will date
back to 1996.
Finally, the 2006 National Occupational Classification for
Statistics (NOC-S) will replace the 2001 NOC-S. This change
will not affect the LFS estimates as there were only minor
17,000 changes to the description of the categories.
Please note that the above-mentioned revisions will have
a minor impact on the LFS estimates. However, rates of
unemployment, employment and participation are essentially
16,800 unchanged.
During the revision, CANSIM data for the LFS will not be
available from Friday, January 21 to Thursday, January 27, 2011.
To facilitate access to the revised data, LFS data on CANSIM will
16,600 be free from January 28 to February 3, 2011.
J J J J D LFS estimates are based on a sample, and are therefore
subject to sampling variability. Estimates for smaller geographic
2007 2008 2009 2010 areas or industries will have more variability. For an explanation
of sampling variability of estimates, and how to use standard
errors to assess this variability, consult the "Data quality" section
of the publication Labour Force Information (71-001-X, free).
There were notable employment increases in Unless otherwise stated, this release presents seasonally
December in manufacturing; transportation and adjusted data, which facilitates comparisons by removing the
warehousing; as well as in natural resources. At the effects of seasonal variations.
same time, there were declines in construction; health
care and social assistance; wholesale and retail trade;
business building and other support services; as well Increases in the number of private sector employees
as agriculture. in December were partly offset by declines in
self-employment.
Full-time employment was up 38,000 in December,
the fourth increase in the past five months. Despite Among the provinces, Quebec, Ontario and
these recent gains, part-time employment has Newfoundland and Labrador saw employment gains
grown faster (+3.4%) than full time (+1.9%) over in December, while British Columbia posted declines.
the past 12 months. Full-time employment accounted Employment was little changed in the other provinces.
for 81% of total employment in December.
Statistics Canada 1
2. Compared with December 2009, however, employment
Unemployment rate was up by 8.1% (+50,000).
%
Agricultural employment fell by 8,000 in December,
9.0 bringing total losses to 4.2% (-13,000) over the
past 12 months.
8.5
More people working in the private sector
8.0
The number of private sector employees increased
7.5
by 53,000 in December, while self-employment fell
by 38,000. At the same time, public sector employment
was little changed.
7.0
Over the past 12 months, 332,000 (+3.1%)
6.5 employees were added to the private sector
and 143,000 (+4.2%) to the public sector. The number
6.0
of self-employed declined by 106,000 (-3.9%) over the
same period.
5.5
Employment gains in Quebec, Ontario and
J J J J D
Newfoundland and Labrador
2007 2008 2009 2010
Employment in Quebec increased by 25,000 in
December, pushing the unemployment rate
Strong gains in manufacturing and transportation down 0.3 percentage points to 7.6%. With December’s
and warehousing gain, Quebec employment was up 102,000 (+2.6%)
from a year earlier.
Following a decline of 29,000 the previous month, In Ontario, employment increased for the second
manufacturing employment increased by 66,000 in consecutive month, up 23,000 in December. The
December. The bulk of the gains were in Ontario and unemployment rate edged down 0.1 percentage points
Quebec and were spread across a number of industries. to 8.1%. With December’s increase, the number of
This follows little overall change in the manufacturing workers in Ontario grew by 2.8% (+186,000) from a
sector in the previous 18 months. year earlier, above the national growth rate of 2.2%.
Transportation and warehousing also saw a notable Over the 12 months of 2009, Ontario’s employment was
gain in December (+45,000). With this gain, employment down 1.8%, the largest decline among all provinces.
in this industry was up 10.8% (+85,000) compared with Newfoundland and Labrador saw employment
December 2009. increases of 2,500 in December, bringing total
Employment in natural resources increased employment growth in the province to 4.6% (+9,900)
by 7,700 in December, bringing growth in the industry compared with the same month a year earlier, the
to 10.8% (+33,000) over the past 12 months. fastest rate of growth in the country.
Employment in construction fell by 27,000 in Employment in British Columbia fell by 23,000 in
December, the first notable decline since July 2009. December, pushing the unemployment rate
Despite this decline, construction employment was up 0.7 percentage points to 7.6%. Compared with
up 4.8% over the past 12 months. December 2009, employment in the province grew
In December, employment in health care and social by 1.5% (+35,000).
assistance declined by 24,000, following gains the
previous month. Employment growth in this industry More youths working in December
totalled 3.3% (+67,000) from a year earlier.
Employment in wholesale and retail trade fell Following a large decline in the number of 15-
by 22,000 in December. However, employment in this to 24-year-olds participating in the labour market in
industry was relatively stable in 2010 (+0.7%). November, youth employment increased by 26,000 in
Business, building and other support services December. Employment was little changed for the other
also saw employment losses in December (-18,000). demographic groups.
2 Statistics Canada
3. Compared with December 2009, youth employment to 4.0% in the fourth quarter of 2010, the lowest
was up 1.8% (+42,000), below the overall employment nationally.
growth of 2.2%. Over the same period, people Nunavut saw employment gains of 900 in the
aged 55 and over saw their employment levels increase fourth quarter of 2010 compared with the same quarter
by 6.6% (+186,000), of which half was due to aging a year earlier. The unemployment rate increased
of the population, as the number of people in this age by 2.5 percentage points to 15.2%, as there were more
group grew by 3.3% over the period. While this age people participating in the labour market.
group makes up less than a third of the working-age
population, it accounted for 50% of the total employment Available on CANSIM: tables 282-0001 to 282-0042,
growth over the past 12 months. 282-0047 to 282-0064 and 282-0069 to 282-0108.
At the same time, people aged 25 to 54 saw their
employment level grow by 1.2% (+141,000), primarily Definitions, data sources and methods: survey
driven by men (+2.3%), compared with little growth number 3701.
among women (+0.1%).
A more detailed summary, Labour Force Information
Quarterly update on territories (71-001-X, free), is now available online for the week
ending December 11. From the Key resource module
The Labour Force Survey also collects labour of our website under Publications, choose All subjects,
market information about the territories. This information then Labour. LAN and bulk prices are available on
is produced monthly in the form of three-month moving request. The DVD-ROM Labour Force Historical
averages. Not all estimates are seasonally adjusted; Review, 2009 (71F0004X, $209), is now available. See
therefore, comparisons should only be made on a How to order products.
year-over-year basis.
Data tables are also now available online. From the
All three territories saw employment gains in the
Subject module of our website, choose Labour.
fourth quarter of 2010 compared with the same quarter
of 2009. The next release of the Labour Force Survey will be
In the Northwest Territories, employment rose on February 4.
by 1,300 in the fourth quarter of 2010. The For general information or to order data,
unemployment rate also increased by 1.7 percentage contact Client Services (toll-free 1-866-873-8788;
points to 7.7%, the result of an increase in the 613-951-4090; labour@statcan.gc.ca). To enquire
number of people seeking work. The participation rate about the concepts, methods or data quality of this
reached 73.0%, the highest in the country. release, contact Vincent Ferrao (613-951-4750;
In Yukon, employment rose by 1,000 during the vincent.ferrao@statcan.gc.ca) or Lahouaria Yssaad
three months ending in December 2010 compared (613-951-0627; lahouaria.yssaad@statcan.gc.ca),
with the same period in 2009. This increase pushed Labour Statistics Division.
the unemployment rate down by 3.5 percentage points
Statistics Canada 3
4. Labour force characteristics by age and sex
November December November December November December
2010 2010 to 2009 to 2009
December to December to
2010 December 2010 December
2010 2010
Seasonally adjusted
thousands change in thousands % change
Both sexes, 15 years and over
Population 27,868.9 27,894.2 25.3 403.5 0.1 1.5
Labour force 18,654.8 18,674.0 19.2 236.8 0.1 1.3
Employment 17,227.9 17,249.9 22.0 368.5 0.1 2.2
Full-time 13,898.3 13,936.3 38.0 259.1 0.3 1.9
Part-time 3,329.6 3,313.5 -16.1 109.2 -0.5 3.4
Unemployment 1,426.9 1,424.1 -2.8 -131.7 -0.2 -8.5
Participation rate 66.9 66.9 0.0 -0.2 ... ...
Unemployment rate 7.6 7.6 0.0 -0.8 ... ...
Employment rate 61.8 61.8 0.0 0.4 ... ...
Part-time rate 19.3 19.2 -0.1 0.2 ... ...
Youths, 15 to 24 years
Population 4,410.7 4,411.3 0.6 11.0 0.0 0.2
Labour force 2,787.0 2,824.8 37.8 -23.0 1.4 -0.8
Employment 2,407.5 2,433.9 26.4 41.9 1.1 1.8
Full-time 1,260.8 1,272.0 11.2 -0.3 0.9 0.0
Part-time 1,146.7 1,161.9 15.2 42.3 1.3 3.8
Unemployment 379.5 390.9 11.4 -65.0 3.0 -14.3
Participation rate 63.2 64.0 0.8 -0.7 ... ...
Unemployment rate 13.6 13.8 0.2 -2.2 ... ...
Employment rate 54.6 55.2 0.6 0.8 ... ...
Part-time rate 47.6 47.7 0.1 0.9 ... ...
Men, 25 years and over
Population 11,476.4 11,488.9 12.5 195.1 0.1 1.7
Labour force 8,414.0 8,414.7 0.7 146.7 0.0 1.8
Employment 7,836.1 7,844.7 8.6 235.1 0.1 3.1
Full-time 7,233.4 7,233.8 0.4 223.4 0.0 3.2
Part-time 602.7 610.9 8.2 11.7 1.4 2.0
Unemployment 577.9 570.0 -7.9 -88.3 -1.4 -13.4
Participation rate 73.3 73.2 -0.1 0.0 ... ...
Unemployment rate 6.9 6.8 -0.1 -1.2 ... ...
Employment rate 68.3 68.3 0.0 0.9 ... ...
Part-time rate 7.7 7.8 0.1 -0.1 ... ...
Women, 25 years and over
Population 11,981.7 11,994.1 12.4 197.5 0.1 1.7
Labour force 7,453.8 7,434.6 -19.2 113.2 -0.3 1.5
Employment 6,984.3 6,971.3 -13.0 91.5 -0.2 1.3
Full-time 5,404.1 5,430.5 26.4 36.1 0.5 0.7
Part-time 1,580.2 1,540.7 -39.5 55.3 -2.5 3.7
Unemployment 469.5 463.3 -6.2 21.7 -1.3 4.9
Participation rate 62.2 62.0 -0.2 -0.1 ... ...
Unemployment rate 6.3 6.2 -0.1 0.2 ... ...
Employment rate 58.3 58.1 -0.2 -0.2 ... ...
Part-time rate 22.6 22.1 -0.5 0.5 ... ...
... not applicable
Note: Related CANSIM table 282-0087.
4 Statistics Canada
5. Employment by class of worker and industry (based on NAICS)1
November December November December November December
2010 2010 to 2009 to 2009
December to December to
2010 December 2010 December
2010 2010
Seasonally adjusted
thousands change in thousands % change
Class of worker
Employees 14,556.1 14,616.0 59.9 474.9 0.4 3.4
Self-employed 2,671.9 2,633.9 -38.0 -106.4 -1.4 -3.9
Public/private sector employees
Public 3,572.6 3,580.0 7.4 142.9 0.2 4.2
Private 10,983.5 11,036.0 52.5 332.0 0.5 3.1
All industries 17,227.9 17,249.9 22.0 368.5 0.1 2.2
Goods-producing sector 3,787.4 3,828.2 40.8 111.6 1.1 3.0
Agriculture 310.0 302.0 -8.0 -13.3 -2.6 -4.2
Natural resources 330.9 338.6 7.7 32.9 2.3 10.8
Utilities 147.8 150.4 2.6 3.9 1.8 2.7
Construction 1,270.7 1,243.6 -27.1 57.2 -2.1 4.8
Manufacturing 1,727.9 1,793.6 65.7 31.0 3.8 1.8
Services-producing sector 13,440.5 13,421.7 -18.8 256.9 -0.1 2.0
Trade 2,694.3 2,671.9 -22.4 17.9 -0.8 0.7
Transportation and warehousing 830.0 874.5 44.5 85.1 5.4 10.8
Finance, insurance, real estate and leasing 1,085.5 1,087.4 1.9 -25.3 0.2 -2.3
Professional, scientific and technical services 1,275.2 1,281.3 6.1 39.4 0.5 3.2
Business, building and other support services 684.3 666.0 -18.3 49.9 -2.7 8.1
Educational services 1,217.9 1,208.2 -9.7 -20.5 -0.8 -1.7
Health care and social assistance 2,084.6 2,060.7 -23.9 66.7 -1.1 3.3
Information, culture and recreation 775.9 768.5 -7.4 -6.8 -1.0 -0.9
Accommodation and food services 1,063.5 1,067.0 3.5 11.9 0.3 1.1
Other services 755.1 759.7 4.6 -24.6 0.6 -3.1
Public administration 974.2 976.5 2.3 63.1 0.2 6.9
1. North American Industry Classification System.
Note: Related to CANSIM tables 282-0088 and 282-0089.
Statistics Canada 5
6. Labour force characteristics by province
November December November December November December
2010 2010 to 2009 to 2009
December to December to
2010 December 2010 December
2010 2010
Seasonally adjusted
thousands change in thousands % change
Newfoundland and Labrador
Population 432.0 432.0 0.0 1.5 0.0 0.3
Labour force 260.6 263.0 2.4 7.0 0.9 2.7
Employment 224.6 227.1 2.5 9.9 1.1 4.6
Full-time 192.6 194.7 2.1 7.8 1.1 4.2
Part-time 31.9 32.4 0.5 2.1 1.6 6.9
Unemployment 36.0 35.9 -0.1 -2.9 -0.3 -7.5
Participation rate 60.3 60.9 0.6 1.4 ... ...
Unemployment rate 13.8 13.7 -0.1 -1.5 ... ...
Employment rate 52.0 52.6 0.6 2.1 ... ...
Prince Edward Island
Population 118.3 118.4 0.1 2.0 0.1 1.7
Labour force 81.1 80.4 -0.7 0.6 -0.9 0.8
Employment 71.0 70.7 -0.3 -0.5 -0.4 -0.7
Full-time 58.3 58.6 0.3 0.4 0.5 0.7
Part-time 12.8 12.1 -0.7 -0.9 -5.5 -6.9
Unemployment 10.1 9.6 -0.5 1.0 -5.0 11.6
Participation rate 68.6 67.9 -0.7 -0.7 ... ...
Unemployment rate 12.5 11.9 -0.6 1.1 ... ...
Employment rate 60.0 59.7 -0.3 -1.5 ... ...
Nova Scotia
Population 777.3 777.5 0.2 3.0 0.0 0.4
Labour force 498.1 501.2 3.1 1.3 0.6 0.3
Employment 450.5 449.1 -1.4 -2.9 -0.3 -0.6
Full-time 364.2 368.7 4.5 -0.1 1.2 0.0
Part-time 86.3 80.3 -6.0 -3.0 -7.0 -3.6
Unemployment 47.6 52.1 4.5 4.3 9.5 9.0
Participation rate 64.1 64.5 0.4 0.0 ... ...
Unemployment rate 9.6 10.4 0.8 0.8 ... ...
Employment rate 58.0 57.8 -0.2 -0.6 ... ...
New Brunswick
Population 626.1 626.3 0.2 3.5 0.0 0.6
Labour force 403.0 400.5 -2.5 -0.7 -0.6 -0.2
Employment 361.7 362.8 1.1 -2.6 0.3 -0.7
Full-time 304.4 307.5 3.1 -2.0 1.0 -0.6
Part-time 57.3 55.3 -2.0 -0.6 -3.5 -1.1
Unemployment 41.4 37.7 -3.7 1.9 -8.9 5.3
Participation rate 64.4 63.9 -0.5 -0.5 ... ...
Unemployment rate 10.3 9.4 -0.9 0.5 ... ...
Employment rate 57.8 57.9 0.1 -0.8 ... ...
Quebec
Population 6,545.3 6,550.7 5.4 79.0 0.1 1.2
Labour force 4,272.3 4,285.5 13.2 73.3 0.3 1.7
Employment 3,935.5 3,960.2 24.7 101.8 0.6 2.6
Full-time 3,175.0 3,214.3 39.3 76.4 1.2 2.4
Part-time 760.5 745.8 -14.7 25.3 -1.9 3.5
Unemployment 336.8 325.4 -11.4 -28.4 -3.4 -8.0
Participation rate 65.3 65.4 0.1 0.3 ... ...
Unemployment rate 7.9 7.6 -0.3 -0.8 ... ...
Employment rate 60.1 60.5 0.4 0.9 ... ...
... not applicable
Note: Related CANSIM table 282-0087.
6 Statistics Canada
7. Labour force characteristics by province
November December November December November December
2010 2010 to 2009 to 2009
December to December to
2010 December 2010 December
2010 2010
Seasonally adjusted
thousands change in thousands % change
Ontario
Population 10,879.7 10,889.7 10.0 162.1 0.1 1.5
Labour force 7,288.7 7,303.5 14.8 113.3 0.2 1.6
Employment 6,690.4 6,712.9 22.5 185.5 0.3 2.8
Full-time 5,409.1 5,423.2 14.1 121.8 0.3 2.3
Part-time 1,281.3 1,289.7 8.4 63.8 0.7 5.2
Unemployment 598.4 590.7 -7.7 -72.1 -1.3 -10.9
Participation rate 67.0 67.1 0.1 0.1 ... ...
Unemployment rate 8.2 8.1 -0.1 -1.1 ... ...
Employment rate 61.5 61.6 0.1 0.8 ... ...
Manitoba
Population 942.1 943.1 1.0 14.5 0.1 1.6
Labour force 655.6 654.4 -1.2 13.5 -0.2 2.1
Employment 622.3 620.2 -2.1 16.2 -0.3 2.7
Full-time 503.2 502.4 -0.8 17.7 -0.2 3.7
Part-time 119.2 117.8 -1.4 -1.4 -1.2 -1.2
Unemployment 33.3 34.2 0.9 -2.8 2.7 -7.6
Participation rate 69.6 69.4 -0.2 0.4 ... ...
Unemployment rate 5.1 5.2 0.1 -0.6 ... ...
Employment rate 66.1 65.8 -0.3 0.8 ... ...
Saskatchewan
Population 795.5 796.1 0.6 11.8 0.1 1.5
Labour force 557.5 557.5 0.0 9.0 0.0 1.6
Employment 527.0 527.0 0.0 4.9 0.0 0.9
Full-time 432.9 433.6 0.7 8.0 0.2 1.9
Part-time 94.1 93.4 -0.7 -3.1 -0.7 -3.2
Unemployment 30.5 30.6 0.1 4.3 0.3 16.3
Participation rate 70.1 70.0 -0.1 0.1 ... ...
Unemployment rate 5.5 5.5 0.0 0.7 ... ...
Employment rate 66.2 66.2 0.0 -0.4 ... ...
Alberta
Population 2,947.2 2,951.1 3.9 55.8 0.1 1.9
Labour force 2,138.7 2,135.1 -3.6 -0.8 -0.2 0.0
Employment 2,018.8 2,016.4 -2.4 21.1 -0.1 1.1
Full-time 1,668.3 1,662.8 -5.5 31.0 -0.3 1.9
Part-time 350.5 353.6 3.1 -9.9 0.9 -2.7
Unemployment 119.9 118.7 -1.2 -21.9 -1.0 -15.6
Participation rate 72.6 72.3 -0.3 -1.5 ... ...
Unemployment rate 5.6 5.6 0.0 -1.0 ... ...
Employment rate 68.5 68.3 -0.2 -0.6 ... ...
British Columbia
Population 3,805.5 3,809.3 3.8 70.4 0.1 1.9
Labour force 2,499.1 2,492.9 -6.2 20.2 -0.2 0.8
Employment 2,326.1 2,303.6 -22.5 35.1 -1.0 1.5
Full-time 1,790.4 1,770.5 -19.9 -1.9 -1.1 -0.1
Part-time 535.7 533.1 -2.6 37.0 -0.5 7.5
Unemployment 173.0 189.3 16.3 -14.9 9.4 -7.3
Participation rate 65.7 65.4 -0.3 -0.7 ... ...
Unemployment rate 6.9 7.6 0.7 -0.7 ... ...
Employment rate 61.1 60.5 -0.6 -0.2 ... ...
... not applicable
Note: Related CANSIM table 282-0087.
Statistics Canada 7