Call Girls in Karkardooma Delhi +91 84487779280}Woman Seeking Man in Delhi NCR
Houston Retail Market Report 4Q 2010
1. Q4 2010 | RETAIL MARKET
HOUSTON RETAIL MARKET
RESEARCH & FORECAST REPORT
Houston Welcomes New Tenants to the Market
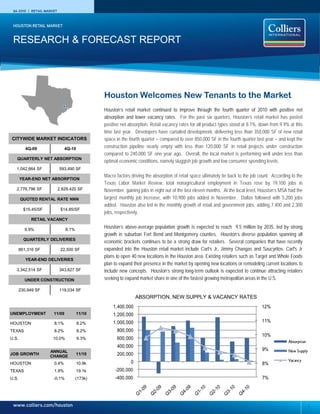
Houston’s retail market continued to improve through the fourth quarter of 2010 with positive net
absorption and lower vacancy rates. For the past six quarters, Houston’s retail market has posted
positive net absorption. Retail vacancy rates for all product types stood at 8.1%, down from 9.9% at this
time last year. Developers have curtailed development, delivering less than 350,000 SF of new retail
CITYWIDE MARKET INDICATORS space in the fourth quarter – compared to over 850,000 SF in the fourth quarter last year – and kept the
4Q-09 4Q-10 construction pipeline nearly empty with less than 120,000 SF in retail projects under construction
compared to 240,000 SF one year ago. Overall, the local market is performing well under less than
QUARTERLY NET ABSORPTION
optimal economic conditions, namely sluggish job growth and low consumer spending levels.
1,042,664 SF 593,490 SF
Macro factors driving the absorption of retail space ultimately tie back to the job count. According to the
YEAR-END NET ABSORPTION
Texas Labor Market Review, total nonagricultural employment in Texas rose by 19,100 jobs in
2,776,796 SF 2,829,420 SF November, gaining jobs in eight out of the last eleven months. At the local level, Houston’s MSA had the
QUOTED RENTAL RATE NNN largest monthly job increase, with 10,900 jobs added in November. Dallas followed with 5,200 jobs
added. Houston also led in the monthly growth of retail and government jobs, adding 7,400 and 2,300
$15.45/SF $14.85/SF
jobs, respectively.
RETAIL VACANCY
9.9% 8.1%
Houston’s above-average population growth is expected to reach 9.5 million by 2035, led by strong
growth in suburban Fort Bend and Montgomery counties. Houston’s diverse population spanning all
QUARTERLY DELIVERIES
economic brackets continues to be a strong draw for retailers. Several companies that have recently
861,316 SF 22,500 SF expanded into the Houston retail market include Carl’s Jr, Jimmy Changas and Saucyritos. Carl's Jr
plans to open 40 new locations in the Houston area. Existing retailers such as Target and Whole Foods
YEAR-END DELIVERIES
plan to expand their presence in the market by opening new locations or remodeling current locations to
3,342,514 SF 343,627 SF include new concepts. Houston’s strong long-term outlook is expected to continue attracting retailers
UNDER CONSTRUCTION seeking to expand market share in one of the fastest growing metropolitan areas in the U.S.
230,949 SF 119,034 SF
ABSORPTION, NEW SUPPLY & VACANCY RATES
1,400,000 12%
UNEMPLOYMENT 11/09 11/10 1,200,000
HOUSTON 8.1% 8.2% 1,000,000 11%
TEXAS 8.2% 8.2% 800,000
10%
U.S. 10.0% 9.3% 600,000
Absorption
400,000
ANNUAL 9% New Supply
JOB GROWTH
CHANGE
11/10 200,000
0 Vacancy
HOUSTON 0.4% 10.9k 8%
TEXAS 1.9% 19.1k -200,000
U.S. -0.1% (173k) -400,000 7%
www.colliers.com/houston 1
2. RESEARCH & FORECAST REPORT | Q4 2010 | HOUSTON RETAIL MARKET
YTD 2010 TOP RETAIL LEASES
Vacancy & Availability By property type, grocery-anchored
Houston’s retail vacancy rate fell to neighborhood centers led the market in
8.1% in the fourth quarter, down from the fourth quarter with 467,000 SF in
9.9% at this time last year. By product positive net absorption, followed by strip
type on a year-over-year basis, centers with 55,000 SF. Power centers,
community centers posted the largest malls, and community centers followed,
decrease of 370 basis points (bps) to posting positive net absorption of
9.3% vacancy, followed by strip and 50,000 SF, 41,000 SF, and 33,000 SF,
lifestyle centers which fell by 350 and respectively. Single-tenant space had
300 basis points to 10.2% and 5.3%, the only loss reporting (61,364) SF of
Fiesta Mart respectively. In contrast, outlet centers negative net absorption.
Willowchase Shopping Center
and theme/entertainment centers
Oct-10 92,818 SF
year-over-year vacancy rates rose by Rental Rates
690 and 120 bps, respectively.
Kohl’s Although the citywide average quoted
Atascocita Commons Houston’s retail vacancy has remained rental rate of $14.85 per SF NNN
July-10 88,827 SF relatively stable over the past six decreased 0.5% from $14.93 in the
consecutive quarters, with only one previous quarter, and 4.0% from $15.45
Joe V’s Smart Shop quarter, 3Q 2009, dipping below the in the fourth quarter of 2009, about half
San Jacinto Plaza 90% occupancy mark. Following the of the property types posted increases
Oct-10 65,784 SF nearly 100,000 jobs lost in 2009, in rental rates.
Houston is expected to end 2010 with
Malls posted an increase of 32.1% to
Joe V’s Smart Shop positive job growth, with retail and
$18.49 per SF NNN (from $14.00).
12035 Antoine Drive Retail government jobs leading the way in the
Outlet centers and lifestyle centers also
Mar-10 54,690 SF fourth quarter.
posted increases of 40.9% and 35.8%.
Limited new supply will also help the
Academy Sports and Outdoors market stabilize over the coming twelve
In contrast, on a year-over-year basis,
1360 Lake Woodlands Dr community centers’ average quoted
months. Year-end retail deliveries
Octg-10 51,463 SF rental rates fell 20.9% to $14.12 per SF
totaled only 344,000 SF, compared to
NNN (from $17.07 per SF), while
The Room Store the 3.3M SF of retail space added in
theme/entertainment centers’ rental
7666-7736 W FM 1960 2009. Four retail projects in the
rates decreased by 19.0% to $40.84 per
Oct-10 51,147 SF construction pipeline at the end of the
SF NNN (from $48.61 per SF).
fourth quarter totaled a combined
Academy Sports & Outdoors 119,000 SF, compared to 231,000 SF of
Pecan Park Plaza new retail space under construction in
Mar-10 50,300 SF fourth quarter of 2009, with developers
not likely to begin any significant
Second Baptist Church projects until economic conditions
12008 Shadow Creek Parkway
improve.
Aug-10 50,000 SF
Absorption & Demand
Office Depot For the sixth straight quarter, retail net
Cypress Pointe absorption was positive, adding 593,490
Mar-10 48,000 SF SF of positive net absorption to the
year-end total of 2.8M SF. On a
Best Savings Supermarket year-over-year basis, absorption
Lion Square declined from the 946,330 SF recorded
Nov-10 42,205 SF in fourth quarter of 2009.
2
3. RESEARCH & FORECAST REPORT | Q4 2010 | HOUSTON RETAIL MARKET
Sales Activity Leasing Activity
Investment sales for Houston’s retail Houston’s retail leasing activity reached
properties remain sluggish, with the 1.4 million SF in the fourth quarter,
limited availability of credit hampering compared to 1.5 million SF in the fourth
activity. There were 45 transactions in quarter of 2009. Overall, transactions
the fourth quarter with a total dollar under 20,000 SF comprised the largest
Atascocita Center volume of $34M, averaging $116 per group of retail leases, with the market
3820-3826 Atascocita Rd SF with an average 8.7% recording only eight leases over 50,000
Northeast/Lake Houston Submarket capitalization rate. SF in 2010. Several new retailers
RBA: 97,240 SF entered the market including Carl’s Jr,
Among the more significant retail sales
Built: 2003 Jimmy Changas and Saucyritos. Carl's Jr
were the following transactions:
Buyer: Westwood Financial Corp. plans to open 40 new locations in the
Westwood Financial Corp. acquired
Seller: Regency Centers Corp. Houston area. Target announced plans
Sale Date: October 2010 the 97,200 SF Atascocita Commons
to remodel eight area stores to expand
Sales Price: $9.8M located at 3820-3826 Atascocita Rd.
their P-Fresh grocery concept.
The property sold for $9.8M or $101
per SF. Significant retail leases signed through
the fourth quarter included: Fiesta Mart
Jamal Realty, LLC purchased a 12,900
in Willowchase Shopping Center
SF CVS Pharmacy located at 14115 E
renewed their 92,818 SF lease; Kohl’s
Sam Houston Parkway N from Lasco
88,827 SF lease in Atascocita Commons
Development for $4.8M or $372 per
(Kingwood); HEB’s newest retail concept
SF.
Joe V’s Smart Shop’s 54,690 SF lease at
Grace Business Investments 12035 Antoine Drive (Willowbrook) and
CVS purchased the 43,562 SF Shops at the 65,800 SF lease in San Jacinto
14115 E Sam Houston Pky N Almeda and Conn’s Appliance Center Plaza; Academy Sports and Outdoors’
Near Northeast Submarket building located at 10900 Gulf Freeway 50,300 SF lease at Pecan Park Plaza
RBA: 12,900 SF from SET Asset Properties LLC for (League City); Second Baptist Church’s
Built: 2007 $5.0M or $115 per SF. 50,000 SF lease at 12008 Shadow Creek
Buyer: Jamal Realty, LLC
Pky. (Far South); and Office Depot’s
Seller: Lasco Development
Sale Date: November 2010 48,000 SF lease at Cypress Pointe
Sales Price: $4.8M (Cypress).
For additional retail lease transactions signed
year-to-date, please see the select list on page two.
HOUSTON RETAIL MARKET SUMMARY
Direct Sublet Total
Direct Vacant Vacancy Sublet Vacancy Total Vacant Vacancy 4th Qtr Net Year-End Net Weighted Avg.
Rentable Area SF Rate Vacant SF Rate SF Rate Absorption Absorption Rental Rate NNN
Strip Centers 30,386,090 3,060,682 10.1% 24,754 0.1% 3,085,436 10.2% 55,341 764,710 $15.82
Neighborhood Centers 75,889,933 8,037,831 10.6% 124,707 0.2% 8,162,538 10.8% 466,934 1,274,548 $13.61
Community Centers 38,298,197 3,503,711 9.1% 42,452 0.1% 3,546,163 9.3% 32,531 392,215 $14.12
Power Centers 16,581,902 756,459 4.6% 66,944 0.4% 823,403 5.0% 49,592 436,110 $19.03
Lifestyle Centers 2,426,476 128,907 5.3% - 0.0% 128,907 5.3% 2,500 109,876 $31.52
Outlet Centers 1,228,700 102,117 8.3% - 0.0% 102,117 8.3% 5,100 9,530 $13.01
Theme/Entertainment 1,934,868 244,787 12.7% - 0.0% 244,787 12.7% 1,600 (92,988) $40.84
Single-Tenant 45,787,847 1,596,071 3.5% 34,554 0.1% 1,630,625 3.6% (61,364) (127,559) $11.53
Malls 31,020,048 1,882,937 6.1% 58,539 0.2% 1,941,476 6.3% 41,256 62,978 $18.49
Greater Houston Retail 243,554,061 19,313,502 7.9% 351,950 0.1% 19,665,452 8.1% 593,490 2,829,420 $14.85
3
4. RESEARCH & FORECAST REPORT | Q4 2010 | HOUSTON RETAIL MARKET
Retail Development Pipeline
HOUSTON RETAIL PROJECTS UNDER CONSTRUCTION
Estimated
Map # Submarket Property Name Address RBA % Leased Developer Delivery
1 Inner Loop 1523 Airline Bldg 1623 Airline Dr 12,000 50 ReMax CityView Jan-11
2 Fairfield The Shops at Cypress Crossing27126 Hwy 290 17,006 100 Texas Land & Lease Jan-11
3-6 Cypress Fairway Point, Bldgs. A-E 15103 Mason Rd 80,000 0 Fairfield Village Community Mar-11
7 Montgomery County Life Check Pharmacy 1490 Researh Forest 10,028 100 AMREIT Apr-11
Total retail under construction 119,034
7
3
5
5 2
6
1
SELECT HOUSTON 2010 RETAIL DELIVERIES
Year
Submarket Property Name Address RBA % Leased Developer Built
Willowbrook Joe V's Smart Shop 12035 Antoine Dr 66,690 82.0% NewQuest (for HEB) May-10
Memorial East CityCentre, Bldg 13 12808 Queensbury Ln 47,584 61.3% Midway Companies Jan-10
Baytown Chase Plaza Center 7599 Garth Rd 30,000 0.0% Ed Rutledge Associates Feb-10
Tomball Ross (Tomball Marketplace) 14223 FM 2920 Rd 27,689 100.0% Weingarten Realty Mar-10
Inner Loop River Oaks West Ave Building C 2800 Kirby Dr 24,130 100.0% Gables Residential May-10
Sugar Land/Fort Bend Mody Plaza 1611 Hwy 6 10,280 54.5% Mihir Mody Sep-10
Washington Boulevard 3939 Washington Retail 3939 Washington Ave 22,800 59.9% Apex Group Mar-10
West Westheimer Lakes Plaza Phase II 26440 FM 1093 22,500 55.6% Parkhill Investments Nov-10
Kingwood Kings Harbor Waterfront Village, Bldgs. 8 & 9 1660 W Lake Houston Pky 22,200 81.7% Midway Companies Mar-10
Hobby Cullen Commons II 12805 Cullen Blvd 20,000 50.0% Cullen Commons Apr-10
Northline Carmel Plaza 6906 Airline Dr 16,000 62.5% Chaleh Corporation Mar-10
4
5. RESEARCH & FORECAST REPORT | Q4 2010 | HOUSTON RETAIL MARKET
480 Offices Worldwide
EUROPE AND
NORTH AMERICA MIDDLE EAST
HAWAII ASIA PACIFIC
AFRICA
SOUTH
AMERICA
AUSTRALIA
61 Countries on 6 Continents
191 AMERICAS
135 USA
39 CANADA
17 LATIN AMERICA
26 ASIA
95 EUROPE/MIDDLE EAST/AFRICA COLLIERS INTERNATIONAL
1300 Post Oak Blvd, 2nd Floor
168 AUSTRALIA/NEW ZEALAND
Houston, Texas 77056
$1.9 BILLION IN GLOBAL REVENUE Main: 713.222.2111
Fax: 713.830.2118
1.4 BILLION SQUARE FEET UNDER www.colliers.com
MANAGEMENT
15,000 PROFESSIONALS
5