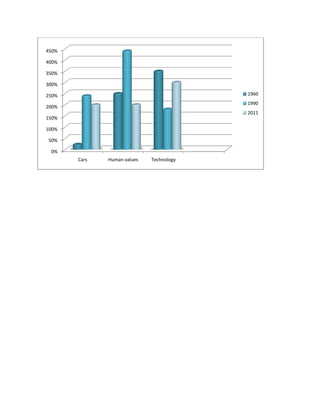
This graph shows the growth rates of cars, human values, and technology from 1960 to 2011, with cars growing at around 400%, human values around 150%, and technology over 350%. Cars had the highest growth rate, followed by technology, while human values grew at a slower rate over the time period shown.