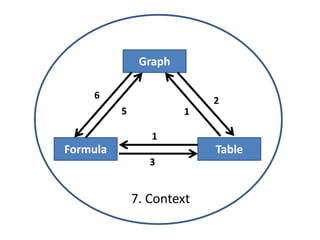
2. 1. Table → Graph
x -3 -1 1 3 4
y -2 2 6 10 12
Activities:
1.Determine the axes
2.Plot the points
3.Choose graph type;
connect when not
discrete
3. 2. Graph → Table
Activities:
1.Read off points
2.Determine dependent
variable
3.Make table
x -3 -1 1 3 4
y -2 2 6 10 12
4. 3. Formula → Table
Activities:
1.Determine ‘in’ and ‘out’
2.Fill in x-values for the
formula to calculate y
3.Make table
x -3 -1 1 3 4
y -2 2 6 10 12
NOTE: this also holds for, for example, solving equations, as
students can numerically ‘solve’ them with tables.
5. 4. Table → Formula
x -3 -1 1 3 4
y -2 2 6 10 12
Activities:
6. 5. Formula → Graph
Activities:
NOTE: Often, students will first go
from a formula to a graph, via a table,
which is OK. In this case, the linearity
(only needing two points) comes into
play as well.
7. 6. Graph → Formula
Activities:
NOTE: This also is applicable
when finding intersections of
two graphs (make equation
and solve). Furthermore,
recognizing the ‘form’ of
functions is handy.
8. What do the numbers denote?
What are the variables?
What units?
Are the results realistic?
Context