
Recommended
More Related Content
Similar to Histogram chart with small dot icons
Similar to Histogram chart with small dot icons (20)
Recently uploaded
Recently uploaded (20)
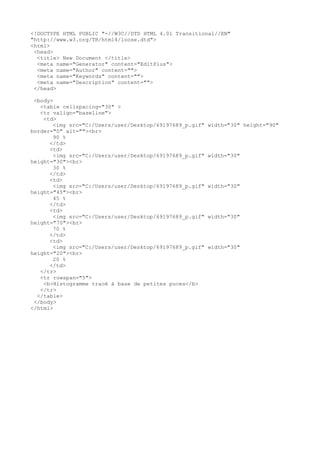
Histogram chart with small dot icons
- 1. <!DOCTYPE HTML PUBLIC "-//W3C//DTD HTML 4.01 Transitional//EN" "http://www.w3.org/TR/html4/loose.dtd"> <html> <head> <title> New Document </title> <meta name="Generator" content="EditPlus"> <meta name="Author" content=""> <meta name="Keywords" content=""> <meta name="Description" content=""> </head> <body> <table cellspacing="30" > <tr valign="baseline"> <td> <img src="C:/Users/user/Desktop/69197689_p.gif" width="30" height="90" border="0" alt=""><br> 90 % </td> <td> <img src="C:/Users/user/Desktop/69197689_p.gif" width="30" height="30"><br> 30 % </td> <td> <img src="C:/Users/user/Desktop/69197689_p.gif" width="30" height="45"><br> 45 % </td> <td> <img src="C:/Users/user/Desktop/69197689_p.gif" width="30" height="70"><br> 70 % </td> <td> <img src="C:/Users/user/Desktop/69197689_p.gif" width="30" height="20"><br> 20 % </td> </tr> <tr rowspan="5"> <b>Histogramme tracé à base de petites puces</b> </tr> </table> </body> </html>