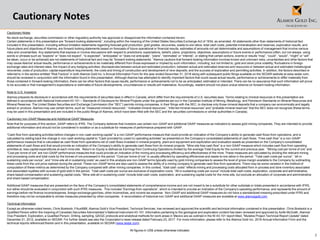
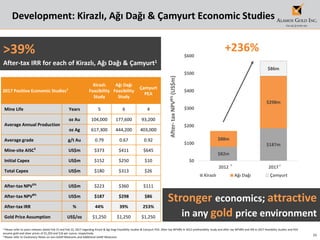
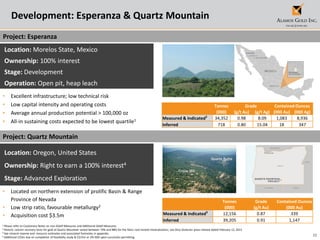
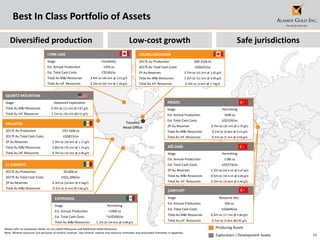
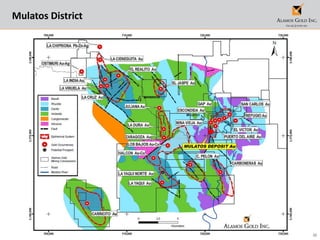
2. 2
Cautionary Notes
No stock exchange, securities commission or other regulatory authority has approved or disapproved the information contained herein.
Certain statements in this presentation are āforward-looking statementsā, including within the meaning of the United States Securities Exchange Act of 1934, as amended. All statements other than statements of historical fact
included in this presentation, including without limitation statements regarding forecast gold production, gold grades, recoveries, waste-to-ore ratios, total cash costs, potential mineralization and reserves, exploration results, and
future plans and objectives of Alamos, are forward-looking statements based on forecasts of future operational or financial results, estimates of amounts not yet determinable and assumptions of management that involve various
risks and uncertainties. Any statements that express or involve discussions with respect to predictions, expectations, beliefs, plans, projections, objectives, assumptions or future events or performance (often, but not always, using
words or phrases such as āexpectsā or ādoes not expectā, āis expectedā, āanticipatesā or ādoes not anticipateā, āplansā, āestimatesā or āintendsā, or stating that certain actions, events or results āmayā, ācouldā, āwouldā, āmightā or āwillā
be taken, occur or be achieved) are not statements of historical fact and may be āforward-looking statements.ā Alamos cautions that forward-looking information involves known and unknown risks, uncertainties and other factors that
may cause Alamos' actual results, performance or achievements to be materially different from those expressed or implied by such information, including, but not limited to, gold and silver price volatility; fluctuations in foreign
exchange rates and interest rates; the impact of any hedging activities; discrepancies between actual and estimated production, between actual and estimated reserves and resources or between actual and estimated metallurgical
recoveries; costs of production; capital expenditure requirements; the costs and timing of construction and development of new deposits; and the success of exploration and permitting activities. In addition, the factors described or
referred to in the section entitled āRisk Factorsā in both Alamos Gold Inc.ās Annual Information Form for the year ended December 31, 2016 along with subsequent public filings available on the SEDAR website at www.sedar.com,
should be reviewed in conjunction with the information found in this presentation. Although Alamos has attempted to identify important factors that could cause actual results, performance or achievements to differ materially from
those contained in forward-looking information, there can be other factors that cause results, performance or achievements not to be as anticipated, estimated or intended. There can be no assurance that such information will prove
to be accurate or that managementās expectations or estimates of future developments, circumstances or results will materialize. Accordingly, readers should not place undue reliance on forward-looking information.
Note to U.S. Investors
Alamos prepares its disclosure in accordance with the requirements of securities laws in effect in Canada, which differ from the requirements of U.S. securities laws. Terms relating to mineral resources in this presentation are
defined in accordance with National Instrument 43-101 ā Standards of Disclosure for Mineral Projects under the guidelines set out in the Canadian Institute of Mining, Metallurgy, and Petroleum Standards on Mineral Resources and
Mineral Reserves. The United States Securities and Exchange Commission (the āSECā) permits mining companies, in their filings with the SEC, to disclose only those mineral deposits that a company can economically and legally
extract or produce. Alamos may use certain terms, such as āmeasured mineral resourcesā, āindicated mineral resourcesā, āinferred mineral resourcesā and āprobable mineral reservesā that the SEC does not recognize (these terms
may be used in this presentation and are included in the public filings of Alamos, which have been filed with the SEC and the securities commissions or similar authorities in Canada).
Cautionary non-GAAP Measures and Additional GAAP Measures
Note that for purposes of this section, GAAP refers to IFRS. The Company believes that investors use certain non-GAAP and additional GAAP measures as indicators to assess gold mining companies. They are intended to provide
additional information and should not be considered in isolation or as a substitute for measures of performance prepared with GAAP.
āCash flow from operating activities before changes in non-cash working capitalā is a non-GAAP performance measure that could provide an indication of the Companyās ability to generate cash flows from operations, and is
calculated by adding back the change in non-cash working capital to āCash provided by (used in) operating activitiesā as presented on the Companyās consolidated statements of cash flows. āFree cash flowā is a non-GAAP
performance measure that is calculated as cash flows from operations net of cash flows invested in mineral property, plant and equipment and exploration and evaluation assets as presented on the Companyās consolidated
statements of cash flows and that would provide an indication of the Companyās ability to generate cash flows from its mineral projects. āMine site free cash flowā is a non-GAAP measure which includes cash flow from operating
activities at, less capital expenditures at each mine site. Return on Equity is defined as Earnings from Continuing Operations divided by the average Total Equity for the current and previous year. āMining cost per tonne of oreā and
āCost per tonne of oreā are non-GAAP performance measures that could provide an indication of the mining and processing efficiency and effectiveness of the mine. These measures are calculated by dividing the relevant mining
and processing costs and total costs by the tonnes of ore processed in the period. āCost per tonne of oreā is usually affected by operating efficiencies and waste-to-ore ratios in the period. āTotal cash costs per ounceā, āall-in
sustaining costs per ounceā, and āmine-site all-in sustaining costsā as used in this analysis are non-GAAP terms typically used by gold mining companies to assess the level of gross margin available to the Company by subtracting
these costs from the unit price realized during the period. These non-GAAP terms are also used to assess the ability of a mining company to generate cash flow from operations. There may be some variation in the method of
computation of these metrics as determined by the Company compared with other mining companies. In this context, ātotal cash costsā reflects mining and processing costs allocated from in-process and dore inventory associated
and associated royalties with ounces of gold sold in the period. Total cash costs per ounce are exclusive of exploration costs. āAll-in sustaining costs per ounceā include total cash costs, exploration, corporate and administrative,
share based compensation and sustaining capital costs. āMine-site all-in sustaining costsā include total cash costs, exploration, and sustaining capital costs for the mine-site, but exclude an allocation of corporate and administrative
and share based compensation.
Additional GAAP measures that are presented on the face of the Companyās consolidated statements of comprehensive income and are not meant to be a substitute for other subtotals or totals presented in accordance with IFRS,
but rather should be evaluated in conjunction with such IFRS measures. This includes āEarnings from operationsā, which is intended to provide an indication of the Companyās operating performance, and represents the amount of
earnings before net finance income/expense, foreign exchange gain/loss, other income/loss, and income tax expense. Non-GAAP and additional GAAP measures do not have a standardized meaning prescribed under IFRS and
therefore may not be comparable to similar measures presented by other companies. A reconciliation of historical non-GAAP and additional GAAP measures are available at www.alamosgold.com.
Technical Information
Except as otherwise noted herein, Chris Bostwick, FAusIMM, Alamos Goldās Vice President, Technical Services, has reviewed and approved the scientific and technical information contained in this presentation. Chris Bostwick is a
Qualified Person within the meaning of Canadian Securities Administratorās National Instrument 43-101. Information pertaining to the geological and exploration content has been reviewed and approved by Aoife McGrath, Alamos'
Vice President, Exploration, a Qualified Person. Drilling, sampling, QA/QC protocols and analytical methods for work areas in Mexico are as outlined in the NI 43-101 report titled, "Mulatos Project Technical Report Update" dated
December 21, 2012, available on SEDAR. For further details see also the Corporationās news release dated February 23, 2017. For more information, please refer to the Alamos Gold Inc. 2016 Annual Information Form and the
technical reports referenced therein and in this presentation, available on SEDAR (www.sedar.com).
All figures in US$ unless otherwise indicated.
Cautionary Notes
3. 3
1 Based on 2017 Guidance
2 Please refer to Cautionary Notes on non-GAAP Measures and Additional GAAP Measures.
3 Includes cash, cash equivalents and equity securities as of June 30, 2017. Total liquidity also includes undrawn $150m credit facility.
Strong Platform for Delivering Long Term Value
Diversified gold production
400,000 ā 430,000 oz from
three North American mines1
Expanding margins
$940/oz AISC,
7% improvement from 20161,2
Peer leading growth
Portfolio of 6 low-cost
development projects
Strong balance sheet
Debt free, $150m3 cash & $300m
total liquidity to support growth
Track record of
delivering
shareholder value
4. 42015A 2016A 2017E
$1,091
$1,010
$940
2015A 2016A 2017E
2015A 2016A 2017E
$1,241
$1,103
$1,065
2015A 2016A 2017E
Growing Production, Declining Costs, Expanding Margins
Gold Production (000 oz) AISC1,2 (US$/oz)
-14%
Total Capital ā Operating Mines (US$m)
$128m $105-122m
Cost of Sales3 (US$/oz)
1 Please refer to Cautionary Notes on non-GAAP Measures and Additional GAAP Measures.
2 Total consolidated all-in sustaining costs include corporate and administrative and share based compensation expenses.
3 Cost of sales includes mining and processing costs, royalties and amortization.
4 AISC Margin calculated as realized gold price less AISC. For 2017E this assumes a $1,250/oz gold price
5 Total capital spending for Alamos has been included for the periods prior to July 2, 2015 for comparative purposes only.
392
400 ā 430
+6%
380
$167m5
$57
$229
$310
2015A 2016A 2017E
+35%
AISC Margin2,4 (US$/oz)
-14%
-32%
5. 5
Esperanza
Quartz Mountain
Mulatos District
AÄi DaÄi2 Production: 178K oz
Mine-site AISC1: $411/oz >400k oz
Combined annual production
growth potential
Peer Leading Low-Cost Growth Profile
Producing Assets
Development/Exploration Assets
Young-Davidson
Production: 200-210K oz
Mine-site AISC1: $775/oz
Controlled, disciplined, multi-stage growth
400-430k oz
2017 production guidance
Production Permitting/Development Advanced Exploration
Mulatos
Production: 150-160K oz
Mine-site AISC1: $890/oz
El Chanate
Production: 50-60K oz
Mine-site AISC1: $1,200/oz
Kirazlı2 Production: 104K oz
Mine-site AISC1: $373/oz
Ćamyurt2 Production: 93K oz
Mine-site AISC1: $645/oz
Lynn Lake
Feasibility Study
Q3 2017
1 Please refer to Cautionary Notes on non-GAAP Measures and Additional GAAP Measures.
2 Average annual production and mine-site AISC as detailed in the 2017 Kirazlı & AÄi DaÄi feasibility studies & Ćamyurt preliminary economic assessment. Please refer to press releases dated February 15 and 22, 2017 for more detail.
6. 6
$315m
High yield notes retired in April 2017
Strong Balance Sheet ā Debt Free
1 Unaudited management estimate as of June 30, 2017.
2 Cash, cash equivalents & equity securities.
3 Total liquidity includes cash, cash equivalents, equity securities and undrawn $150m credit facility
4As of August 3, 2017
Balance Sheet
Cash & Cash Eq.1,2 US$150 million
Total Liquidity3 US$300 million
Total Debt US$0
Capital Structure
Shares Outstanding 300.6 million
Warrants 12.1 million
Employee Options 8.3 million
Fully Diluted 324.0 million
Recent Share Price (TSX)4 C$9.66
Market Capitalization ~C$2.9 billion
$24m
Annual interest savings; $72m over remaining
term
$150m$150m
$300m
As of June 30, 2017
Cash & Total Liquidity
Cash, cash equivalents & equity securitiesUndrawn Credit Facility
3
7. 7
838%
8%
263%
-50%
450%
950%
1450%
1950%
2003 2004 2005 2006 2007 2008 2009 2010 2011 2012 2013 2014 2015 2016 2017
Alamos Gold Share Price (TSX)
S&P/TSX Global Gold Index
Gold (US$/oz)
Track Record of Delivering Shareholder Value
17%
Annualized return
since 2003
MULATOS: BLUEPRINT FOR SUCCESS
LEADING GROWTH PROFILE WITH
DISCIPLINED M&A STRATEGY
ROE AMONG BEST IN INDUSTRY 11% Alamos five year average ROE prior to merger4
$10m
cost to acquire
Mulatos in 2003
$375m
free cash flow1
generated to date
$70m
initial capital raised
to build Mulatos
6
development
projects
$170m
total combined
acquisition cost
10.7m
combined M&I and
Inferred resources2,3
1 Please refer to Cautionary Notes on non-GAAP Measures and Additional GAAP Measures.
2 Includes Measured and Indicated resources of 7.0m oz Au (227 mt at 0.96 g/t Au) and Inferred resources of 3.7m oz Au (116 mt at 0.99 g/t Au) as of December 31, 2015.
3 See mineral reserve and resource estimates and associated footnotes in appendix.
4 Alamos adopted AuRico Goldās financials with the completion of the merger of the two companies in July 2015. Prior to the merger, Alamosā five year average return on equity ending 2014 was 10.7%.
8. 8
Operations ā Diversified North American Production
Long life reserve base
Declining costs & capital
Growing free cash flow
Growing production
9. 9
Q2 2017 Results ā On Track to Achieve Full Year Guidance
1 Cost of sales includes mining and processing costs, royalties and amortization.
2 Total consolidated all-in sustaining costs include corporate and administrative and share based compensation expenses. For the purposes of calculating all-in sustaining costs at individual mine sites, the Company does not include corporate and
administrative and share based compensation expenses.
3 Please refer to Cautionary Notes on non-GAAP Measures and Additional GAAP Measures.
4 Includes capitalized exploration
5 Includes a one-time after-tax charge of $21.8 million ($0.07/sh) incurred on the retirement of the high yield notes and $10.9 million ($0.04/sh) of unrealized foreign exchange gains.
10%
Production growth
from Q1 2017;
record quarter
-7%
Decrease in all-in
sustaining costs
32%
Increase in operating
cash flow before changes
in working capital
$18m
mine-site free cash
flow3
Higherproduction & lower costs expected
to drive strong mine-site free cash flow
growth in H2 2017
Q2 2016 Q1 2017 Q2 2017
Gold production (ounces) 92,464 96,200 105,900
Gold sales (ounces) 95,866 98,755 104,023
Average realized gold price (US$/oz) $1,253 $1,225 $1,262
Cost of sales (US$/oz, includes amortization)1 $1,106 $1,115 $1,053
All-in sustaining costs (US$/oz)2,3 $1,037 $1,014 $942
Capital Expenditures (US$M)
Sustaining3 $13.9 $9.3 $11.1
Growth3,4 $24.6 $24.3 $40.4
Operating revenues (US$M) $120.1 $121.0 $131.3
Cash provided by operations
before changes in working capital (US$M)3
$40.3 $34.2 $45.1
Net earnings (US$M) ($11.8) $0.1 $2.4
Earnings per share ($0.04) $0.00 $0.015
Cash, cash equivalents & equity
securities (US$M)
$285 $495 $150
Total debt (US$/M) $317 $315 $0
10. 10
Young-Davidson ā Flagship, Long-Life Production
Location: Ontario, Canada
Ownership: 100% interest
Stage: Producing
Operation: Underground
ā¢ One of Canadaās largest underground gold mines
ā¢ Highly mechanized, highly productive bulk
underground mining
ā¢ Significant Canadian dollar exposure; ~95% of costs
Gold Reserves & Resources4 Tonnes
(000)
Grade
(g/t Au)
oz Au
(000)
P&P Underground Reserves 42,054 2.70 3,653
M&I Underground Resources 10,792 3.39 1,177
Inferred Underground Resources 3,524 2.76 313
Largeresource base &
exploration potential to support
mine life extension
15 year
mine life based on year end 2016
mineral reserves
1 Cost of sales includes mining and processing costs, royalties and amortization.
2 Please refer to Cautionary Notes on non-GAAP Measures and Additional GAAP Measures.
3 Excludes Net Realizable Value (āNRVā) inventory adjustments. See associated MD&A for a full reconciliation.
4 See mineral reserve and resource estimates and associated footnotes in appendix.
2015A 2016A 2017E Q1/17A Q2/17A
Gold Production (k oz) 160.4 170.0 200-210 40.4 47.3
Cost of Sales1 (US$/oz) $1,162 $1,087 $1,050 $1,148 $1,113
Total Cash Costs2,3 (US$/oz) $683 $657 $625 $710 $677
Mine-site AISC2,3 (US$/oz) $986 $897 $775 $851 $895
Total Capital (US$m) $108 $95 $70-80 $18.6 $22.7
Mine-site FCF2 (US$m) ($23) $4 - $0 $5
11. 11
160
170
200-210
2015A 2016A 2017E
Gold Production (000 oz)
$1,162
$1,087
$1,050
2015A 2016A 2017E
Cost of Sales2 (US$/oz)
$986
$897
$775
2015A 2016A 2017E
Mine-site AISC1 (US$/oz)
$108
$95
$70-80
2015A 2016A 2017E
-31%
Growing production; declining
costs; declining capital intensity
Young-Davidson ā Ramp up of Underground Mining
0
1,000
2,000
3,000
4,000
5,000
6,000
7,000
8,000
Q1/13
Q2/13
Q3/13
Q4/13
Q1/14
Q2/14
Q3/14
Q4/14
Q1/15
Q2/15
Q3/15
Q4/15
Q1/16
Q2/16
Q3/16
Q4/16
Q1/17
Q2/17
Underground TPD Mill TPD
-21%+28%
6,500 - 7,500 tpd
underground mining rate expected in 2017
-10%
6,000 tpd
average underground mining rate in 2016
1 Please refer to Cautionary Notes on non-GAAP Measures and Additional GAAP Measures.
2 Cost of sales includes mining and processing costs, royalties and amortization
Total Capital Spending (US$m)
12. 12
Mulatos ā Our Founding Operation
Location: Sonora State, Mexico
Ownership: 100% interest
Stage: Producing
Operation: Open pit, heap leach & high grade mill
ā¢ Initial production 2005
ā¢ 1.7m oz produced to date; 5% NSR capped at 2m oz
ā¢ Mine life of 5 years based on YE 2016 reserves
ā¢ Large exploration package (28,773 ha)
Gold Reserves & Resources5 Tonnes
(000)
Grade
(g/t Au)
oz Au
(000)
P&P Reserves 49,995 1.17 1,885
M&I Resources 76,084 1.14 2,798
Inferred Resources 10,280 0.98 325
$17m
Budgeted for exploration at Mulatos in
2017 across several targets
~$375m
Free cash flow2 generated to date
1 Cost of sales includes mining and processing costs, royalties and amortization.
2 Please refer to Cautionary Notes on non-GAAP Measures and Additional GAAP Measures.
3 Capital spending guidance for 2016 and 2017 excludes capitalized exploration. 2017 guidance includes La Yaqui Phase I development capital
4 Excluding LY Phase I capital expenditures.
5 See mineral reserve and resource estimates and associated footnotes in appendix.
2015A 2016A 2017E Q1/17A Q2/17A
Gold Production (k oz) 140.3 154.0 150-160 40.0 41.0
Cost of Sales1 (US$/oz) $1,128 $1,088 $1,015 $1,034 $902
Total Cash Costs2 (US$/oz) $869 $838 $815 $827 $735
Mine-site AISC2 (US$/oz) $1,047 $916 $890 $920 $777
Total Capital3 (US$m) $45 $33 $33-40 $11.4 $14.6
Mine-site FCF2,4 (US$m) ($19) $27 - $3 $11
13. 13
$1,047
$916
$890
2015A 2016A 2017E
Focused cost reductions
2017 AISC expected to decrease ~$160/oz
from 2015
Higher mill production
Transition to concentrate production
generating higher recoveries & cash flow
Declining cost profile
Low cost production from La Yaqui & Cerro
Pelon; 5% royalty nearing completion
1 Please refer to Cautionary Notes on non-GAAP Measures and Additional GAAP Measures.
2 For the purposes of calculating mine-site all-in sustaining costs, the Company does not include an allocation of corporate and administrative and share based compensation expenses.
3 Cost of sales includes mining and processing costs, royalties and amortization.
Mine-site AISC1,2 (US$/oz)
Cost of Sales3 (US$/oz)
-15%
$1,128
$1,088
$1,015
2015A 2016A 2017E
Mulatos ā Declining Cost Profile
14. 14
La Yaqui I Pit
Leach Pad Cell 3Leach Pad Cell 2
Overliner Cell 2
First Lift, Cell 1
ROM Ore Stockpile
Crusher Area
Event Pond
Pregnant PondPower Plant
Process Plant
Barren Pond
Pit to Crusher Haulage Road
July 23 2017
Mulatos ā La Yaqui Phase I Development on Track
1.4 g/t Au
Reserve grade1 68% above
Mulatos 2017 budget
H2-2017
Initial production - Phase I
development on track
~$400/oz
2017 total cash costs1, 50% below
Mulatos budget
1 See mineral reserve and resource estimates and associated footnotes in appendix.
2 Please refer to Cautionary Notes on non-GAAP Measures and Additional GAAP Measures.
15. 15
La Yaqui & Cerro Pelon
Mulatos ā District Exploration Potential
1 See mineral reserve and resource estimates and associated footnotes in appendix.
2 Includes Proven & Probable reserves of 608,000 oz (13.5 mt at 1.40 g/t Au), Measured & Indicated resources of 68,000 oz (1.1 mt at 1.91 g/t Au) & Inferred resources of 8,000 oz (0.2 mt at 1.39 g/t Au) for La Yaqui and Proven & Probable
reserves of 170,000 oz (3.3 mt at 1.63 g/t Au), Measured & Indicated resources of 47,000 oz (0.6 mt at 2.56 g/t Au) & Inferred resources of 4,000 oz (0.1 mt at 1.23 g/t Au) for Cerro Pelon.
778k oz
Combined mineral reserves1,2 at La Yaqui &
Cerro Pelon, a 254% increase since 2014
District potential
Large underexplored land package; >70% of past
drilling focused near Mulatos mine
Mulatos District
Mulatos mine
220 259
778
47
115
236
0
100
200
300
400
500
600
700
800
900
1000
2014 2015 2016
Ounces(000Au)
Proven & Probable Mineral Reserves
Inferred Mineral Resources
Measured & Indicated Mineral Resources
1,2
Ongoing exploration success
Improved land access & renewed focus ā 2017
Mulatos exploration budget of $17m
16. 16
El Chanate ā Consistent Gold Producer
Location: Sonora State, Mexico
Ownership: 100% interest
Stage: Producing
Operation: Open pit, heap leach
ā¢ Positive free cash flow generation in 2016
ā¢ Significant free cash flow at end of mine life ā low
cost production through residual leaching
1 Cost of sales includes mining and processing costs, royalties and amortization.
2 Please refer to Cautionary Notes on non-GAAP Measures and Additional GAAP Measures.
3 Excludes Net Realizable Value (āNRVā) inventory adjustments. See associated MD&A for a full reconciliation.
4 See mineral reserve and resource estimates and associated footnotes in appendix.
5 El Chanateās H2 2017 expected production has been hedged through gold collars ensuring minimum gold price of $1,242/oz and participation up to $1,409/oz
Gold Reserves & Resources4 Tonnes
(000)
Grade
(g/t Au)
oz Au
(000)
P&P Reserves ā Open Pit 10,812 0.56 193
P&P Reserves ā Leach Pad Inventory - - 100
M&I Resources 4,415 0.66 93
$1,242/oz
Minimum realized gold price with
H2 2017 production hedged5
$5m
Site free cash flow2 generated in 2016
2015A 2016A 2017E Q1/17A Q2/17A
Gold Production (k oz) 79.3 68.0 50-60 15.8 17.6
Cost of Sales1 (US$/oz) $1,504 $1,177 $1,265 $1,218 $1,242
Total Cash Costs2,3 (US$/oz) $808 $1,052 $1,200 $1,144 $1,185
Mine-site AISC2,3 (US$/oz) $978 $1,069 $1,200 $1,187 $1,208
Total Capital (US$m) $14 $1 $2 $1 $0.3
Mine-site FCF2 (US$m) $3 $5 - ($2) $3
17. 17
Proven & Probable Mineral Reserves
Long Life Mineral Reserve Base
Operating Reserve Life Index (years)3
1 For more information, see press release dated February 23, 2017 āAlamos Reports Mineral Reserves and Resources for the Year-Ended 2016ā and mineral reserve and resource estimates and associated footnotes in appendix.
2 Year end 2016 Proven & Probable mineral reserves total 7.7 million ounces of gold (184.5 mt at 1.30 g/t Au).
3 Source: TD Securities. 2016 Y/E operating gold reserves/2018E gold production.
5.9
7.7
0
2
4
6
8
10
2015 2016
+31%
OuncesAu(Millions)
1,2
+31%
Increase in Proven & Probable mineral reserves1
2.4m oz
Mineral reserves added at La Yaqui Grande,
Kirazlı & AÄı DaÄı1
26.2
14.7
13.5 13.5 13.5
11.3 11.2 10.2 9.8 9.8 9.2 8.5
6.4
3.4
0
5
10
15
20
25
DGC GUY ELD NEM AGI ABX AUY NGD AEM KGC IMG SMF RIC P
Reservelifeindex(years)
18. 18
Development ā Peer Leading Growth Profile
Low cost, low capital
intensity growth
Capacity to double
current rate of production
6 development projects
19. 19
Development: Kirazlı, AÄı DaÄı & Ćamyurt
1 Please refer to press releases dated Feb 15 and Feb 22, 2017 regarding Kirazli & Agi Dagi feasibility studies & Camyurt preliminary economic assessment
2 See mineral reserve and resource estimates and associated footnotes in appendix
Location: Turkey
Ownership: 100% interest
Stage: Development
Operation: Open pit, heap leach
Low cost, high return growth
Kirazlı2
Tonnes Grade Contained Ounces
(000) (g/t Au) (g/t Ag) (000 Au) (000 Ag)
Proven & Probable 26,104 0.79 12.01 665 10,078
Measured & Indicated 5,966 0.43 2.18 82 418
Inferred 5,689 0.59 8.96 108 1,638
AÄı DaÄı2
Proven & Probable 54,361 0.67 5.41 1,166 9,459
Measured & Indicated 34,887 0.46 2.18 518 2,445
Inferred 16,760 0.46 2.85 245 1,534
Ćamyurt2
Measured & Indicated 17,721 0.89 6.14 508 3,497
Inferred 2,791 0.95 5.77 85 518
ā¢ Kirazlı & AÄı DaÄı EIAās approved
ā¢ Kirazlı Forestry Permits granted January 2017
ā¢ Kirazlı & AÄı DaÄı feasibility studies & Ćamyurt PEA
completed February 2017
ā¢ Tax incentives & mining law supportive of industry
185%
Increase in combined after-tax NPV8% of Kirazlı &
AÄı DaÄı1 from 2012 prefeasibility study
20. 20
Development: Kirazlı, AÄı DaÄı & Ćamyurt Economic Studies
After-taxNPV8%(US$m)
$82m
$187m
$88m
$298m
$86m
$0
$100
$200
$300
$400
$500
$600
2012 2017
Kirazlı AÄı DaÄı Ćamyurt
+236%
Stronger economics; attractive
in any gold price environment
1 Please refer to press releases dated Feb 15 and Feb 22, 2017 regarding Kirazli & Agi Dagi Feasibility studies & Camyurt PEA. After-tax NPV8% in 2012 prefeasibility study and after-tax NPV8% and IRR in 2017 feasibility studies and PEA
assume gold and silver prices of $1,250 and $16 per ounce, respectively
2 Please refer to Cautionary Notes on non-GAAP Measures and Additional GAAP Measures
11
2017 Positive Economic Studies1
Kirazlı
Feasibility
Study
AÄı DaÄı
Feasibility
Study
Ćamyurt
PEA
Mine Life Years 5 6 4
Average Annual Production
oz Au 104,000 177,600 93,200
oz Ag 617,300 444,200 403,000
Average grade g/t Au 0.79 0.67 0.92
Mine-site AISC2
US$m $373 $411 $645
Initial Capex US$m $152 $250 $10
Total Capex US$m $180 $313 $26
After-tax NPV5%
US$m $223 $360 $111
After-tax NPV8%
US$m $187 $298 $86
After-tax IRR % 44% 39% 253%
Gold Price Assumption US$/oz $1,250 $1,250 $1,250
>39%
After-tax IRR for each of Kirazlı, AÄı DaÄı & Ćamyurt1
21. 21
Development: Lynn Lake Project ā High Grade, Open Pit
1 For more information regarding the Lynn Lake District, please refer to the press release issued by Carlisle Goldfields dated February 27, 2014 titled Carlisle
Announces Optimized PEA of the Farley and MacLellan deposits at Lynn Lake returns Post-Tax IRR of 26.3% at US$1,100 gold price available on SEDAR.
2 See mineral reserve and resource estimates and associated footnotes in appendix.
3 Please refer to Cautionary Notes on non-GAAP Measures and Additional GAAP Measures.
Location: Manitoba, Canada
Ownership: 100% interest
Stage: Feasibility
Operation: Open pit
ā¢ Located in the highly-prospective Lynn Lake
Mining District
ā¢ High grade, open pit
ā¢ Significant exploration potential
ā¢ Existing infrastructure in place
ā¢ Low cost hydroelectric power
ā¢ Feasibility study expected in late Q3 2017
Life of Mine Production Profile1
0
50
100
150
200
250
1 2 3 4 5 6 7 8 9 10 11 12
Gold(kozperyear)
Life of Mine (years)
Gold Reserves & Resources2 Tonnes
(000)
Grade
(g/t Au)
oz Au
(000)
M&I Resources 40,303 2.03 2,629
Inferred Resources 50,704 1.28 2,089
22. 22
Development: Esperanza & Quartz Mountain
1 Please refer to Cautionary Notes on non-GAAP Measures and Additional GAAP Measures
2 Historic column recovery tests for gold at Quartz Mountain varied between 74% and 88% for the felsic rock hosted mineralization; see Orsa Ventures press release dated February 12, 2013
3 See mineral reserve and resource estimates and associated footnotes in appendix.
4 Additional C$3m due on completion of feasibility study & C$15m or 2% NSR upon successful permitting
Location: Morelos State, Mexico
Ownership: 100% interest
Stage: Development
Operation: Open pit, heap leach
ā¢ Excellent infrastructure; low technical risk
ā¢ Low capital intensity and operating costs
ā¢ Average annual production potential > 100,000 oz
ā¢ All-in sustaining costs expected to be lowest quartile1
Location: Oregon, United States
Ownership: Right to earn a 100% interest4
Stage: Advanced Exploration
ā¢ Located on northern extension of prolific Basin & Range
Province of Nevada
ā¢ Low strip ratio, favourable metallurgy2
ā¢ Acquisition cost $3.5m
Tonnes Grade Contained Ounces
(000) (g/t Au) (g/t Ag) (000 Au) (000 Ag)
Measured & Indicated3
34,352 0.98 8.09 1,083 8,936
Inferred 718 0.80 15.04 18 347
Quartz Butte
Crone Hill
Tonnes Grade Contained Ounces
(000) (g/t Au) (000 Au)
Measured & Indicated3
12,156 0.87 339
Inferred 39,205 0.91 1,147
Project: Esperanza
Project: Quartz Mountain
23. 23
ļ¼ Q4 2016: Met consolidated 2016 production guidance
ļ¼ Q1 2017: Received Forestry Permits for Kirazlı project
ļ¼ Q1 2017: Positive Kirazlı & AÄı DaÄı feasibility studies & Ćamyurt PEA
ļ¼ Q1 2017: 31% increase in combined mineral reserves
Q3 2017: Lynn Lake feasibility study
H2 2017: Initial production at La Yaqui
2017: Ongoing exploration at Mulatos
2017: Receipt of GSM permit for Kirazlı
Alamos ā Investment Case
Catalysts
Diversified intermediate gold producer Low-cost growth profile
Strong balance sheet to support
growth
Long term track record of delivering
shareholder value
25. 25
Board of Directors and Executive and Management Team
Board of Directors
Executive and Management Team
Paul J. Murphy
John A.
McCluskey
Mark J. Daniel
Patrick D.
Downey
David Fleck David Gower
Claire M. C.
Kennedy
Ronald E. Smith Kenneth Stowe
Chairman Director Director Director Director Director Director Director Director
John A. McCluskey Jamie Porter Peter MacPhail Christine Barwell Chris Bostwick Luis Chavez
President and CEO Chief Financial Officer Chief Operating Officer VP, Human Resources VP, Technical Services Senior VP, Mexico
Andrew Cormier Nils Engelstad Greg Fisher Aoife McGrath Scott Parsons Colin Webster
VP, Development & Construction VP, General Counsel VP, Finance VP, Exploration VP, Investor Relations VP Sustainability & External Affairs
26. 26
Sustainability
ā¢ Our Objectives
ā¢ As we pursue further growth, we will continue to measure our success as an
organization by our performance in achievement of our sustainability objectives:
ā¢ Protecting the health and well-being of our employees
ā¢ Creating shared value with our host communities and countries
ā¢ Ensuring that our operations are net-positive for the environment
ā¢ Over the years, Alamos has been recognized for its achievements in these areas:
Clean Industry Certification from PROFEPA
ā¢ Alamos was certified as an Industria Limpia (clean industry)
in recognition of the excellence of environmental management
at Mulatos
CSR Award from Mexican Center for Philanthropy (CEMEFI)
ā¢ Signifies exceptional record of CSR performance;
ā¢ 2016 marked the 8th consecutive year for Alamos
27. 27
1 Please refer to Cautionary Notes on non-GAAP Measures and Additional GAAP Measures.
2 Excludes capitalized exploration.
3 For the purposes of calculating mine-site all-in sustaining costs at individual mine sites, the Company does not include an allocation of corporate and administrative and share based compensation expenses to the mine sites.
4 Cost of sales includes mining and processing costs, royalties, and amortization expense
2017 Guidance
2017 Guidance 2016 Actuals
Young-Davidson Mulatos El Chanate Total Total
Gold production (000ās ounces) 200-210 150-160 50-60 400-430 392
Cost of Sales (in millions) (4) $215 $157 $70 $442 $429
Cost of Sales ($/oz)(4) $1,050 $1,015 $1,265 $1,065 $1,103
Total cash costs ($/oz)(1) $625 $815 $1,200 $765 $797
All-in sustaining costs ($/oz)(1) $940 $1,010
Mine-site all-in sustaining costs ($/oz) (1),(3) $775 $890 $1,200 -
Capital expenditures (in millions)
Sustaining capital(1) $30-35 $8-10 $2 $40-47 $49
Growth capital(1) $40-45 $25-30 (2) - $65-75 $97
Total ā Operating Mines(1) $70-80 $33-40 $2 $105-122 $128
Total ā Development Projects $35-61 $18
Total Consolidated Budget $140-183 $147
Corporate & Administrative (in millions) $16 $16
28. 28
Best In Class Portfolio of Assets
MULATOS
2017E Au Production 150-160k oz
2017E Au Total Cash Costs US$815/oz
2P Au Reserves 1.9m oz (50.0mt @ 1.17 g/t)
Total Au M&I Resources 2.8m oz (76.1mt @ 1.14 g/t)
Total Au Inf. Resources 0.3m oz (10.3mt @ 0.98 g/t)
EL CHANATE
2017E Au Production 50-60k oz
2017E Au Total Cash Costs US$1,200/oz
2P Au Reserves 0.3m oz (10.8mt @ 0.56g/t)
Total Au M&I Resources 0.1m oz (4.4mt @ 0.66 g/t)
QUARTZ MOUNTAIN
Stage Advanced Exploration
Total Au M&I Resources 0.3m oz (12.2mt @ 0.87 g/t)
Total Au Inf. Resources 1.1m oz (39.2mt @0.91 g/t)
YOUNG-DAVIDSON
2017E Au Production 200-210k oz
2017E Au Total Cash Costs US$625/oz
2P Au Reserves 3.7m oz (43.2mt @ 2.65 g/t)
Total Au M&I Resources 1.2m oz (12.5mt @ 3.09 g/t)
Total Au Inf. Resources 0.3m oz (3.6mt @ 2.75g/t)
AÄI DAÄI
Stage Permitting
Est. Annual Production 178k oz
Est. Total Cash Costs US$374/oz
2P Au Reserves 1.2m oz (54.4 mt @ 0.67 g/t)
Total Au M&I Resources 0.5m oz (34.9 mt @ 0.46 g/t)
Total Au Inf. Resources 0.2m oz (16.8mt @ 0.46 g/t)
Producing Assets
Exploration / Development Assets
Toronto
Head Office
ESPERANZA
Stage Permitting
Est. Annual Production +100k oz
Est. Total Cash Costs ~US$500/oz
Total Au M&I Resources 1.1m oz (34.4mt @ 0.98 g/t)
KIRAZLI
Stage Permitting
Est. Annual Production 104k oz
Est. Total Cash Costs US$339/oz
2P Au Reserves 0.7m oz (26.1mt @ 0.79 g/t)
Total Au M&I Resources 0.1m oz (6.0mt @ 0.43 g/t)
Total Au Inf. Resources 0.1m oz (5.7mt @ 0.59 g/t)
ĆAMYURT
Stage Resource Dev.
Est. Annual Production 93k oz
Est. Total Cash Costs US$604/oz
Total Au M&I Resources 0.5m oz (17.7mt @ 0.89 g/t)
Total Au Inf. Resources 0.1m oz (2.8mt @0.95 g/t)
LYNN LAKE
Stage Feasibility
Est. Annual Production 145k oz
Est. Total Cash Costs C$530/oz
Total Au M&I Resources 2.6m oz (40.3mt @ 2.03 g/t)
Total Au Inf. Resources 2.1m oz (50.7mt @ 1.28 g/t)
Diversified production Low-cost growth Safe jurisdictions
Please refer to Cautionary Notes on non-GAAP Measures and Additional GAAP Measures.
Note: Mineral resources are exclusive of mineral reserves. See mineral reserve and resource estimates and associated footnotes in appendix.
29. 29
Young-Davidson ā Increasing Grade & Productivity
1 Cost of sales includes mining and processing costs, royalties and amortization.
2 Please refer to Cautionary Notes on non-GAAP Measures and Additional GAAP Measures.
3 Excludes Net Realizable Value (āNRVā) inventory adjustments. See associated MD&A for a full reconciliation.
4 Excludes hydro rebate not attributable to Q4/15
Underground ramp up driving production higher and unit costs lower
Q1/13 Q2/13 Q3/13 Q4/13 Q1/14 Q2/14 Q3/14 Q4/14 Q1/15 Q2/15 Q3/15 Q4/15 Q1/16 Q2/16 Q3/16 Q4/16 Q1/17 Q2/17
Gold ounces produced 28,281 29,252 30,099 33,106 35,104 40,166 40,538 40,945 38,098 39,365 38,201 44,694 39,065 42,644 43,629 44,662 40,400 47,300
Cost of sales1 (US$/oz) Pre-commercial production $1,677 $1,625 $1,370 $1,211 $1,216 $1,298 $1,165 $986 $1,058 $1,182 $1,032 $1,077 $1,148 $1,113
Total cash costs per oz.(2,3)
$694 $716 $666 $850 $1,009 $871 $723 $719 $745 $697 $681 $617 $616 $738 $607 $667 $710 $677
Mine-site AISC per oz.(2,3)
$1,059 $1,254 $1,357 $1,270 $1,315 $1,144 $959 $912 $987 $1,008 $979 $980 $846 $965 $849 $926 $851 $895
Underground mine
Tonnes mined per day 1,130 1,611 1,417 2,590 2,611 3,595 3,753 4,140 4,130 5,149 5,081 5,911 5,776 6,123 5,467 6,675 6,400 6,377
Grades (g/t) 2.7 2.5 2.8 3.1 2.8 3.3 3.1 3.0 3.0 2.6 2.6 2.6 2.6 2.4 2.8 2.4 2.6 2.6
Development metres 1,941 2,445 2,620 2,986 3,772 3,545 3,269 3,438 3,409 3,789 3,619 3,769 3,490 3,168 2,677 3,044 3,242 3,425
Unit UG mining costs (US$)
Pre-commercial production
$46 $45 $41 $39 $39 $33 $32 $294 $31 $34 $34 $32 $36 $33
Unit UG mining costs (CAD$) $51 $49 $45 $44 $48 $41 $41 $384 $42 $44 $45 $42 $47 $44
Mill processing facility
Tonnes processed per day 6,466 7,017 6,747 6,969 7,163 8,230 7,670 7,757 7,186 7,677 7,680 7,630 7,342 7,006 6,833 7,552 7,718 6,917
Grades (inc. OP stockpile) 1.8 1.7 1.7 2.0 1.8 2.2 1.9 2.0 2.0 2.0 1.9 2.2 2.1 2.1 2.4 2.2 2.2 2.5
Recoveries (%) 86% 85% 89% 88% 87% 88% 90% 88% 86% 88% 92% 91% 90% 92% 93% 90% 89% 92%
$10
$15
$20
$25
$30
$35
$40
$45
$50
0
1,000
2,000
3,000
4,000
5,000
6,000
7,000
Q1/14 Q2/14 Q3/14 Q4/14 Q1/15 Q2/15 Q3/15 Q4/15 Q1/16 Q2/16 Q3/16 Q4/16 Q1/17 Q2/17
Underground tonnes mined per day Unit UG mining costs (US$/t)
UndergroundTPD
UnitUGminingcosts(US$/t)
30. 30
2016 2017 2018 2019
ļ¼ Commissioning of MCM shaft
ļ¼ Transition to 100% owner
development
ļ¼ Ramp up to 7,000 tpd
ļ¼ Raise boring of lower NG shaft
ā¢ Completion of MCM waste pass
ā¢ Shaft bottom infrastructure
ā¢ Northgate shaft hoisting from
8900L
Young-Davidson ā Development Schedule
Please refer to Cautionary Notes on non-GAAP Measures and Additional GAAP Measures.
Declining capital intensity
31. 31
Young-Davidson ā Long Section
Productivity improvements &
declining costs
Developing the underground to support ramp up of underground mining
Milled grade higher
Declining capital intensity
Higher underground mining
rates driving:
Production growth
33. 33
Zone 3
Zone 2
Zone 1
Zones 1 & 2 YE2016
Reserve Pits
ZONE 3 INTERCEPTS
17YAQ053 - 18.00 m at 3.52 g/t Au (107-125m)
17YAQ055 - 7.20 m at 9.21 g/t Au (133-140m)
17YAQ048 - 33.50 m at 2.12 g/t Au (73-107m)
17YAQ065 - 23.10 m at 2.81 g/t Au (90-113m)
17YAQ012 - 39.60 m at 1.54 g/t Au (83-122m)
17YAQ016 - 25.00 m at 1.71 g/t Au (92-117m)
16YAQ123 ā 11.9m @ 2.725 g/t Au (178-190m)
16YAQ126 ā 17.1m @ 2.873 g/t Au ( 131-148m)
16YAQ203 ā 14m @ 2.464 g/t Au (159-173m)
16YAQ204 ā 13m@ 6.906 g/t Au (123-136m)
16YAQ230 ā 17.7m @ 3.03 g/t Au (77-95m)
ZONE 2 INTERCEPTS
16YAQ125 ā 88.4m @ 2.769 g/t Au (99-188m)
16YAQ129 ā 76.8M @ 3.168 g/t Au (110-187m)
16YAQ135 ā 76m @ 4.374 g/t Au (60-136m)
16YAQ156 ā 41.4m @ 2.348 g/t Au (97-138m)
16YAQ158 ā 53.9m @ 1.245 g/t Au (121-175m)
16YAQ228 ā 32.6m @ 7.587 g/t Au (106-138m)
ZONE 1 INTERCEPTS
16YAQ027 - 30.9m @ 2.201 g/t Au (59-90m)
16YAQ035 - 78.4m @ 1.20 g/t Au (140-220m)
16YAQ045 - 36.5m @ 1.677 g/t Au (70-106m)
16YAQ106 - 36.2m @ 4.332 g/t Au (99-135m)
16YAQ062 - 48.8m @ 2.22 g/t Au (137-186m)
Yaqui Phase 1 Reserve pit
1 For more information, see press releases dated February 23, 2017, August 3, 2017 and mineral reserve and resource estimates and associated footnotes in appendix.
34. 34
Strong Portfolio of Development Projects
NORTH AMERICA
STAGE CANADA UNITED STATES MEXICO TURKEY
Construction La Yaqui Phase I
Permitting/
Feasibility
Lynn Lake
Kirazlı
AÄi DaÄi
Ćamyurt
Advanced
Exploration/
Development
Quartz Mountain
Cerro Pelon
La Yaqui Grande
Esperanza
Other
Exploration
Opportunities
Lynn Lake Regional
Quartz Mountain
Targets
Los Bajios
San Carlos Far East
El Refugio
El Carricito
Ćamyurt
Expansion
Kirazlı Zones
35. 35
Kirazlı, AÄı DaÄı & Ćamyurt Economic Studies ā 2017
Feasibility Study - 2017 Preliminary Economic Assessment - 2017
Kirazlı AÄı DaÄı Ćamyurt
Production
Mine life (years) 5 6 4
Total gold production (ounces) 540,000 937,300 373,200
Total silver production (ounces) 3,141,000 2,365,200 1,612,600
Average annual production (ounces)1
Gold 104,000 177,600 93,200
Silver 617,300 444,200 403,000
Total ore mined (tonnes) 26,100,000 54,361,000 16,580,000
Total waste mined (tonnes) 37,900,000 55,893,000 30,874,000
Total material mined (tonnes) 64,000,000 110,254,000 47,454,000
Waste-to-ore ratio2
1.45 1.03 1.86
Average grade (grams per tonne)
Gold 0.79 0.67 0.92
Silver 12.0 5.4 6.3
Recovery (%)
Gold 81% 80% 76%
Silver 31% 25% 48%
Average throughput (tpd) 15,000 30,000 15,000
Operating Costs
Total cost per tonne of ore3
$8.49 $6.46 $14.03
Total cash cost (per ounce sold)4
$339 $374 $604
Mine-site all-in sustaining cost (per ounce sold)4
$373 $411 $645
Capital Costs (millions)
Pre-production capital expenditure $151.9 $250.3 $10.2
Sustaining capital expenditure $18.1 $33.9 $9.4
Reclamation costs (net of salvage value) $9.9 $28.8 $5.9
Total capital expenditure $179.8 $312.9 $25.5
Economic Analysis
IRR (after-tax) 44.3% 38.7% 253.0%
NPV @ 0% discount rate (after-tax, millions) $299.3 $492.8 $173.8
NPV @ 5% discount rate (after-tax millions) $222.9 $360.2 $111.4
NPV @ 8% discount rate (after-tax, millions) $186.5 $297.6 $86.2
Gold price assumption (average, per ounce sold) $1,250 $1,250 $1,250
Silver price assumption (average, per ounce sold) $16.00 $16.00 $16.00
Exchange Rate (Turkish Lira/US Dollar) 2.90:1 2.90:1 2.90:1
1 Average annual production is based on five full years of production for Kirazlı and AÄı DaÄı and excludes pre-commercial production
2 Reported waste-to-ore ratio is over the life of mine. The waste-to-ore ratio during commercial production is 0.70:1 for AÄı DaÄı and 1.19:1 for Kirazlı in the 2017 feasibility study
3 Total unit cost per tonne of ore excludes silver as a by-product credit
4 Total cash costs and mine-site all-in sustaining costs include silver as a by-product credit
38. 38
2016 Total Inferred Mineral Resources
INFERRED GOLD MINERAL RESOURCES
(as at December 31, 2016)
Tonnes Grade Ounces
(000's) (g/t Au) (000's)
Young-Davidson - Surface 31 0.99 1
Young-Davidson - Underground 3,524 2.76 313
Total Young-Davidson 3,555 2.75 314
Mulatos 8,935 0.92 265
San Carlos UG 162 4.93 26
La Yaqui 174 1.39 8
Cerro Pelon 109 1.23 4
Carricito 900 0.74 22
Total Mulatos 10,280 0.98 325
El Chanate 112 0.71 3
MacLellan 1,898 2.01 123
Gordon 4,364 2.87 403
Burnt Timber 23,438 1.04 781
Linkwood 21,004 1.16 783
Total Lynn Lake 50,704 1.28 2,089
Esperanza 718 0.80 18
AÄı DaÄı 16,760 0.46 245
Kirazli 5,689 0.59 108
Ćamyurt 2,791 0.95 85
Total Turkey 25,240 0.54 438
Quartz Mountain 39,205 0.91 1,147
Alamos - Total 129,815 1.04 4,334
INFERRED SILVER MINERAL RESOURCES
(as at December 31, 2016)
Tonnes Grade Ounces
(000's) (g/t Ag) (000's)
La Yaqui Grande 174 5.55 31
Esperanza 718 15.04 347
AÄı DaÄı 16,760 2.85 1,534
Kirazli 5,689 8.96 1,638
Ćamyurt 2,791 5.77 518
Alamos - Total 26,132 4.84 4,068
39. 39
Notes to Mineral Reserve and Resource Estimates
Notes to Mineral Reserve and Resource Tables:
ā¢ The Companyās Mineral Reserves and Mineral Resource as at December 31, 2016 are classified in accordance with the Canadian Institute of Mining Metallurgy and Petroleumās āCIM Standards on Mineral
Resources and Reserves, Definition and Guidelinesā as per Canadian Securities Administratorās NI 43-101 requirements.
ā¢ Mineral Resources are not Mineral Reserves and do not have demonstrated economic viability.
ā¢ Mineral Resources are exclusive of Mineral Reserves.
ā¢ Mineral Reserve cut-off grade for the Mulatos Mine, the Cerro Pelon Pit, the La Yaqui Pit, the Kirazlı Pit and the AÄı DaÄı Pit are determined as a net of process value of $0.10 per tonne for each model
block
ā¢ All Measured, Indicated and Inferred Mineral Resources are pit constrained with the exception of those outside the Mulatos Main Pits on the Mulatos property which have no economic restrictions and
are tabulated by gold cut-off grade.
ā¢ Mineral Reserve estimates assumed a gold price of $1,250 per ounce and Mineral Resource estimates assumed a gold price of $1,400 per ounce, except as follows: Lynn Lake Mineral Resources assumed a
gold price of $1,550 per ounce with an assumption of the Canadian dollar at parity with the United States dollar. Metal prices, cutoff grades and metallurgical recoveries are set out in the table below.
ā¢ El Chanate reserve ounces include a December 31, 2016 inventory 99,900 recoverable ounces in the heap leach pad
Qualified Persons:
Chris Bostwick, FAusIMM, Alamos Goldās Vice President, Technical Services, has reviewed and approved the scientific and technical information contained in this news release. Chris Bostwick is a Qualified
Person within the meaning of Canadian Securities Administratorās National Instrument 43-101 (āNI 43-101ā). The Qualified Persons for the National Instrument 43-101 compliant mineral reserve and resource
estimates are detailed in the following table.
Mineral Resources
Jeffrey Volk, CPG, FAusIMM Director - Reserves and Resource,
Alamos Gold Inc.
Young-Davidson, El Chanate, San Carlos U/G, Lynn Lake
Marc Jutras, P.Eng Principal, Ginto Consulting Inc. Mulatos Pits, Cerro Pelon, La Yaqui, Carricito, Esperanza, AÄı DaÄı,
Kirazlı, Ćamyurt, Quartz Mountain
Mineral Reserves
Chris Bostwick, FAusIMM VP Technical Services, Alamos Gold Inc. Young-Davidson, El Chanate,
San Carlos Underground
Herb Welhener, SME-QP VP, Independent Mining Consultants Inc. Mulatos Pits, Cerro Pelon, La Yaqui, AÄı DaÄı, Kirazlı
Resources Reserves
Gold Price Cutoff Gold Price Cutoff Met Recovery
Mulatos:
Mulatos Main Open Pit $1,400 0.5 $1,250 see notes >50%
San Carlos Underground $1,400 2.5 $1,250 3.27 70%
Cerro Pelon $1,400 0.5 $1,250 see notes 75%
La Yaqui $1,400 0.5 $1,250 see notes 75%
Carricito $1,400 0.3 n/a n/a >50%
Young-Davidson - Surface $1,400 0.5 $1,250 0.5 91%
Young-Davidson - Underground $1,400 1.3 $1,250 1.9 91%
El Chanate $1,400 0.15 $1,250 0.15 30-65%
Lynn Lake $1,555 0.4 n/a n/a 89-92%
Esperanza $1,400 0.4 n/a n/a 60-72%
AÄı DaÄı $1,400 0.2 $1,250 see notes 80%
Kirazlı $1,400 0.2 $1,250 see notes 81%
Ćamyurt $1,400 0.2 n/a n/a 78%
Quartz Mountain $1,400 0.21 Oxide, 0.6 Sulfide n/a n/a 65-80%
40. 40
Scott K. Parsons, CFA
VP, Investor Relations
416.368.9932 x 5439
sparsons@alamosgold.com