SlideShare a Scribd company logo
1 of 102
Download to read offline
Vietnam Agribusiness: From farm to chopsticks February 29th, 2008 
EXECUTIVE SUMMARY 
VIETNAM has progressed from a nation of chronic food shortages to one 
of the world’s leading exporters of soft commodities. Vietnam is the 
biggest export of pepper in world, second biggest for rice, coffee, and 
cashew nuts, and fourth biggest for natural rubber. Vietnam has only 
begun to show its potential in the agribusiness sector. 
We believe the global agricultural sector is undergoing a major structural 
change that will affect the entire food value-chain. Increases in global 
demographics, wealth, and food demand, despite limited natural 
resources, erratic weather patterns, and declining arable land and water 
supplies, are resulting in supply-demand pressures across an 
increasingly wide range of commodities. What’s more, we see these 
macro trends, which are shaping the world’s agribusiness, revealing 
themselves in Vietnam. 
Of the 271 listed companies in Vietnam, there are currently 36 
companies involved in the agribusiness value-chain. Together, they add-up 
to more than 18% of the total market capitalization. Given that the 
agribusiness sector accounts for more than 20% of Vietnam’s GDP and 
employs more than 55% the country’s workforce, we built a listed shares 
weighted agribusiness index, HRS Agri-index1, to track the performance 
of the companies involved along the food value-chain. 
We believe Vietnam’s agribusiness companies will face a host of 
challenges and opportunities from the current dynamics in the global 
agribusiness sector. 
Rising local consumption and export demand against supply-side 
constraints will necessitate farmers to increase yields. We believe this 
will drive the demand for farm inputs namely fertilizers, seeds, and 
machinery. 
We believe that as input costs increase, the ones to benefit will be those 
that can minimize price pressures from suppliers and/or customers. 
These are companies that have already started to integrate upstream 
and capable of securing stable input prices, and companies that have a 
strong brand name that can pass the cost onto consumers. 
We believe the rise of supermarkets in Vietnam will affect the whole 
agribusiness value-chain. As modern procurement systems invariably 
exert more demanding requirements from processors we see greater 
demand for cold storage, logistics, warehousing, and processing 
facilities. 
As supermarkets tend to source products from medium to large 
processors and wholesalers, we believe there will be opportunities for a 
greater level of integration along the supply-chain. Moreover, we believe 
there is an opportunity for corporations to set up large scale industrial 
farms and factory farms, as more flexible land reforms have opened the 
door to land consolidation and accumulation. 
Finally, we believe there is an opportunity for branded FMCG food 
products. Added-value food products have had a tremendous growth in 
2007; five of the ten fastest growing health and convenience products 
were food goods. What’s more, brand-aware Vietnamese consumers are 
buying Vietnamese products; five of the ten fastest growing brands were 
Vietnamese in 2007. 
1 Horizon Securities clients can contact their account manager to get more information 
on how they can invest in the same proportions set out in any of the HRS Indices. 
Horizon Securities 
Horizon Securities 
Research team 
Marc Djandji, CFA 
Head of Research 
marcdiandji@horizonsecurities.com 
+84.90.318.9687 
Khoi Pham 
Analyst 
khoipham@horizonsecurities.com 
Phuong Le 
Analyst 
phuongle@horizonsecurities.com 
HRS Agri-index, VN-index, HaSTC index 
200 
180 
160 
140 
120 
100 
80 
60 
40 
20 
0 
1/07 
2/07 
3/07 
4/07 
5/07 
6/07 
7/07 
8/07 
9/07 
10/07 
11/07 
12/07 
1/08 
2/08 
VN-Index_adj HASTCI_adj AGRI-Index_adj 
Please refer to the important disclosures at 
the end of this document.
Vietnam Agribusiness: From farm to chopsticks February 29th, 2008 
Table of contents 
I. THE END OF CHEAP FOOD............................................................................................... 4 
1.1 THE FOOD SUPPLY-DEMAND EQUATION; DEMAND FACTORS................................................. 4 
1.2 THE FOOD SUPPLY-DEMAND EQUATION; SUPPLY FACTORS .................................................. 7 
1.3 THE FOOD SUPPLY-DEMAND EQUATION; SOFT COMMODITIES ARE TAKING CENTRE STAGE ....... 7 
II. CHALLENGES AND OPPORTUNITIES FOR VIETNAM AGRIBUSINESS ........................10 
III. LISTED AGRIBUSINESS ................................................................................................14 
IV. FARM INPUT..................................................................................................................16 
4.1 FERTILIZER SECTOR IN VIETNAM: RELYING HEAVILY ON IMPORTS.......................................16 
4.2 CROP PROTECTION ......................................................................................................18 
4.3 OPPORTUNITIES FOR THE SEED SECTOR .........................................................................19 
4.4 FARMING MACHINERY ..................................................................................................20 
4.5 ANIMAL FEED..............................................................................................................21 
V. RESOURCE PRODUCERS ..............................................................................................21 
5.1 CROP PRODUCTION: OPPORTUNITIES FOR LARGE-SCALE FARMING ENTERPRISES.................21 
5.2 CONTRACT FARMING....................................................................................................22 
VI. PROCESSING ................................................................................................................22 
6.1 DAIRY PRODUCTS: UPTREND DEMAND AND LOW LEVEL OF SUBSTITUTE .............................22 
6.2 SUGAR INDUSTRY: UNDER GOVERNMENT’S “PRICE MANAGEMENT”...................................23 
6.3 CONFECTIONERY: SEVERE COMPETITION AMONG RIVALS. .................................................25 
6.4 AQUACULTURE PROCESSING: VIETNAM’S FOURTH LARGEST INCOME..................................26 
6.5 SOFT DRINK: STILL ENOUGH ROOM FOR LOCAL PLAYERS TO GROWTH ................................27 
VII. DISTRIBUTION: THE RISE OF SUPERMARKETS ........................................................28 
VIII. COMPANIES IN FOCUS...............................................................................................30 
2 Horizon Securities
Vietnam Agribusiness: From farm to chopsticks February 29th, 2008 
Table of figures 
FIGURE 1. WORLD’S MEAT CONSUMPTION VS. GDP ...................................................................................... 5 
FIGURE 2. VIETNAM’S MEAT CONSUMPTION PER CAPITA.................................................................................. 5 
FIGURE 3. FISHERIES AND LIVESTOCK OUTPUT VALUE (BLN’VND).................................................................... 5 
FIGURE 4. AGRICULTURE, FISHERIES AND LIVESTOCK COMPOSITION ................................................................. 5 
FIGURE 5. US GRAINS FOR ETHANOL PRODUCTION......................................................................................... 6 
FIGURE 6. US BIOFUELS CONSUMPTION....................................................................................................... 6 
FIGURE 7. WORLD’S GRAIN PRODUCTION AND CONSUMPTION.......................................................................... 7 
FIGURE 8. WORLD UREA FERTILIZER PRICE ................................................................................................... 9 
FIGURE 9. WORLD COFFEE PRICE................................................................................................................ 9 
FIGURE 10. WORLD WHEAT PRICE .............................................................................................................. 9 
FIGURE 11. VIETNAM FOOD CPI VS. TOTAL CPI ............................................................................................ 9 
FIGURE 12. VIETNAM RICE PRICE ................................................................................................................ 9 
FIGURE 13. VIETNAM PIG AND PIGLET PRICE ................................................................................................ 9 
FIGURE 14. VIETNAM INDUSTRY AND DOMESTIC CHICKEN PRICE...................................................................... 9 
FIGURE 15. VIETNAM GASOLINE PRICE......................................................................................................... 9 
FIGURE 16. TOP 10 GROWTH CATEGORIES ................................................................................................ 11 
FIGURE 17. TOP 10 FASTEST GROWING BRANDS ........................................................................................ 11 
FIGURE 18. VIETNAM AGRICULTURE GDP TO TOTAL GDP ............................................................................ 13 
FIGURE 19. VIETNAM AGRICULTURE OUTPUT............................................................................................... 13 
FIGURE 20. VIETNAM AGRICULTURE EXPORT MIX ......................................................................................... 13 
FIGURE 21. VIETNAM AGRICULTURE EXPORT VS. TOTAL EXPORT ..................................................................... 13 
FIGURE 22. WORLD ARABLE LAND PER CAPITA............................................................................................ 13 
FIGURE 23. VIETNAM ARABLE LAND FOR PADDY .......................................................................................... 13 
FIGURE 24. VIETNAM ARABLE LAND FOR PERENNIAL INDUSTRIAL CROPS ......................................................... 13 
FIGURE 25. VIETNAM ARABLE LAND FOR ANNUAL INDUSTRIAL CROPS ............................................................. 13 
FIGURE 26. HRS AGRI-INDEX.................................................................................................................. 14 
FIGURE 27. HRS AGRI-INDEX COVERED STOCKS: VALUATION COMPARABLES .................................................. 14 
FIGURE 28. VIETNAM: AGRIBUSINESS VALUE CHAIN..................................................................................... 15 
FIGURE 29. LISTED COMPANIES IN FARM INPUT SECTOR............................................................................... 16 
FIGURE 30. LOCAL FERTILIZER PRODUCTION............................................................................................... 16 
FIGURE 31. VIETNAM’S FERTILIZER IMPORT................................................................................................ 16 
FIGURE 32. FERTILIZER PRICES ................................................................................................................ 17 
FIGURE 33. LOCAL SUPPLY VS. DEMAND.................................................................................................... 17 
FIGURE 34. MARKET SHARE 2007.......................................................................................................... 17 
FIGURE 35. MARKET SHARE 2010.......................................................................................................... 17 
FIGURE 36. VIETNAM GAS RESERVE AND PRODUCTION................................................................................. 18 
FIGURE 37. GROWTH OF THE BIOTECH CROP MARKET IN THE WORLD.............................................................. 19 
FIGURE 38. LIST OF REGISTERED SEEDS IN VIETNAM................................................................................... 20 
FIGURE 39. WORLD PADDY YIELD ............................................................................................................. 21 
FIGURE 40. LISTED COMPANIES IN MILK SECTOR......................................................................................... 22 
FIGURE 41. VIETNAM: PRODUCTION OF MILK BY PROVINCE ........................................................................... 23 
FIGURE 42. LISTED COMPANIES IN SUGAR SECTOR ...................................................................................... 23 
FIGURE 43. SUGAR MARKET IS HIGHLY FRAGMENTED .................................................................................. 24 
FIGURE 44. DOMESTIC SUGAR PRICE IN THE PAST 2 YEARS........................................................................... 24 
FIGURE 45. VIETNAM: TARIFF REDUCTION ROADMAP IN COMPLIANCE WITH WTO ............................................. 24 
FIGURE 46. KEY PLAYER MARKET SHARES ................................................................................................. 25 
FIGURE 47. LISTED COMPANIES IN CONFECTIONERY SECTOR......................................................................... 25 
FIGURE 48. VIETNAM AQUACULTURE EXPORT .............................................................................................. 26 
FIGURE 49. PRODUCTION OF AQUATIC PRODUCT.......................................................................................... 26 
FIGURE 50. LISTED COMPANIES IN FISHERY SECTOR .................................................................................... 26 
FIGURE 51. EXPORTS REPRESENT A SIGNIFICANT PORTION OF AQUACULTURE PROCESSORS’ TOTAL REVENUE........ 27 
FIGURE 52. LISTED COMPANIES IN SOFT-DRINK SECTOR............................................................................... 27 
FIGURE 53. TRADITIONAL SHOPPING STILL DOMINATES VIETNAM................................................................... 28 
FIGURE 54. …BUT MODERN SHOPPING TREND IS ON THE RISE ...................................................................... 28 
FIGURE 55. MODERN TRADING FORM IS CHANGING AGRIBUSINESS VALUE CHAIN ............................................. 28 
FIGURE 56. LIST OF MAJOR SUPERMARKETS, HYPERMARKETS AND DEPARTMENT STORES IN VIETNAM ................ 29 
FIGURE 57. RETURN ON AGRIBUSINESS STOCKS......................................................................................... 31 
FIGURE 58. AGRIBUSINESS SHARES ABSOLUTE PERFORMANCE (TOP 10 COMPANIES) ...................................... 32 
3 Horizon Securities
Vietnam Agribusiness: From farm to chopsticks February 29th, 2008 
I. The end of cheap food 
We believe the global agricultural sector is undergoing a major structural change that 
will affect the entire food value-chain. The global macro trends that are shaping the 
world’s agribusiness are also revealing themselves in Vietnam. 
Continuous increases in global demographics, wealth, and food demand, despite 
limited natural resources, erratic weather patterns, and declining arable land and 
water supplies, are resulting in pressures across an increasingly, wide range of soft 
commodities. Soaring oil prices have contributed to the increased inflationary 
pressure of most agricultural crops: 1) by raising input and transportation costs, and 
2) by boosting demand for agricultural crops used as feedstock in the production of 
alternative energies. Hence, we are entering a period of short supply, yet robust 
global demand for agricultural products and food, resulting in worldwide agflation2. 
There can be no discussion concerning the current environment affecting 
agribusiness without mentioning biofuels and China. The recent surge in demand for 
biofuels and the greater hectarage allocated to biofuels feedstock which followed, 
coupled with China’s insatiable hunger for animal protein have compounded the 
current global agflation pressures. We believe these factors, have and will continue 
to put pressure on the supply-demand equation for years to come. 
Since the introduction of its economic reforms, Vietnam progressed from a nation of 
chronic food shortages to one of the world’s leading exporters of agricultural 
products, namely rice, coffee, rubber, and tea. Vietnam has only begun to show its 
potential in the agriculture sector and at this stage most of its agribusiness is 
involved in low margin commodity exports, rather than value-added processed foods. 
Vietnamese agribusiness industry must confront issues of low production yields, high 
costs, food safety, and deficiencies in the processing and distribution segments. In 
view of Vietnam’s dependency on agriculture and exports of commodities, and given 
that agribusiness accounts for more than 18% of total listed market capitalization, 
Horizon Securities has sought out the listed agribusiness companies and has 
highlighted some of the major opportunities and challenges these companies will 
face. 
1.1 The food supply-demand equation; demand factors 
We observe three key catalysts driving the long-term demand for agricultural 
production and agribusiness. 
Demographics: Current world population is believed to have reached over 6.6 billion 
and is expected to surpass 7.5 billion by 2025, growing by over 70 million per year. 
That 70 million additional people a year worldwide need to bed fed, while the supply 
of arable land has been on the decline. Current population growth compounded by 
improvement in health and life expectancy in developing countries intensifies the 
demand for food. 
We see China and India as being key factors in the global food supply-demand 
equation as they account for more than one-third of the world’s population. With a 
population of about 1.3 billion, China feeds the largest number of consumers in the 
world. China becoming a net importer of food would have major repercussions on 
world demand and soft commodity prices. China has already shifted from being self-sufficient 
to an importer for certain food staples, such as soybean of which it is now 
the world's largest importer. In addition, we are facing the fact that China will soon 
have to begin importing much more corn than the 100,000 tones it is currently 
importing. According to Zhu Changguo, Chairman of the Chinese Cereals and Oils 
Association, China could be forced to import 10 million tons of corn a year by 2010 to 
feed its growing livestock industry and ethanol production. 
2 Merrill Lynch, April 2007 
We believe major structural 
change in global agricultural 
that will affect the entire food 
value-chain 
Agribusiness accounts for more 
than 18% of Vietnam’s total 
listed market capitalization 
China has shifted from being 
self-sufficient to an importer for 
certain food staples 
4 Horizon Securities
Vietnam Agribusiness: From farm to chopsticks February 29th, 2008 
Vietnam’s population exceeded 85 million in 2007 with over 50% under 30 years old 
and a median age of 26.4 years. Successful family planning efforts resulted in the 
population growth rate dropping to 1% in 2007 from 2.1 percent in 1989. According 
to the US Census Bureau the Vietnam’s population will be just short of 100 million by 
2025, growing at an average 0.8 million per year. 
Eating habits: Demand for animal protein, such as beef, pork, poultry, and dairy 
generally increases with affluence. Increasing real income and urbanization in 
emerging markets are encouraging higher levels of nutrition and diets that 
incorporate more animal protein. 
Figure 1. World’s meat consumption vs. GDP Figure 2. Vietnam’s meat consumption per capita 
y = 24.201Ln(x) - 159.24 
R2 = 0.6254 
160 
140 
120 
100 
80 
60 
40 
20 
0 
-20 
0 10,000 20,000 30,000 40,000 50,000 60,000 
GDP 
Meat consumption (k g pe r cap i ta) 
45.00 
40.00 
35.00 
30.00 
25.00 
20.00 
15.00 
10.00 
5.00 
- 
1987 
1988 
1989 
1990 
1991 
1992 
1993 
1994 
1995 
1996 
1997 
1998 
1999 
2000 
2001 
2002 
2003 
2004 
2005 
2006 
2007 
kg/person 
Source: Horizon Securities, FAO Source: Horizon Securities, FAO, USDA 
Rising income, particularly in Vietnam’s urban areas induced a rapid increase in 
demand for meat. Per capita meat consumption went from 16kg/year in 1987 to 
38.17kg/year in 2007, 70% of which is pork meat. In response to this rising demand, 
the private sector invested heavily in feed, breeding, and slaughtering/processing. 
Between 2000 and 2006 the total value of livestock output increased at over 7% 
GAGR while the total agricultural sector increased by 4%. 
Figure 3. Fisheries and livestock output value 
(bln’VND) 
more animal protein in 
Vietnamese diet… 
Figure 4. Agriculture, fisheries and livestock 
composition 
30,000 
25,000 
20,000 
15,000 
10,000 
5,000 
0 
1990 1991 1992 1993 1994 1995 1996 1997 1998 1999 2000 2001 2002 2003 2004 2005 2006 
O u tp u t v a l u e o f f i s h i n g & l i v e s to c k a t 1 9 9 4 
c o n s ta n t p r i c e s 
Oceanic fisheries Aquaculture Domestic animal Poultry Non - meat product 
200,000 
180,000 
160,000 
140,000 
120,000 
100,000 
80,000 
60,000 
40,000 
20,000 
- 
1990 1991 1992 1993 1994 1995 1996 1997 1998 1999 2000 2001 2002 2003 2004 2005 2006 
Bi l l ion VND 
Domestic animals Poultry Non-meat products Grains Vegetables 
Industrial crops Fruit crops Oceanic fisheries Aquaculture 
Source: GSO Source: GSO 
In 2000, the state selected pork and dairy as strategic livestock commodities. While 
pork was chosen to develop an export market, dairy was developed in order to 
reduce Vietnam’s reliance on milk imports. The number of live pigs increased from 
18.9 million in 1999 to 26.9 million by 2006. Live cattle increased from just above 4 
million in 1999 to over 6.5 million in 2006. 
Thanks to better breeding methods, higher quality feeds, and new large-scale animal 
farming facilities, the country was able to increase production capacity and yields. 
Between 2000 and 2006, the average weight of a pig increased by over 30%, while 
the amount of milk domestically produced went from 51,000 tons to over 200,000 
tons per year. 
… means more livestock 
production 
5 Horizon Securities
Vietnam Agribusiness: From farm to chopsticks February 29th, 2008 
Economic growth has also benefited the production of other types of animal proteins. 
The Vietnamese poultry sector had been scaling up at a rapid pace in the last 
decade. However, the outbreaks of Avian Influenza in 2004, 2005, and country-wide 
culling of chicken, caused production to be scaled back significantly, as farmers 
worry about loosing their flocks from further outbreaks in the future. 
In 2001, the state formulated a plan to bolster fish farming in the Mekong Delta by 
developing 700,000 hectares of land. Backed by strong government support, fish 
and shrimp farming grew at over 19% CAGR from 2000 to 2007. There are now close 
to one million fish farming hectares and the sector produces more than two million 
tons of farmed aquatic products per year. 
Most of the world's livestock is grain fed; grain account for 70% of the cost of the 
animals’ diet. To raise poultry and pork, it takes an estimated 2 to 4 kg of grain to 
produce 1 kg of meat, and for grain-fed cattle, the figure is an estimated 7 kg of grain 
per 1 kg of meat. Therefore, as demand for grain-fed animal protein increases, so 
does demand for animal feed. The increasing demand for animal feed has prompted 
Hanoi to boost maize production (at the expense of arable land used to growing rice) 
in an effort to reduce Vietnam’s dependency on maize imports for feed 
manufacturing. 
Biofuels: In response to higher energy prices, and fueled by government incentives, 
the fledgling biofuels industry has started to grow at an explosive pace. This growth 
was fuelled by a series of government policies aiming to reduce petroleum 
dependency. In his State of the Union address, in January 2007, President Bush 
declared that the US would need to expand the use of biofuels and invest in new 
technologies to produce ethanol. Concretely, in December 2007, the adoption of the 
United States Energy Bill doubled the Renewable Fuel Standard (RFS) for first 
generation biofuels to 15 billion gallons per year by 2015. 
Figure 5. US grains for ethanol production Figure 6. US biofuels consumption 
120 
100 
80 
60 
40 
20 
0 
1980 1985 1990 1995 2000 2005 
Mi l l i on Tons 
500,000,000 
450,000,000 
400,000,000 
350,000,000 
300,000,000 
250,000,000 
200,000,000 
150,000,000 
100,000,000 
50,000,000 
0 
… more grain for animal feed 
results in less grain for food 
grain account for 70% of the 
cost of the animals’ diet 
2000 2001 2002 2003 2004 2005 2006 2007E 
Demand (tons) 
Source: Earth Policy Institute Source: US National Biodiesel Board 
By far the largest producer of biodiesel in the world, the European Union has about 
180 operational biodiesel plants which have a production capacity estimated at 10.2 
million tons. Supportive government policies in the European Union have encouraged 
biodiesel production. 
The US National Biodiesel Board indicates there are 171 operational biodiesel plants 
in the United States, with a total production capacity exceeding 8.48 billion liters. 
Production capacity has rocketed in response to growing demand, which has risen 
from 98 million liters in 2004 to 852 million liters in 2006. 
Although we believe this will significantly disrupts the supply-demand structure of 
major crops, government biofuels policy is the key variable that will determine the 
extent of ethanol’s effect on soft commodity prices. In fact, in response to higher food 
prices and research suggesting limited environmental benefits of starch-based 
6 Horizon Securities
Vietnam Agribusiness: From farm to chopsticks February 29th, 2008 
biofuels technology, there is growing concern, particularly in Europe, about the 
viability of diverting arable land for biofuels feedstock. 
1.2 The food supply-demand equation; supply factors 
Over the past 50 years, the green revolution had enabled world food production to 
outpace rising demand (and sustain a low-priced food environment). New 
technologies and agricultural techniques such as crop rotation, mass production and 
use of agrochemicals, expanded irrigation, and the introduction of genetically 
superior, disease-resistant plants brought about considerable benefits. However, the 
demand has caught up while supply has slowed. In Vietnam, major investments in 
irrigation had contributed to past sector growth, for rice in particular, but this 
production has begun to plateau. 
Among the most serious constraints to increasing yields in the face of population 
growth are: 1) shortages of arable land, 2) degradation of land resources, 3) loss of 
agricultural land due to urbanization, 4) diversification to non-food of arable land, 5) 
water shortages and pollution, 6) irrigation problems, 7) collapsing oceanic fisheries, 
and 8) climate change. As a result capacity to increase food production may well be 
shrinking. 
At the time of writing this report, we are reminded of Vietnam’s agri-sector’s 
vulnerability to adverse weather and risks of disease/pests outbreaks. A record-long 
cold weather in the North of Vietnam has caused over 60,000 cattle to die, and has 
destroyed over 150,000 hectares of rice paddies. Water shortages caused by low 
rainfall in the North of Vietnam, are hurting agriculture in the Red River Delta. 
There are also growing concerns about elevated risks of another bird flue outbreak 
and potential blue-ear outbreak. Since the beginning of the year there have been 
H5N1 outbreaks in seven provinces in the country. Although Vietnam has been 
vaccinating poultry for years, there is a clear and present risk that farmers may have 
to cull millions of birds as they did in 2004 and 2005. 
1.3 The food supply-demand equation; soft commodities are taking centre stage 
Soft commodities prices have soared to decade-highs affecting producers, 
consumers, and governments everywhere. The triggering factor was the sudden 
increase in demand for grain used to manufacture ethanol in the US. From 2006 to 
2007, grain used for ethanol production jumped from 54 million tons to 81 millions, 
effectively doubling the 
annual growth in world grain 
demand. 
The most significant year-over- 
year price increase has 
been for wheat, which rose by 
an average 74.5%. World 
maize prices increased by 
nearly 20% in 2007, but this 
follows an increase of almost 
45% in the previous year. For 
rice, world prices registered a 
17% rise year-over-year. 
Declining global stockpiles of 
soft commodities are 
Figure 7. World’s grain production and consumption 
2,500 
2,000 
1,500 
1,000 
500 
0 
Production Consumption 
1960 1970 1980 1990 2000 
Mil l ion Metr ic Tons 
Source: USDA 
exacerbating current price pressures. Global inventories of grains are currently at a 
25-year low. 
What sets apart the current agri-sector conditions to previous ones is the fact that 
prices are soaring, not just for a selected few, but for nearly all, major food and feed 
commodities. 
From 2006 to 2007, grain 
used for ethanol production 
jumped from 54 million tons to 
81 millions 
7 Horizon Securities
Vietnam Agribusiness: From farm to chopsticks February 29th, 2008 
As these events permeate into the food value-chain in Vietnam, processors and 
consumers are feeling the crunch. Furthermore, a politic of food scarcity is emerging 
as Hanoi has limited rice exports in an attempt to limit the rise in domestic food 
prices. In 2007, Vietnam’s Consumer Price Index rose by 12.6%, while food and 
foodstuff jumped 19%, the highest increase among the CPI’s components. Food and 
foodstuff alone, account for more than 42% of the CPI basket. 
Fighting inflation in Vietnam 
We are concerned about Vietnam’s rampant inflation and the ramifications it will have on the 
economy and consumer spending. However, the current inflation environment is not only 
inherent to Vietnam, as we point out throughout this report; there are global pressures at work 
that are affecting inflation everywhere. 
It’s always difficult to know why central bankers do what they do, and we are uncertain about 
how the State Bank’s recent moves will pan out in the economy. First, the State Bank 
announced it would reduce the money supply by approximately VND34,000 billion (US$2.13 
billion) by requiring commercial banks 1) to increase their reserves by 1% to 11% of their 
deposits, and 2) by forcing commercial banks to buy treasury bonds to be issued on 17 March 
2008. Then, last week the State Bank, through open market instruments, injected VND39,000 
billion (US$2.44 billion) into the monetary market with a maturity date on 8 March 2008. In 
short, the State Bank withdrew money and injected it right back, but did this through different 
channels. Almost instantly after these measures were announced, a cold chill ran across the 
red hot real estate market. Commercial banks may have interpreted these measures as a 
message that they needed to restructure their mortgage portfolio. It is still unclear, however, 
how these measures will affect the economy in the short to medium term and whether they will 
be successful at curbing inflation. 
8 Horizon Securities
Vietnam Agribusiness: From farm to chopsticks February 29th, 2008 
Figure 8. World urea fertilizer price Figure 9. World coffee price 
450 
400 
350 
300 
250 
200 
150 
100 
50 
0 
9/27/2002 
12/26/2002 
3/26/2003 
6/24/2003 
9/22/2003 
12/19/2003 
3/18/2004 
6/16/2004 
9/14/2004 
12/13/2004 
3/11/2005 
10/5/2005 
1/3/2006 
4/3/2006 
6/30/2006 
9/28/2006 
12/27/2006 
3/27/2007 
6/25/2007 
9/21/2007 
US$/ton 
2,500 
2,000 
1,500 
US$/ton 
1,000 
500 
- 
11/14/2002 
2/10/2003 
5/16/2003 
8/26/2003 
11/18/2003 
2/17/2004 
5/7/2004 
7/28/2004 
10/18/2004 
1/6/2005 
3/29/2005 
6/17/2005 
9/7/2005 
11/28/2005 
2/16/2006 
5/9/2006 
7/28/2006 
10/18/2006 
1/8/2007 
3/29/2007 
6/19/2007 
9/7/2007 
11/28/2007 
Source: Reuters Source: Reuters 
Figure 10. World wheat price Figure 11. Vietnam food CPI vs. total CPI 
125.0 
120.0 
115.0 
110.0 
105.0 
100.0 
95.0 
90.0 
Dec-02 
Aug -02 
Vietnam CPI Food CPI 
Dec-03 
Apr-03 
Aug-03 
Dec-04 
Apr-04 
Aug-04 
Dec-05 
Apr-05 
Aug-05 
Dec-06 
Apr-06 
Aug-06 
Dec-07 
Apr-07 
Aug-07 
Source: futures.tradingcharts.com Source: GSO 
Figure 12. Vietnam rice price Figure 13. Vietnam pig and piglet price 
9,000 
8,000 
7,000 
6,000 
5,000 
4,000 
3,000 
2,000 
1,000 
0 
Jan-01 
May-01 
Jan-02 
May-02 
Sep-01 
Jan-03 
May-03 
Sep-02 
Jan-04 
May-04 
Sep-03 
Jan-05 
May-05 
Sep-04 
Jan-06 
May-06 
Sep-05 
Jan-07 
May-07 
Sep-06 
Sep-07 
Jan-08 
VND/kg 
80,000 
70,000 
60,000 
50,000 
40,000 
30,000 
20,000 
10,000 
0 
Jan-01 
Jul-01 
Oct-01 
Apr-01 
Piglet Live pig 
Jan-02 
Jul-02 
Oct-02 
Apr-02 
Jul-03 
Oct-03 
Apr-03 
Jan-03 
Jan-04 
Jul-04 
Oct-04 
Apr-04 
Jul-05 
Oct-05 
Apr-05 
Jan-05 
Jan-06 
Jul-06 
Oct-06 
Apr-06 
Jan-07 
Jul-07 
Oct-07 
Apr-07 
Jan-08 
VND/k g 
Source: Agriculture Information Center of Vietnam Source: Agriculture Information Center of Vietnam 
Figure 14. Vietnam industry and domestic chicken 
Figure 15. Vietnam gasoline price 
price 
120,000 
100,000 
80,000 
60,000 
40,000 
20,000 
0 
Industry Chicken Domestic Chicken 
Jan-06 
Feb-06 
Mar-06 
Apr-06 
May-06 
Jun-06 
Jul-06 
Aug-06 
Sep-06 
Oct-06 
Nov-06 
Dec-06 
Jan-07 
Feb-07 
Mar-07 
Apr-07 
May-07 
Jun-07 
Jul-07 
Aug-07 
Sep-07 
Oct-07 
Nov-07 
Dec-07 
Jan-08 
Feb-08 
VND/kg 
14,000 
12,000 
10,000 
8,000 
6,000 
4,000 
2,000 
0 
Jan-01 
May-01 
Sep-01 
Jan-02 
May-02 
Sep-02 
Jan-03 
May-03 
Sep-03 
Jan-04 
May-04 
Sep-04 
Jan-05 
May-05 
Sep-05 
Jan-06 
May-06 
Sep-06 
Jan-07 
May-07 
Sep-07 
Jan-08 
VND/l i ter 
Source: Agriculture Information Center of Vietnam Source: Agriculture Information Center of Vietnam 
9 Horizon Securities
Vietnam Agribusiness: From farm to chopsticks February 29th, 2008 
II. Challenges and opportunities for Vietnam agribusiness 
Government reforms were successful in stimulating agricultural production to the 
extent that Vietnam moved from being a rice importer to the world’s second largest 
rice exporter. Despite positive strides in the sector, Vietnamese farmers still face 
many challenges and continue to operate with very limited capital. Outdated 
machinery is common and the majority of Vietnam's fields are still tended by non-mechanical 
means, mainly manual labor or water buffalo. 
Poor transportation systems and the lack of post-harvest handling, storage, and 
processing facilities are causing high spoilage rates. The MARD estimates that 20% 
of all production is lost due to inadequate storage and processing equipment. 
To sum up, since the late 1990’s Vietnam’s agribusiness increased owing to strong 
domestic demand for food and rising agri-exports. However, considering the need for 
investments in the sector and poor fixed asset base, we are concerned about the 
ability of Vietnam’s agribusiness companies to maintain margins amid surging soft 
commodities costs. 
We believe, however, that there will be significant growth opportunities for well 
positioned players all along the agribusiness value-chain, from farm inputs to 
retailers, as Vietnam’s agribusiness sector must increase production, yields, quality 
of products, processing capabilities, handling, packaging and logistics. 
Rising local consumption and export demand against supply-side constraints (limited 
land, water supply, low reserves, and weather) will necessitate farmers to increase 
yields. We believe this will drive the demand for farm inputs such as agrochemicals, 
seeds, and machinery. While there is no new capacity expected before 2010, the 
growing demand for fertilizer is leading to rising imports. We believe domestic 
fertilizer producers could benefit from a potential government “release” of domestic 
prices as these have yet to be aligned with world prices. 
We believe that as input costs increase, the ones to benefit will be those that can 
minimize price pressures from suppliers and/or customers. These are companies 
that have already started to integrate upstream and capable of securing stable input 
prices, and companies that have a strong brand name that can pass the cost onto 
consumers. 
Moreover, we believe there is an opportunity for corporations to set up large scale 
industrial farms and factory farms, as more flexible land reforms have opened the 
door to land consolidation and accumulation. 
Additionally, exports of food products can become a valuable growth driver for the 
agribusiness sector if Vietnam is able to improve price competitiveness, quality of 
products, and move towards higher-value products. Domestic producers must meet 
all the processes and hygiene requirements set by importing countries, regarding 
farming, harvesting, processing and packing. 
Over the past several years, Vietnam's urban economy has begun a steady transition 
from traditional open-air markets to modern supermarkets and shopping centers. 
Although early stage, this trend alone has increased the extent of the food value-chain. 
The success of large-scale retailing and food exports is depends on an 
efficient supply chain. As modern procurement systems invariably exert more 
demanding requirements from processors we see greater demand for cold storage, 
logistics, warehousing, and processing facilities. 
Finally, the urban middle-class accounted for 55% of the urban population in 2006, 
up from 33% in 2003. With a fast-growing urban middle-class and demand for higher 
value products in Vietnam’s cities, we believe there is an opportunity for branded 
FMCG food products. Added-value food products have had a tremendous growth in 
2007; five of the ten fastest growing health and convenience products were food 
Vietnam moved from being a 
rice importer to the world’s 
second largest rice exporter 
Rising local consumption and 
export demand drive the 
demand for farm inputs 
…fast-growing urban middle-class 
and demand for high-value 
products in Vietnam’s 
cities create opportunity for 
branded FMCG food products 
10 Horizon Securities
Vietnam Agribusiness: From farm to chopsticks February 29th, 2008 
goods. What’s more, brand-aware Vietnamese consumers are buying Vietnamese 
products; five of the ten fastest growing brands were Vietnamese in 2007. 
Figure 16. Top 10 growth categories 
(value growth % 2007 vs. 2006) 
Figure 17. Top 10 fastest growing brands 
82% 
68% 
59% 57% 
53% 
51% 
46% 45% 
36% 
32% 
90% 
80% 
70% 
60% 
50% 
40% 
30% 
20% 
10% 
0% 
Ready-to-drink tea 
Milk Pasterizeed 
Tonic drink 
Razor 
Insect trap 
Toner/ Astringent 
Sun protection 
Adult diaper 
Ice cream 
Milk powder for infant 
17.0% 
11.4% 
10.3% 
7.9% 7.7% 7.4% 
6.4% 
5.6% 
5.1% 4.7% 
18.0% 
16.0% 
14.0% 
12.0% 
10.0% 
8.0% 
6.0% 
4.0% 
2.0% 
0.0% 
Khong do 
RTD Tea 
(THP) 
Vinamilk 
Ice 
cream 
Trang 
Tien Ice 
Cream 
Sting 
(Pepsi) 
Maggi 
(Soya 
sauce) 
C2 (RTD) Tw ister 
(Pepsi) 
Vinh Hue 
(Soya 
Milk) 
Chinsu 
(Soya 
sauce) 
Aji-Ngon 
(MSG) 
Source: TNS Worldpanel Source: TNS Worldpanel 
11 Horizon Securities
Vietnam Agribusiness fast facts 
9 Vietnam ranks first in export of 
pepper, second in rice, coffee, 
cashew nuts, and top-five of 
natural rubber and seafood. 
9 Rice productivity in Vietnam is at 
4.89 tons per hectares one of the 
highest level in the world. 
9 Average farm size in Vietnam is at 
0.5ha; three hundred times lower 
than that in the US. 
9 Paddy area has lost 6.5%, from 
7.7mln ha in 2000 to 7.2mln ha 
in 2007. 51.5% of paddy land is 
in the Mekong Delta. 
9 Since the “Economic Reform” in 
the 90s, share of agriculture in 
overall GDP has come down to 
more than 20% in 2006 from 
40% in 1990. 
9 Total investment in agriculture 
stands at 4.17% of GDP with 
public investment accounting for 
2.19% of GDP. 
9 The Government is now targeting 
3.0-3.5% growth in agriculture 
over the next 5 years. The 
agriculture sector achieved a 
4.1% CAGR over the past 10 
years. 
9 Total agro-forestry export value to 
grow at 12% pa to 2010. Export 
value in 2007 has already 
surpassed government’s targets 
for 2010. 
9 60mln or 72.88% of the total 
population reside in Vietnam’s 
rural area. Agribusiness employs 
more than 55% of the country’s 
workforce. 
9 10mln rural households, at the 
current household income level of 
US$1,000 pa, make up a sizable 
buying power. 
9 In the past 5 years, the 
Government has stipulated Law 
on Land, Law on Cooperative, Law 
of Forest Protection & 
Development and many others 
regulations on framing and 
agriculture activities. 
9 Vietnamese companies are now 
allowed to trade in commodities 
exchanges through local banks. 
9 The list of 10 sensitive products, 
governed by the state, includes 
fertilizer, rice, foodstuffs, cement, 
steel, gasoline, sugar, salt, paper 
and medicines. 
9 State finance system for 
agriculture includes Agriculture 
Bank, Bank for Public Policies and 
926 public funds. 
9 Only 50% of farmers have access 
to state credit system with 
preferential interest rates 7.2- 
8.4% pa. 
9 In 2006, the State’s spending on 
agriculture reached US$776mln, 
up 7% yoy. 
9 The Government is spending 
VND157tln (US$9.8bln) to 
improve rural infrastructure – 
irrigation, roads, electrification, 
R&D and training. 
9 Fisheries, industrial crops and 
food processing are the major 
focus areas for Vietnam’s agri-industry. 
9 Fish farming production has 
increased nine-fold since 1990. 
9 Since the beginning of 2007, 
exported rice and coffee prices 
have risen 40% and 32% 
respectively. 
9 Price of rice increases 2x-3x along 
the supply chain due to poor 
infrastructure, inadequate storage 
and excessive intermediation. 
9 Vietnam’s beer sales totaled 
US$2.2bln in 2007. The alcoholic 
drink industry has grown at 10% 
CAGR in the past 5 years. 
9 Only 10% of agri-product in 
Vietnam is processed. The 
Government plan to increase the 
figure to 20% by 2010. 
9 Food processing makes up 8.1% 
of industrial output and has been 
growing at 13% CAGR in the past 
5 years. 
9 Vietnam’s food retailing sector is 
a US$10bln, growing at 11% 
CAGR in the past 5 years. 
9 Around 76mln (90%) Vietnamese 
people still shop at traditional wet 
market and groceries. 
9 Co-op Mart is the leader in the 
retailing business with 27 
supermarkets and plans to 
expand to 100 locations by 2010. 
9 Metro Cash&Carry, BigC, Parkson, 
Lotte Department, Dairy Farm are 
already in Vietnam. While Wal- 
Mart, Carrefour have Vietnam in 
their expansion plans. 
9 There are 36 listed companies in 
the agribusiness sector, on Ho Chi 
Minh Stock Exchange and Ha Noi 
Trading Center. 
12 Horizon Securities
Vietnam Agribusiness: From farm to chopsticks February 29th, 2008 
Figure 18. Vietnam agriculture GDP to total GDP Figure 19. Vietnam agriculture output 
1,200,000 
1,000,000 
800,000 
600,000 
400,000 
200,000 
- 
1990 
1991 
1992 
1993 
1994 
1995 
1996 
1997 
1998 
1999 
2000 
2001 
2002 
2003 
2004 
2005 
2006 
Total GDP (Bln VND) 
45% 
40% 
35% 
30% 
25% 
20% 
15% 
10% 
5% 
0% 
% Agricul ture, forestry and fishery to GDP 
70,000 
60,000 
50,000 
40,000 
30,000 
20,000 
10,000 
0 
1990 
1991 
1992 
1993 
1994 
1995 
1996 
1997 
1998 
1999 
2000 
2001 
2002 
2003 
2004 
2005 
2006 
Food Vegetable 
and bean 
Industrial 
crop 
Fruit crop 
Source: GSO Source: GSO 
Figure 20. Vietnam agriculture export mix Figure 21. Vietnam agriculture export vs. total 
export 
Fishery products 
Wood and wooden 
products 
Vegetables & fruit 
Other 
Rice 
Rubber 
Coffee 
35,000 
30,000 
25,000 
20,000 
15,000 
10,000 
5,000 
0 
1995 1996 1997 1998 1999 2000 2001 2002 2003 2004 2005 
Mi l l i o n U SD 
Total Agri Export Total Export 
Source: GSO Source: GSO 
Figure 22. World arable land per capita 
Figure 23. Vietnam arable land for paddy 
800 
700 
600 
500 
400 
300 
200 
100 
0 
Oceania North America Europe South 
America 
Sub-Saharan 
Africa 
Middle East & 
North Africa 
Central 
America & 
Caribbean 
Vietnam 
Popul a ti on (Mi l l i on) 
1.8 
1.6 
1.4 
1.2 
1.0 
0.8 
0.6 
0.4 
0.2 
0.0 
Hecta r es o f a rabl e l a nd per capi ta 
Population Arable Land per capita 
9,000.0 
8,000.0 
7,000.0 
6,000.0 
5,000.0 
4,000.0 
3,000.0 
2,000.0 
1,000.0 
- 
1990 
1991 
1992 
1993 
1994 
1995 
1996 
1997 
1998 
1999 
2000 
2001 
2002 
2003 
2004 
2005 
2006 
2007 
thousand ha 
Source: Earthtrends Source: GSO 
Figure 24. Vietnam arable land for perennial 
industrial crops 
Figure 25. Vietnam arable land for annual 
industrial crops 
900 
800 
700 
600 
500 
400 
300 
200 
100 
0 
1990 1995 1996 1997 1998 1999 2000 2001 2002 2003 2004 2005 2006 2007E 
Thousand ha 
Sugar-cane Cotton Jute Sedge Peanut Soya-bean Tobacco 
1,800 
1,600 
1,400 
1,200 
1,000 
800 
600 
400 
200 
0 
1990 1991 1992 1993 1994 1995 1996 1997 1998 1999 2000 2001 2002 2003 2004 2005 2006 
Thousand ha 
Tea Coffee Rubber Pepper Cashew nut Coconut 
Source: GSO Source: GSO 
13 Horizon Securities
Vietnam Agribusiness: From farm to chopsticks February 29th, 2008 
III. Listed agribusiness 
Of the 271 listed companies in 
Vietnam, there are currently 36 
companies involved in the 
agribusiness value-chain. 
Agribusiness in Vietnam’s 
capital markets accounts for 
more than 18% of the total 
market capitalization. In 
addition, of the thirty largest 
market caps, agribusiness is 
the third most predominant 
industry after real estate and 
construction, and financial 
services. Given the sector’s 
significant contribution to 
Figure 26. HRS Agri-Index3 
200 
180 
160 
140 
120 
100 
80 
60 
40 
20 
0 
1/07 
2/07 
3/0 7 
4/07 
5/07 
VN-Index_adj HASTCI_adj AGRI-Index_adj 
6/07 
7/07 
8/07 
9/07 
10/07 
11/07 
12 /07 
1/08 
2/08 
Source: HOSE, HASTC, Horizon Securities 
Vietnam’s GDP, we built a listed shares market cap weighted agribusiness index to 
track the performance of the companies involved along the food value-chain. 
There are four parts to the agribusiness value-chain; farm inputs, production, 
processing, and distribution/marketing. Most of the listed companies are mainly 
processors with some level of upstream and possibly downstream integration. 
Horizon Securities believes that as a leading commodities exporter Vietnam will face 
a host of challenges and opportunities from the current dynamics in the global 
agribusiness sector. Horizon Securities has sought out the listed agribusiness 
companies and has highlighted some of them in this report. 
Figure 27. HRS Agri-index covered stocks: Valuation comparables 
Net sales EBIT % yoy EBIT % yoy EBIT % yoy OPM 
Sales growth 
2Y-CAGR 
FY05 FY06 FY07 FY05 FY06 FY07 FY07 
Ticker Company name Subsector 
DPM.HM PVFCCo Fertilizer (urea) 2,537,555 3,050,829 3,779,038 22% 7 90,106 N/A 9 19,765 16% 1 ,269,695 38% 34% 
HSI.HM MF JSC Fertilizer (NPK) 137,778 389,476 656,894 118% 5 ,832 N/A 26,911 361% 5 6,200 109% 9% 
TSC.HM TSC Fertilizer (trading) 879,702 1,138,957 1,375,090 25% 4 ,620 179% 1 2,511 171% 8 6,267 590% 6% 
HAI.HN HAI Crop protection 358,864 415,502 496,545 18% 4 4,600 N/A 29,648 -34% 4 6,080 55% 9% 
NSC.HM NSC Seed 102,579 96,552 140,388 17% 8 ,957 N/A 6,062 -32% 1 2,708 110% 9% 
SSC.HM SOUTHERN SEED Seed 127,919 129,861 155,857 10% 2 9,280 10% 2 4,654 -16% 2 4,957 1% 16% 
TRI.HM TRIBECO SAIGON Berverage 306,451 293,779 384,639 12% 7 ,095 -24% 1 6,095 127% 1 7,421 8% 5% 
SCD.HM CHUONG DUONG BEV. Berverage 148,021 194,485 238,894 27% 1 7,932 N/A 18,625 4% 2 0,238 9% 8% 
VTL.HN THANG LONG JSC Berverage 7 2,116 63,390 75,164 2% 1 1,696 13% 1 1,099 -5% 1 0,782 -3% 14% 
VDL.HN LAM DONG FOOD Berverage 1 36,174 130,238 151,845 6% N/A N/A N/A N/A 1 0,398 N/A 7% 
IFS.HM INTERFOOD Berverage 507,213 641,686 723,272 19% 6 7,913 N/A 71,363 5% 8 6,808 22% 12% 
VNM.HM VINAMILK Dairy 5,638,784 6,619,102 6,821,864 10% 5 24,448 2% 5 94,186 13% 6 71,963 13% 10% 
HNM.HN HANOIMILK Dairy 288,076 327,972 323,829 6% 2 6,411 N/A 18,149 -31% 2 0,231 11% 6% 
KDC.HM KINH DO CORP Confectionery 798,617 998,149 1,233,119 24% 1 11,219 10% 1 31,881 19% 1 56,464 19% 13% 
NKD.HM NORTH KINH DO Confectionery 354,789 419,429 561,580 26% 4 3,824 49% 5 5,506 27% 6 9,406 25% 12% 
BBC.HM BIEN HOA CONF. Confectionery 285,362 341,331 453,975 26% 1 8,854 24% 1 9,022 1% 2 2,998 21% 5% 
HHC.HN HAI HA CONF. Confectionery 330,058 325,830 341,248 2% 1 6,800 N/A 18,957 13% 2 2,975 21% 7% 
ABT.HM BENTRE AQUATEX Aquaculture 282,433 331,215 429,706 23% 9 ,996 79% 2 6,627 166% 3 2,397 22% 8% 
ICF.HM INVESTMENT COM. Aquaculture 281,202 283,154 326,025 8% 1 2,441 N/A 23,070 85% 2 5,122 9% 8% 
ANV.HM NAM VIET CORP Aquaculture 1,212,316 2,707,076 3,193,437 62% N/A N/A 2 99,334 N/A 3 90,237 30% 12% 
MPC.HM MINH PHU SEAFOOD Aquaculture 2,027,425 1,352,531 N/A N/A N/A N/A 98,861 N/A N/A N/A N/A 
VHC.HM VINH HOANG Aquaculture 507,014 1,516,245 1,789,557 88% 6 ,903 N/A 98,579 1328% 1 42,636 45% 8% 
AGF.HM AN GIANG FISH. Aquaculture 786,182 1,190,906 1,233,734 25% 3 0,484 8% 5 2,339 72% 4 6,277 -12% 4% 
ACL.HM CUU LONG FISH. Aquaculture 88,475 311,275 537,449 146% N/A N/A 4 1,022 N/A 6 5,271 59% 12% 
TS4.HM SEAFOOD NO.4 Aquaculture 83,880 151,827 172,904 44% 3 ,623 -13% 6 ,546 81% 7 ,850 20% 5% 
SJ1.HM SEAFOOD NO.1 Aquaculture 130,781 147,895 145,553 5% 5 ,650 N/A 4,980 -12% 6 ,240 25% 4% 
FMC.HM SAO TA FOOD Aquaculture 970,807 925,197 999,764 1% 3 7,581 N/A 33,782 -10% 3 6,511 8% 4% 
FBT.HM FAQUIMEX Aquaculture 373,460 457,661 N/A N/A 21,331 N/A 35,912 68% N/A N/A N/A 
LAF.HM LAFOOCO LONG AN Aquaculture 784,550 699,904 626,503 -11% 1 7,390 -55% ( 14,139) -181% 3 5,453 351% 6% 
SGC.HM SA GIANG IM. Food processor 98,100 88,489 118,917 10% 1 5,013 N/A 16,840 12% 1 7,671 5% 15% 
SAF.HM SAFOCO Food processor 203,970 272,065 333,205 28% N/A N/A 8 ,411 N/A 1 0,429 24% 3% 
CAN.HM HALONG FOOD Food processor 191,255 204,206 309,086 27% 1 0,647 84% 1 1,289 6% 1 3,074 16% 4% 
TAC.HM TUONG AN OIL Cooking oil 1,181,594 1,515,469 2,554,229 47% 2 2,333 N/A 28,868 29% 1 02,790 256% 4% 
LSS.HM LAM SON SUGAR Sugar 6 51,976 626,661 813,958 12% N/A N/A 1 15,718 N/A 1 18,805 3% 15% 
BHS.HM BIEN HOA SUGAR Sugar 540,656 766,123 643,945 9% 5 3,292 22% 6 9,429 30% 4 4,783 -35% 7% 
SBT.HM BOURBON TAYNINH Sugar 629,791 679,860 674,272 3% 1 19,365 173% 1 73,847 46% 1 49,109 -14% 22% 
Source: Horizon Securities, Reuters, company’s report 
3 Horizon Securities clients can contact their account manager to get more information on how they can 
invest in the same proportions set out in any of the HRS Indices. 
14 Horizon Securities
Vietnam Agribusiness: From farm to chopsticks February 29th, 2008 
Figure 28. Vietnam: Agribusiness value chain 
Farm Input Production Processing Distribution 
• Fertilizers • Plantation • Meat processing • Logistics 
• Crop protection • Crop production • Aquaculture • Strorage 
• Seed • Fishery • Confectionary • Suppermarkets 
• Machinery • Livestock • Sugar • Hypermarkets 
DPM Petrovietnam 
HSI General Fertilizer 
TSC Techno–Agricultural 
HAI H.A.I JSC 
NSC National Seed 
SSC Southern Seed 
ABT Ben Tre Aquaproduct 
ICF Investment Commerce 
ANV Nam Viet Fisheries 
MPC Minh Phu Seafood 
VHC Vinh Hoan 
AGF An Giang Fisheries 
ACL Cuu Long Fisheries 
TS4 Seapriexco 4 
LSS Lam Son Sugar 
BHS Bien Hoa Sugar 
TRI Tribeco Sai Gon 
SCD Chuong Duong Beverage 
VTL Thang Long Wine 
VDL Lam Dong Foodstuffs 
KDC Kinh Do Corp. 
NKD North Kinh Do 
BBC Bien Hoa Confectionary 
SBT Sucrerie De Bourbon TN 
HHC Hai Hai Confectionary 
SJ1 Seafood No. 1 
FMC Sao Ta Food 
FBT Ben Tre Forestry 
LAF Lafooco Long An 
IFS Interfood 
SGC Sa Giang Import Export 
SAF SAFOCO 
CAN Canfoco Ha Long 
TAC Tuong An Oil 
VNM Vietnam Diary Products 
HNM Ha Noi Milk 
Source: Horizon Securities 
15 Horizon Securities
Vietnam Agribusiness: From farm to chopsticks February 29th, 2008 
IV. Farm input 
The farm input segment includes companies engaged in fertilizers, crop protection 
(such as pesticides, fungicides, and insecticides), farming machinery, seed, and feed. 
These products help to enhance the productivity of land, crops, and animal 
husbandry. The key drivers for this sector involve the increasing concerns for higher 
productivity yields resulting from rising food demand against depleting arable land. 
We believe the rising income in Vietnam’s rural areas will help farmers deal with the 
current rise in prices of farm inputs. 
Figure 29. Listed companies in farm input sector 
Ticker Name Sector 
Market Cap. 
(VND’mln) 
Net sales 
(VND’mln) 
EBITDA 
Margin 
The key drivers for this sector 
involve the increasing concerns 
for higher productivity yields 
resulting from rising food 
demand against depleting 
arable land 
Net Profit 
Margin ROA ROE 
DPM.HM PVFC Urea fertilizer 21,470,000 3,779,038 NA 35.0% 21.3% 29.3% 
HSI.HM General Fertilizer NPK fertilizer 275,000 656,894 NA 3.8% 5.2% 31.8% 
TSC.HM TSC Fertilizer trading 694,128 1,375,090 NA 5.0% 17.8% 57.3% 
HAI.HN HAI Crop protection 558,600 496,545 9.5% 10.3% 14.3% 30.2% 
NSC.HM National Seed Seed 123,840 140,388 9.9% 9.6% 12.6% 20.2% 
SSC.HM Southern Seed Seed 421,000 155,857 NA 14.1% 14.8% 18.1% 
Source: Horizon Securities, company’s data 
4.1 Fertilizer sector in Vietnam: relying heavily on imports 
Increasing at a 4.5% CAGR over the past 5 years, by 2007 Vietnam’s aggregate 
fertilizer demand had reached 6.2 million tons. Due to insufficient domestic 
production capacity, the country has to import more than 61% of the yearly demand, 
making it one of the biggest fertilizer importers in the world. In order to encourage 
local production, the government has accorded a number of favorable policies to 
fertilizer producers, such as low VAT (5%), subsidies on transportation and raw 
material costs, and privileged access to natural resources. 
Since fertilizer is on the list of the ten key products4 under the government’s “price 
management”, the government “recommends” a selling price range to local 
producers. The end result is that fertilizer prices in Vietnam have not moved in step 
with the world prices. In 2007, as the international urea prices had surged by 104% 
year-over-year, local prices increased by just about 20%. 
Although revenues have been capped, local producers are able maintain their profit 
margins thanks government subsidies and low raw material costs. As Vietnam fulfills 
its WTO’s agreements and more state-own enterprises are privatized, we expect less 
price controls and subsidies from the state. 
Figure 30. Local fertilizer production Figure 31. Vietnam’s fertilizer import 
3,000 
2,500 
2,000 
1,500 
1,000 
500 
- 
10% CAGR 
2000 2001 2002 2003 2004 2005 2006 2007 
4,500 
4,000 
3,500 
3,000 
2,500 
2,000 
1,500 
1,000 
500 
- 
Vietnam has to import more 
than 61% total fertilizer 
consumption… making it 
biggest fertilizer importers in 
the world. 
Phu My Fertilizer 
commenced operation 
2001 2002 2003 2004 2005 2006 2007 
'000 tons 
Urea (N) Phosphate (P) Potash (K) NPK Others 
Source: Vietnam Fertilizer Association Source: GSO 
4 10 products include: fertilizer, food, food stuffs, cement, steel, gasoline, sugar, salt, paper and medicines 
16 Horizon Securities
Vietnam Agribusiness: From farm to chopsticks February 29th, 2008 
Urea market (N) 
The state monopolizes Vietnam’s urea market. Although there are hundreds of 
fertilizer trading companies, there are only two urea producers; Petrovietnam 
Fertilizer & Chemicals Plc. (PVFC), listed on HOSE, and Habac Nitrogenous Fertilizers 
& Chemical Ltd. (HANICHEMCO), which is a subsidiary of the state-owned 
conglomerate, Vietnam National Chemical Corporation (VINACHEM)5. 
In 2007, Vietnam consumed more than 1.7mln tons urea, 45% of which was 
imported, mainly from China. The Ministry of Agriculture and Development estimates 
urea demand to increase by 8% per year to 2.1mln tons by 2010. Because demand 
still outstrips the domestic supply, we believe that in the short-run, local prices will 
continue to increase despite the government’s effort to minimize the increase. 
Moreover, China, the largest fertilizer exporter to Vietnam, in a bid to ensure supply 
to its farmers, decided last month to raise export tariffs on urea fertilizer. 
By 2010, the Hanoi plans to establish two more state-owned fertilizer companies 
with a total built up production capacity of 1.3 million tons of urea per year, hence 
providing enough supply to the market. 
Figure 32. Fertilizer prices Figure 33. Local supply vs. demand 
600 
500 
400 
300 
200 
100 
- 
Sep-02 
Dec-02 
Jun-03 
Sep-03 
Mar-03 
Jun-04 
Sep-04 
Mar-04 
Dec-03 
Jun-05 
Sep-05 
Dec-04 
Mar-05 
Jun-06 
Sep-06 
Mar-06 
Dec-05 
Jun-07 
Sep-07 
Dec-06 
Mar-07 
Dec-07 
VN UREA WORLD UREA 
3,000 
2,500 
2,000 
1,500 
1,000 
500 
- 
(500) 
(1,000) 
(1,500) 
…urea demand is estimated to 
increase by 8% CAGR to 
2.1mln tons by 2010 
2008 2009 2010 
Total Demand Total Local Supply Shortage/Surplus 
Source: Reuters, Price Department Source: Vietnam Fertilizer Association 
Figure 34. Market share 2007 Figure 35. Market share 2010 
Phu My Fertilizer 
45% 
Ha Bac Fertilizer 
10% 
Import 
45% 
Phu My Fertilizer 
37% 
Ha Bac Fertilizer 
Ca Mau Fertilizer 
Ninh Binh Fertilizer 7% 
23% 
33% 
Source: Horizon Securities, Vietnam Fertilizer Association Source: Horizon Securities, Vietnam Fertilizer Association 
PVFC Fertilizer (ticker: DPM.HM) opened its urea production plant in 2004, and has 
been listed on HOSE since November 2007. With its current capacity of 740,000 
tons per year, PVFC accounts for more than 45% of total urea consumption in 
Vietnam. To secure its position in the market, PVFC has recently invested US$50 
million in a new production facility, which will add 125,000 tons to PVFC’s total 
production in 2010. 
5 www.vinachem.com.vn. VINACHEM is the largest corporation in the chemical industry in Vietnam, owning 
more than 40 companies in fertilizer, crop-protection, rubber, oil refinery, and various chemical sectors. 
17 Horizon Securities
Vietnam Agribusiness: From farm to chopsticks February 29th, 2008 
Raw material for nitrogen fertilizer is abundant 
The main raw materials for urea production are coal or natural gas, which contribute 
more than 90% of total production costs. For economic and environmental reasons, 
natural gas is the feedstock of choice. 
According to Cedigaz, Vietnam has around 400 billion cubic meters of proven natural 
gas reserves. Current production level is about 7 billion cubic meters per annum. The 
country has discovered four gas fields, including the Bach Ho Oil Field, Nam Con Son 
Gas Basin, May Lay Tho Chu Basin and Song Hong (Red River) Basin. Beside these 
projects, many companies are carrying exploration activities to prove more gas 
reserves offshore Vietnam. 
PVFC is using natural gas in 
the production while 
HANICHEMCO, since 1960, 
has been using coal-based 
production. PVFC’s natural 
gas consumption is currently 
around 53,000-54,000 metric 
tons per hour, which it gets 
from the Bach Ho (White 
Tiger) Oil Field and Nam Con 
Son Gas Project. The company 
has secured a long-term 
agreement with the state to 
purchase natural gas at 
US$2.2 per million BTU until 
2012, and US$3.6 per million 
Figure 36. Vietnam gas reserve and production 
8.0 
7.0 
6.0 
5.0 
4.0 
3.0 
2.0 
1.0 
0.0 
36% CAGR 
1991 1992 1993 1994 1995 1996 1997 1998 1999 2000 2001 2002 2003 2004 2005 2006 
billion cubic meter 
450 
400 
350 
300 
250 
200 
150 
100 
50 
0 
Gas reserve Gas production 
Source: Horizon Securities 
BTU thereafter. 
Other types of fertilizers – Phosphate (P2O2), Potash (K2O), NPK 
Vietnam is self-sufficient for the production of super-phosphate (OSP); but due to the 
scarcity of phosphate and salt deposits, the country is unable to produce DAP and 
potash fertilizers. Annual consumption of these fertilizers has reached more than 2 
million tons; mainly imported from China. The Ministry of Planning and Investments 
forecasts that demand will continue growing at 3% to 5% annually until 2010. 
The state-owned Vinachem operates thirteen fertilizer companies, which dominate 
60% of the NPK processing market. Other major producers in this sector include the 
General Biochemistry Fertilizer (ticker: HSI.HM), the Vietnam-Japan Fertilizer (Japan), 
the Tan Hung Fertilizer Ltd., and the Proconco JV (France). 
The General Biochemistry Fertilizer Co. (ticker: HSI.HM) recently expanded its total 
production to 480,000 tons per year, enough to cover 15% of the domestic NPK 
demand. Revenue in 2007 reached US$41mln, up 86% yoy. Management 
announced its intention to move into other agrochemical markets and has invested 
US$0.72 million in a new insecticide factory. The company also plans to invest over 
US$40 million into two infrastructure projects; an industrial park and a port. 
The Techno-Agricultural Supplying Co. (ticker: TSC.HM) is a fertilizer trading company. 
As such it imports more than 10% of Vietnam’s total fertilizer imports. Sales for 
2007, reached US$86 million up 21% over the previous year. Management decided 
to establish a new securities brokerage house in the Mekong Delta region, the Can 
Tho Securities JSC, which will start operations in the first quarter of 2008. 
4.2 Crop protection 
The crop protection industry includes pesticides, fungicides, and insecticides. Rising 
health and environmental concerns, and tougher regulations over the use of these 
chemicals have caused world crop protection sales to drop by 2.5% to US$30.4 
billion. The most significant reduction in crop protection sales was in the NAFTA 
region loosing 5.3%, followed by Asia, which fell by 4.1%. Global growth expectations 
remain low at 1-2% over the next five years. 
Vietnam has around 400 billion 
cubic meters of proven natural 
gas reserves 
In Vietnam, PVFC is using 
natural gas in the production 
while HANICHEMCO, since 
1960, has been using coal-based 
production 
…annual consumption is 
around 2mln ton, mainly 
imported from China… demand 
continues to grow at 3-5% 
annually to 2010. 
18 Horizon Securities
Vietnam Agribusiness: From farm to chopsticks February 29th, 2008 
Every year Vietnam consumes more than 9 million tons of crop protection chemicals, 
mainly pesticides. Vietnam’s Plant Protection Department estimates that more than 
95% of farmers excessively use pesticides. In the context of the tainted food 
scandals in China, the misuse of chemical pesticides may have a serious detrimental 
effect on Vietnam’s agri-exports. Industry analysts estimate that consumption of 
chemical crop protection products in Vietnam will gradually decrease in the future. 
The key local players in the industry include; H.A.I JSC (ticker: HAI.HM), An Giang 
Pesticide (AGPPS), Sai Gon Pesticide (SPC), the Microbiological & Chemical Industry 
JSC (BICICO) and Vietnam Pesticide JSC (VIPESCO). 
HAI has a very small production capacity; it mainly buys pesticides in bulk then re-packages 
in bottles and distributes them to the market. The company estimates it 
holds about 10% market share. In 2007, HAI sales reached VND496.5 billion (US$31 
million), representing a 19.5% increase over the previous year. 
4.3 Opportunities for the seed sector 
According to Phillip McDougall, in 2006 the value of the market for agriculture 
biotechnology based products, which currently comprises sales of seed of herbicide 
tolerant (HT) and insect resistant (IR) crops, continued to advance by 14.2% to 
US$6,050 million. The market for biotech crops is expected to continue to expand, 
both through the adoption of advanced traits and uptake in further country markets, 
particularly in Asia. The Vietnamese government allows local and foreign companies 
to sell genetically modified seeds as long as they comply with the state regulations. 
In Vietnam, there are 
more than 65 domestic 
and foreign companies 
operating in the seed 
sector; most of them 
are either state-owned 
companies or 
governmental research 
centers. Global industry 
leaders have made 
headway into the 
country; namely Bayer 
Cropscience, Monsanto, 
and Syngenta. 
Figure 37. Growth of the biotech crop market in the world 
7,000 
6,000 
5,000 
4,000 
3,000 
2,000 
1,000 
0 
1996 1997 1998 1999 2000 2001 2002 2003 2004 2005 2006 
$ million 
Source: World Fertilizer Association 
Of the domestic companies, only three have the capabilities to produce seeds 
themselves. Two of these companies are listed; they are the National Seed JSC 
(ticker: NSC.HM) and the Southern Seed JSC (ticker: SSC.HM). 
Established in 1968, the National Seed JSC currently operates three production 
plants, and an experimental farm. The company’s main products include rice, maize, 
vegetable, and sweet potato seeds. Its main markets are in the North of Vietnam and 
Laos. Total revenue in 2007 was VND140.4bln (US$8.7mln), a 45.4% increase over 
2006. The company recently raised capital to acquire other domestic seed 
companies, and to invest in an industrial park in the North of Vietnam. 
The Southern Seed Co. produces rice, maize, beans, bitter melons, cucumbers and 
watermelons seeds mainly for the South of Vietnam. Total revenue in 2007 was 
VND155.9bln (US$9.7mln), up 20.0% year-over-year. The company also has 
announced significant investments to acquire a research center and two 
experimental farms. Management recently announced the acquisition of Ha Tay Seed 
Co., and the development of a seed production facility in Ha Noi. The Company also 
acquired a 49% stake in an office building in HCMC. 
In Vietnam, there are more 
than 65 companies operating 
in the seed industry; most of 
them are either state-owned 
companies or governmental 
research center. 
19 Horizon Securities
Vietnam Agribusiness: From farm to chopsticks February 29th, 2008 
Figure 38. List of registered seeds in Vietnam 
Type Code Companies 
Paddies LC93-1 Syngenta Vietnam 
Maize WAX44 Monsanto Thailand 
Maize DEKALB 979 Monsanto Thailand 
Maize DEKALB 959 GM Paddies Research Center 
GM Paddies HYT 83 GM Paddies Research Center 
Paddies HYT 100 Thai Agriculture Department 
Paddies PRACHIBURI Quoc Hao Co. (China) 
GM Paddies Kim Uu 75 Thai Binh Seed 
Paddies TBR-1 Luong Nong Co. (China) 
Maize LNS 222 Agriculture University of Vietnam 
Paddies Huong Com Southern Seed (SSC) 
Maize MX10 Southern Seed (SSC) 
Paddies N46 Agriculture Development Center 
GM Paddies CNR36 High-tech Agriculture Co. (China) 
GM Paddies D ưu 725 Quoc Hao Co. (China) 
Paddies Nghi Huong Uu 725 Quoc Hao Co. (China) 
Peanut TB25 Thai Binh Seed 
Paddies TBR 18 Thai Binh Seed 
Paddies BC15 Thai Binh Seed 
Paddies Thuc Hung 6 Thuc Hung Co. (China) 
Paddies B-TE 1 BAYER Cropscience AG 
Paddies Ha Uu 108 Vietnam-China Co. 
Paddies KOSHIHIKARI H3 HONDA Motor Co. 
Maize NK 4300 Syngenta Vietnam 
Maize NK 67 Syngenta Vietnam 
Maize NK 66 Syngenta Vietnam 
Maize DKC 9301 Monsanto Thailand 
GM Paddies Khang Dan National Seed (NSC) 
Source: Horizon Securities, VSTA 
4.4 Farming machinery 
There are no listed companies in this segment. The domestic production is still 
dominated by the state-owned Vietnam Engine and Agriculture Machinery 
Corporation (VEAM), and 15 of its subsidiaries. Some of VEAM’s companies have 
already been privatized. 
The Agriculture Production Department of Vietnam estimates that the current 
machinery utilization rate in agriculture is less than 30%. Prices for agriculture 
equipments are still out of reach for many farmers in Vietnam; a tractor costs up 
VND100 million (US$6,250) while a harvester sells for VND20 million (US$1,250). 
Moreover, the country-wide average farm size of 0.5 hectares, coupled with the fact 
that many farms hold two to five plots of land scattered in different locations, deter 
household farms from buying expensive machinery. 
Greater land consolidation, increasing urbanization, and the rural exodus to big cities 
will drive the need for greater mechanized farming. We believe the rise of industrial 
farming and co-operatives holding larger plots of land will trigger growth in machinery 
usage, while better access to bank financing and economies of scales will make 
farming machinery more affordable to farmers. 
The Ministry of Industry estimates that total farming machinery production will grow 
at an average 12% per year to reach VND3,280bln (US$205mln) by 2015. Country-wide 
as of 2007, there are 145,805 tractors, 793,400 water pumps, 288,400 rice 
threshers and 257,500 boats. The Ministry of Industry expects that by 2015 Vietnam 
will need 830,565 tractors, 12,450 harvesting machines, 4,350,570 water pumps 
and 525,844 boats. 
Current machinery utilization 
rate in agriculture is less than 
30%. 
…we believe there will be 
increasing demand for tractors, 
pumps, planting and harvesting 
machine 
20 Horizon Securities
Vietnam Agribusiness: From farm to chopsticks February 29th, 2008 
4.5 Animal feed 
The Livestock Department of Vietnam estimates there are 241 feed trading and 
manufacturing companies in Vietnam (82.2% local, 13.7% foreign invested and 4.1% 
joint venture companies), none of which are listed. The leading industry players are 
the large global agribusiness companies, namely Cargill (US), CP Group (Thailand), 
Proconcon (France) and Uni-President (Taiwan). 
To produce commercial animal feed, Vietnam has to rely on imported corn since local 
corn production is insufficient and local ingredients are usually more expensive than 
imported ones. The animal feed industry is the driver of corn consumption in 
Vietnam; feed accounts for about 80% of total corn consumption in the country. 
Vietnam produces around 10 million tons of feed annually, with only 33% 
commercially manufactured. 
To feed the livestock that will supply Vietnam’s growing demand for meat, feed grain 
production will have to be increased. The Livestock Department of Vietnam believes 
that by 2010, total demand for animal feed will reach 16-17 million tons per year. 
V. Resource producers 
5.1 Crop production: Opportunities for large-scale farming enterprises 
There are no listed companies in this sector; most players are cooperative or state-owned 
companies. Key players in this industry include the Vietnam Northern Food 
Corporation (Vinafood 1), Vietnam Southern Food Corporation (Vinafood 2), Song Hau 
Food Processing JSC (Sohafood), Codo State Farm Export-Import (Codofarm), 
VinhLong Cereal and Food Import-Export JSC (Vinhlong Food), An Giang Import-Export 
Co., Gentraco Feed JSC (Gentraco), Tien Giang Food Co. (Tigifood), Long An Food Co. 
(Longanfood), An Giang Agriculture and Foods Import-Export Co. (An Giang Afiex) and 
Dong Thap Foods - Agriculture Co. (Dargrimex). 
Fragmented agriculture 
One of the most important undertakings of the state, in regards to agriculture and 
food safety, has been to increase rice quality and yields. Through successful seed 
management and selection, Vietnam has been able to develop new, pest-resistant, 
rice varieties which have significantly increased the country’s yields per hectare. 
Today, Vietnam’s paddy yields are above world standards. Though the land allocated 
to rice culture has diminished, the rice yield and production has increased. Today’s 
rice production is of better 
quality and higher efficiency 
than ever and production has 
been increasingly tied to the 
market requirements. In 
addition, the country has been 
able to increase its rice 
exports to approximately 20% 
of its total rice production. 
At 0.1 ha per capita, Vietnam 
has one of the lowest arable 
land per capita ratio in the 
world. In addition, total arable 
land in Vietnam has been 
under pressure from greater 
Figure 39. World paddy yield 
10,000 
8,000 
6,000 
4,000 
2,000 
- 
Egypt US China Vietnam World India 
Paddy (k g/h a ) 
Source: FAO 
industrialization and urbanization. Between 2000 and 2006, the total area allocated 
to rice cultivation decreased by almost 6.5%, as farmers allocate land to more 
valuable crops. 
Over 70% of Vietnam’s population lives in rural areas, and there are more 10 million 
household farms throughout the country. The country-wide average arable land size 
per farm is 0.5 ha. Farms in the Mekong Delta are bigger than in the North, with an 
average size of 1.2 ha. In addition, the degree of fragmentation in the South is less of 
a problem, with many farmers having only one plot. Household farms are considered 
21 Horizon Securities
Vietnam Agribusiness: From farm to chopsticks February 29th, 2008 
the basic economic farm unit. Small farm size and fragmentation of land are some of 
the main obstacles to increasing productivity and economies of scale in Vietnam. 
Emerging trends from land reforms 
Thanks to more flexible land reforms, which have facilitated leasing of land, allowed 
larger holding size and provided longer use rights, a trend towards greater land 
consolidation and accumulation has emerged. There is evidence that a “land market” 
has emerged in every region of Vietnam with activities including renting and leasing 
land, lending and borrowing land, “‘buying”’ and “selling” Land Use Rights, land 
exchange and bidding for land. 
Additionally, recent government policies support the notion of larger farms that will 
permit the concentration of land and capital. There are currently about 113,000 
commercial farms with an average land area of 5 hectares throughout the country, 
this represent an 86% increase over 2001 figures. We believe this is an important 
development which will facilitate the development of larger industrial farms. 
5.2 Contract farming6 
Although first attempts of contract farming were unsuccessful, the state has 
indicated that it supports the concept as a means to link farmers to market 
demands. Consequently, the government passed Decision 80/2002/ TTg in 2002, to 
promote the consumption of agricultural products through signed contracts between 
enterprises and farmers. 
Private involvement in contract farming is not a novelty. While success stories vary 
greatly between types of commodities and geographic localities, there have been 
some encouraging developments. According to the Ministry of Agriculture and Rural 
Development (MARD) the majority of rice, maize, sugar cane, and most other 
industrial crops output is produced under contract farming. Also, we have seen some 
companies such as Charoen Pokphand (C.P.) Group, Lam Son Sugar and Sugarcane 
Company (LSS:HM), Angimex-Kitoku JVC, Antesco already integrating upstream and 
securing with farmers timely access to raw materials. 
VI. Processing 
There are 30 listed companies involved in the processing segment of the agri-food 
value-chain. 
6.1 Dairy Products: Uptrend demand and low level of substitute 
Key players in the industry include two listed companies: Vinamilk (ticker: VNM.HM), 
and Hanoimilk (ticker: HNM.HN). Other players include Dutch Lady Vietnam, and 
some joint-ventures F&N Vietnam Foods Co., and Nestle Vietnam. 
Figure 40. Listed companies in milk sector 
Ticker Name Market Cap. 
(VNDmln) 
Net sales 
(VNDmln) 
EBITDA 
Margin Net Profit Margin ROA ROE 
HNM.HN HANOIMILK 173,418 323,829 NA 3.7% 5.0% 8.2% 
VNM.HM VINAMILK 19,981,426 6,821,864 NA 14.2% 21.6% 27.4% 
Source: Horizon Securities, company’s data 
Vietnam’s dairy consumption is one of the fastest growing food segments in the 
country. Current dairy consumption is around 9kg per annum and dairy product 
consumption has been growing at 16.3% CAGR from 2004 to 2006. Local supply 
only meets about 22% of the demand for dairy products. Vinamilk purchase about 
60% of fresh milk produced in Vietnam. Dutch Lady collects another 20% while the 
rest is bought by a number of smaller companies. Vietnam currently imports dairy 
6 Contract farming can be defined as an agreement between farmers and processing and/or marketing 
firms for the production and supply of agricultural products under forward agreements, frequently at 
predetermined prices. The arrangement also invariably involves the purchaser in providing a degree of 
production support through, for example, the supply of inputs and the provision of technical advice. The 
basis of such arrangements is a commitment on the part of the farmer to provide a specific commodity in 
quantities and at quality standards determined by the purchaser and a commitment on the part of the 
company to support the farmer’s production and to purchase the commodity. (FAO, 2001) 
Local supply only meets about 
22% of the demand for dairy 
22 Horizon Securities
Vietnam Agribusiness: From farm to chopsticks February 29th, 2008 
from various countries including, notably the United States, Australia, Korea, and the 
Netherlands. 
Figure 41. Vietnam: production of milk by province 
Unit: tons 
Year 
Provinces 
2001 2002 2003 2004 2005 
Vietnam 64,703 78,453 126,697 151,314 197,679 
Red River Delta 4,958 7,032 9,865 12,218 14,098 
North East - 33 482 2,739 6,803 
North West 4,026 4,550 5,934 7,677 7,820 
South Central Coast 365 414 670 971 739 
Central Highlands 998 1,673 2,566 3,827 4,853 
South Central Coast 
ex. HCMC 9,814 13,058 16,110 19,711 26,802 
Ho Chi Minh City 44,540 51,691 90,264 104,160 130,054 
Mekong River Delta 1,871 4,353 5,766 7,859 11,723 
Source: MARD 
Vinamilk (ticker: VNM.HM) is the leading company in the industry with 183 
distribution centers and more than 94,000 outlets throughout Vietnam. The 
company’s current capacity is 491 million litres per year. Net income in 2007 
increased 32% yoy. The company has captured 40% of the powder milk market, it 
dominates 90% of the yogurt market, and 73% of the condensed milk market. In 
October 2007, Vinamilk acquired a 55% stake in the Lam Son Dairy JSC a small dairy 
company in northern Vietnam with a capacity of 20,000 litres per year. 
Hanoimilk (ticker: HNM.HN) is the third largest dairy producer and the largest in 
northern Vietnam. The company’s total production capacity is 80 million liters per 
year. Hanoimilk focuses on producing sterilized fresh milk for children between 7–12 
years old; a market of which it holds 25-28%. Net profit in 2007 increased by 66.5% 
compared to the previous year. In August 2007, the company signed a strategic 
partnership agreement with Maeil, one of Korea’s leading dairy companies, in which 
Maeil would acquire a 10% stake in Hanoimilk. Hanoimilk’s products have recently 
been picked-up by Hapro, a state-owned retail and supermarket distribution 
business, which will distribute them in its stores. 
6.2 Sugar industry: Under government’s “price management” 
Figure 42. Listed companies in sugar sector 
Ticker Name Market Cap. 
(VNDmln) 
Vinamilk acquired a 55% stake 
in the Lam Son Dairy JSC a 
small dairy company in 
northern Vietnam 
Hanoimilk signed a strategic 
partnership agreement with 
Maeil, one of Korea’s leading 
dairy companies 
Net sales 
(VNDmln) EBITDA Margin Net Profit Margin ROA ROE 
BHS.HM BIEN HOA SUGAR 614,942 643,945 NA 8.3% 8.5% 14.6% 
LSS.HM LAM SON SUGAR 900,000 813,958 21.9% 10.0% 9.7% 14.5% 
SBT.HM SUCRERIE DE BOURBON TAY NINH 1,021,991 674,272 32.5% 28.4% 11.8% 12.6% 
Source: Horizon Securities, company’s data 
Vietnam has 37 sugar processors with a total capacity of 1.05 million tons per year. 
In 2007, local producers manufactured 0.97 million tons, about 75% of the domestic 
demand. As a result, domestic sugar production fails to meet the continuously 
increasing demand in the beverage and confectionery sectors. The country has to 
import around 0.3-0.4 million tons each year. 
23 Horizon Securities
Vietnam Agribusiness: From farm to chopsticks February 29th, 2008 
Figure 43. Sugar market is highly fragmented Figure 44. Domestic sugar price in the past 2 years 
Others, 58.6% 
Bien Hoa Sugar, 
7.6% 
Nghe An Tate & 
Lyle Sugar JV, 
7.6% 
Lam Son Sugar 
Vietnam Taiwan 
5.3% 
Nagarjuna Intl 
5.5% 
9.0% 
Sucrerie De 
Bourbon Tay Ninh, 
6.4% 
14,000 
12,000 
10,000 
8,000 
6,000 
4,000 
2,000 
- 
Jan-0 6 
Jul-06 
Apr-06 
Jan-0 7 
Oct-06 
Jul-07 
Apr-07 
VND 
Sources: Horizon Securities, VASP Sources: MARD 
The sugar industry is one the ten key industries of the state; therefore, Hanoi has 
historically imposed high import tariffs. Vietnam’s WTO engagements require the 
country to reduce sugar import tariffs. 
Figure 45. Vietnam: tariff reduction roadmap in compliance with WTO 
items 2005 2006 2007 2008 2009 2010 
Raw sugar 30% 30% 30% 20% 10% 5% 
Refined sugar 40% 40% 30% 20% 10% 5% 
Source: Horizon Securities, Vietnam Tax Authorities 
Lam Son Sugar (ticker: LSS.HM) is Vietnam’s biggest sugar producer, with two 
processing plants and a total capacity of 110,000 tons. The company controls 
approximately 9% of the market. The company secures supply of sugar cane through 
contract farming on more than 18,000 hectares. Management recently announced it 
would diversify the company’s business into banking and insurance and in setting up 
a private higher education institution. Management also intends to set up a dairy 
farm. 
Bien Hoa Sugar (ticker: BHS.HM), the second largest sugar company in Vietnam, has 
a capacity of 90,000 tons. In 2007, the company produced approximately 75,000 
tons of sugar to capture 7.6% market share. It is currently the main sugar supplier to 
the leading domestic food & beverage companies, notably, Vinamilk, Nestle, Coca- 
Cola, and Pepsi. To ensure supply of raw material, the company contracted out, a 
total area of 6,900 ha for growing sugar cane. In addition, the company owns 1,000 
ha on which it grows sugar cane for its own production. In November 2007, BHS 
successfully acquired Tri An Sugar Co. The factory has been upgraded and will be put 
into operation in early 2008. Management announced a US$62.5 million investment 
to build an integrated sugar/ethanol processing plant. The “The West Vam Co Dong 
Industrial Processing Park” will cover an area 38 hectares and include: 
• a sugar processing plant with a 6,000TMN capacity (expected to be 
completed by the end of 2009); 
• an ethanol plant with capacity of 220,000 liters per day (expected to be 
completed in 2008); 
• a furfural alcohol factory; 
• a fertilizer factory; 
• an animal feed factory; and 
• shipping docks and port facilities. 
The project began in October 2007, and Bien Hoa is currently involved in site 
clearance. 
Sucrerie De Bourbon Tay Ninh (ticker: SBT.HM) holds 6.4% of the total domestic 
sugar market. Similarly to Lam Son Sugar and Bien Hoa Sugar, the company has 
Jan-08 
Oct-07 
Lam Son Sugar controls 
approximately 9% of the 
market 
24 Horizon Securities
Vietnam Agribusiness: From farm to chopsticks February 29th, 2008 
contracted farmers over an area of 14,500 hectares; to grow sugar cane. 
Contributing 90% to total sales, the Mimosa Sugar brand is the company’s major 
source of revenue. Total revenue in 2007 rose 13% compared to 2006. Management 
plans to invest over US$65 million to build a 504 million kWh per year thermal power 
plant, and a 30 million liters per year ethanol factory. 
6.3 Confectionery: Severe competition among rivals 
Vietnam’s confectionery 
industry is extremely 
fragmented, with hundreds of 
small regional producers. 
Major players count about 30 
companies. 
Competition is intensifying as 
larger players have been 
spending heavily on 
advertising and marketing 
campaigns. Over the past five 
years, Vietnam’s confectionery 
industry has grown at an 
average rate of 7%. Driven by 
greater disposable income, 
consumption per capita 
reached 2kg per year in 2007 
Figure 46. Key player market shares 
BBC 
7.0% 
NKD 
11.0% 
HHC 
6.5% 
Others 
53.0% 
KDC 
20.0% 
IFS 
2.5% 
Source: Horizon Securities estimate 
up from 1.25kg per year in 2003. Industry sales are seasonal as consumption 
increases significantly from the Mid-Autumn Festival (September) to Vietnam’s New 
Year (late January to mid-February). 
Figure 47. Listed companies in confectionery sector 
Ticker Name Market Cap. 
(VNDmln) 
Net sales 
(VNDmln) 
EBITDA 
Margin 
Net Profit 
Margin ROA ROE 
IFS.HM INTERFOOD 195,948 723,272 15.0% 10.0% 9.7% 18.1% 
BBC.HM BIEN HOA CONFECTIONERY 894,898 453,975 7.5% 5.5% 8.0% 12.8% 
HHC.HN HAI HA CONFECTIONERY 218,453 341,248 NA 5.8% 10.9% 23.0% 
KDC.HM KINH DO CORP 6,720,952 1,233,119 15.9% 19.5% 12.0% 15.8% 
NKD.HM NORTH KINH DO 1,259,973 561,580 17.0% 14.1% 16.6% 34.4% 
Source: Horizon Securities, company’s data 
Kinh Do Corp (ticker: KDC.HM), by far the largest producer of snacks and 
confectionery products in Vietnam has 200 distributors and 65,000 retailers. The 
company manufactures a wide range of products such as cookies, cakes and snacks. 
From 2006 to 2007, KDC’s sales and net profit increased by 23.5% and 41% 
respectively. The company exports to countries in Asia, Europe and North America. In 
August 2007, Kinh Do signed a joint-venture with Cadbury to become its exclusive 
distributor in Vietnam. The company has also expanded into real estate, investing in 
and building office, apartment, and retail space. 
North Kinh Do (ticker: NKD.HM), a subsidiary of Kinh Do Corp. is the second biggest 
player in the market. With 46 distributors, 5 bakeries and more than 12,000 retail 
outlets, the company controls about 30% of the northern market. In 2007 revenue 
reached VND566 billion (US$34.75 million), increasing by 31.2% yoy. In April 2007, 
management announced that together with Tribeco, the company would establish 
North Tribeco, a beverage company focusing on the northern market. North Kinh Do 
would own 15% of the newly established North Tribeco. 
Bien Hoa Confection (ticker: BBC.HM) is the third largest confectionery company 
capable of producing 45 tons of sweets, cakes and nutritional foods and 18 tons 
malt per day. Revenue in 2007 increased 33% yoy and BBC has gained 7% of the 
domestic market and has been exporting its products to over twenty countries. 
Kinh Do signed a joint venture 
with Cadbury to become its 
exclusive distributor in Vietnam 
North Kinh Do controls about 
30% of the northern market 
25 Horizon Securities
Vietnam Agribusiness: From farm to chopsticks February 29th, 2008 
Hai Ha Confectionery (ticker: HHC.HN) is a large confectionery in North of Vietnam 
with total capacity of 70 tons per day. In order to increase its output and expand its 
market share, the company has invested close to US$1.75 million in new machinery 
and new production lines. HHC’s net income in 2007 jumped 31% to VND19.7 billion 
(US$1.23 million). 
6.4 Aquaculture processing: Vietnam’s fourth largest income 
Aquaculture is the country’s fourth largest revenue earner putting Vietnam in the 
world’s top 10 seafood exporter. Vietnam has more than 450 aquaculture processing 
and exporting companies but there are very few vertically integrated players. In 2006, 
because total processing capacity had jumped 20% while fish farmers had only 
increased output by 7.6%, many aquaproducts processors were operating at 30% to 
50% under capacity. There is some level of upstream integration between processors 
and farmers to the extent that processors often assist farmers by providing training, 
veterinary counseling, and access to feed and inputs at bargain prices. Farmers, on 
the other hand, will sell their fish at market price, typically selling to their partner-processor. 
Processors win by ensuring stable raw materials supply. Some processors 
are currently planning to integrate upstream by farming fish themselves. 
Figure 48. Vietnam aquaculture export Figure 49. Production of aquatic product 
4,500 
4,000 
3,500 
3,000 
2,500 
2,000 
1,500 
1,000 
500 
0 
14.74% CAGR 
2000 2001 2002 2003 2004 2005 2006 2007E 
USDmln 
3,500 
3,000 
2,500 
2,000 
1,500 
1,000 
500 
0 
1995 
1996 
2001 
2000 
1999 
1997 
1998 
'000 tons 
Oceanic fisheries Fish farming Shrimp farming 
Source: Ministry of Aquaculture Source: GSO 
Figure 50. Listed companies in fishery sector 
Ticker Name Market Cap. 
(VNDmln) 
Net sales 
(VNDmln) 
2002 
2003 
2004 
2005 
EBITDA 
Margin 
2006 
Net 
Profit 
Margin 
ROA ROE 
ABT.HM BENTRE AQUAPRODUCT IMPORT EXPORT 441,000 429,706 7.5% 9.5% 15.3% 22.8% 
ACL.HM CUU LONG FISH CORP. 612,000 537,449 13.0% 10.4% 31.4% 60.9% 
AGF.HM ANGIANG FISHERIES IMPORT & EXPORT 681,542 1,233,734 5.8% 3.2% 6.0% 8.6% 
ANV.HM NAM VIET CORPORATION 4,719,000 3,193,437 12.2% 12.1% 22.9% 30.8% 
FBT.HM FAQUIMEX 390,000 NA NA NA NA NA 
FMC.HM SAO TA FOODS 255,990 999,764 NA 2.8% 9.2% 19.9% 
ICF.HM INVESTMENT COMMERCE FISHERIES CORP 265,500 326,025 NA 6.0% 7.0% 15.0% 
MPC.HM MINH PHU SEAFOOD 2,527,000 NA NA NA NA NA 
SJ1.HM SEAFOOD NO.1 111,650 145,553 4.3% 4.0% 9.1% 11.2% 
TS4.HM SEAFOOD NO.4 128,581 172,904 5.8% 4.6% 6.8% 9.6% 
VHC.HM VINH HOANG 1,230,000 NA NA NA NA NA 
LAF.HM LAFOOCO LONG AN FOOD PROCESSING EXPORT 202,962 626,503 NA 3.0% 14.0% 26.0% 
Source: Horizon Securities, company’s data 
With a current processing capacity of 700 tons per day, Nam Viet Corporation is 
Vietnam’s largest basa fish processing and exporting company. NAV’s 2007 sales 
figures increased by 18% compared to 2006. The company is heavily dependant on 
exports, which represent on average 60% of total revenue. Exports markets are 
mostly in Asia and Europe. For 2008, management intends to build a commercial 
feed factory with a capacity of 750,000 tons per year. Management wants to solidify 
ties with farmers they depend on, by offering them feed input. NAV will be able to 
manufacture feed by utilizing its discarded waste from its fish processing activity. 
26 Horizon Securities
Vietnam Agribusiness: From farm to chopsticks February 29th, 2008 
Figure 51. Exports represent a significant portion of aquaculture processors’ total 
revenue 
Code Companies Export revenue as 
% of total revenue 
Main 
products 
ANV NAM VIET CORPORATION 65.00% basa fish 
VHC VINH HOAN CORP. 92.23% basa fish 
ICF INVESTMENT COMMERCE FISHERIES CORP. 96.00% shrimp, fish 
ABT BENTRE AQUAPRODUCT IMPORT & EXPORT JSC. 98.04% ark shell 
MPC MINH PHU SEAFOOD CORP 94.20% shrimp 
AGF AN GIANG FISHERIES IMPORT & EXPORT JSC 80.00% basa fish 
ACL CUULONG FISH JSC 95.00% basa fish 
FMC SAO TA FOODS JSC 98.00% shrimp 
FBT BEN TRE FORESTRY & AQUAPRODUCT IMPORT EXPORT 88.42% basa fish 
Source: Horizon Securities, Company data 2007 
Antibiotic residue in seafood & anti-dumping tariff: Major threat to aquaculture 
industry 
Japan is currently the third largest market for Vietnam’s aquaculture exports. 
However, shrimp exports to Japan fell 15.6% because Vietnamese products were 
repeatedly found to have traces of antibiotics. Japan now tests 100% of aquaculture 
products from Vietnam, for animal chemicals. Another major concern for Vietnam’s 
aquaculture industry is the dumping charges in the US. Since the US placed anti-dumping 
tariffs on Vietnamese companies, aquaculture exports to the US have 
decreased significantly. 
6.5 Soft drink: Still enough room for local players to growth 
The sector is dominated by Coca Cola Vietnam and Pepsi International Vietnam, who 
jointly share 84% of the soft drink (sparkling) market. The remaining 16% is divided 
between a host of local players. To avoid direct competition with the giants, the 
domestic companies have been focusing on niche markets. TNS Worldpanel 
estimates that Vietnam’s carbonated soft drink market will grow at 5% to 10% per 
year, while the non-sparkling segment should grow at 20-25%. 
Figure 52. Listed companies in soft-drink sector 
Ticker Name Market Cap. 
(VNDmln) 
Net sales 
(VNDmln) 
…carbonated soft drink market 
will grow at 5% to 10% per year 
and non-sparkling segment 
expect to grow at 20 -25% 
EBITDA Margin Net Profit Margin ROA ROE 
SCD.HM CHUONG DUONG BEVERAGE 227,800 238,894 NA 9.2% 14.4% 18.9% 
TRI.HM TRIBECO SAIGON BEVERAGE 275,515 384,639 NA 4.0% 3.5% 14.2% 
IFS.HM INTERFOOD 195,948 723,272 15.0% 10.0% 9.7% 18.1% 
Source: Horizon Securities, Company data 
Having lost market share to Coca Cola and Pepsi when they entered Vietnam in 
1990’s, Tribeco Beverage (ticker: TRI.HM) turned to soymilk products for which it has 
built a popular brand. The company reported US$24.9 million revenue in 2007, up 
The company reported 
31.8% from 2006. The company plans to invest over US$20 million to build two new 
US$24.9 million revenue in 
factories with total capacity of 39 million cases per year. Net sales in 2007 increased 
2007, up 31.8% from 2006. 
to US$24mln from US$18.36mln in 2006, representing 30.9% growth. 
Chuong Duong Beverage (ticker: SCD.HM) focuses on sarsaparilla-based drinks. The 
company also intends to construct a new factory, with a capacity of 100 million liters 
per year, worth US$22.8mln. Sales have been growing at 27% CAGR since 2005, and 
the company has been able to maintain operating margins around 8%. 
Interfood Shareholding Co. (ticker: IFS.HM) owns the Wonderfarm brand and 
produces a wide range of tropical fruit juices, coffees, canned bird's nest drinks, 
winter melon tea, and a Korean ginger drink. Operating profit grew 22% from 2006 to 
Tan Hiep Phat Group owns 
2007, and the company maintained its operating margin at 12% of sales. 
Number One Energy, which 
holds 30% to 40% of the 
Among the unlisted companies, Tan Hiep Phat Group is worth mentioning. THP Group 
energy drink market 
is a private, diversified beverage company with strong brand names in soft drinks 
27 Horizon Securities
Vietnam Agribusiness: From farm to chopsticks February 29th, 2008 
and beer. It manufactures the Number One Energy drink, which holds 30% to 40% of 
the energy drink market. THP Group also manufactures the O Degree Green Tea, 
which was the fastest growing brand in Vietnam between 2006 and 2007. The 
group’s owns three beer brands; Ben Thanh Beer, Ben Thanh Gold, and Laser. 
VII. Distribution: The rise of supermarkets 
We estimate that total retail sales in Vietnam reached US$36bln in 2007, growing at 
over 21% CAGR in the last five years. The food retailing sector has grown at 11%, 
reaching US$10.2bln in 2006. Even though traditional wet markets still dominate 
retail trade, Vietnam’s supermarkets are becoming more popular among urbanites. 
Since 1993, when the first supermarket opened its doors, there has been a 
significant increase in the number of supermarkets. Global chains, namely Big C and 
Metro, have been in the country for years and have been increasing their foothold. 
Local chains, like Co-op Mart, have been aggressively opening new stores in large 
and intermediate cities in the South of Vietnam. Currently, there are more than 200 
supermarkets all over the country. 
We believe the rise of supermarkets in Vietnam will affect the whole agribusiness 
value-chain. As modern procurement systems invariably exert more demanding 
requirements from processors and farmers, there will be a need for increased 
investments and changes in current practices. We see greater demand for industrial 
farming, cold storage and warehousing, processing facilities, and logistics. 
As supermarkets tend to source products from medium to large processors and 
wholesalers, we believe there will be opportunities for a greater level of integration 
along the supply chain. 
Figure 53. Traditional shopping still dominates 
Vietnam 
…modern shopping form is 
becoming more popular among 
urbanites 
Figure 54. …but modern shopping trend is on the 
rise 
Hong Kong 
Japan 
Thailand 
Korea 
Vietnam 
Indonesia 
India 
Tai wan 
Australia 
Singapore 
Philipines 
NZ 
Malaysia 
50% 
Traditional Grocery Stores - Regular users % 
Wet Markets - Regular users % 
50% 
140 
120 
100 
80 
60 
40 
20 
0 
2001 2002 2003 2004 2005 2006 
No.of supermarkets No. of department stores 
Source: AC Nielsen Source: Euromonitor 
Currently, there are no listed companies operating in the distribution business. Co-op 
Mart is the market leader with more than 24 supermarkets and 34 convenience 
stores in operation. Total turnover of Co-op Mart last year was around US$200mln. 
Figure 55. Modern trading form is changing agribusiness value chain 
Farmers/Co-operatives 
Farm collectors 
Wholesalers 
Wet markets Groceries Street vendors 
Consumers Consumers Consumers 
Source: Horizon Securities 
Farmers/Co-operatives 
Retailers/Supermarkets/ 
Hypermarkets 
Consumers 
28 Horizon Securities
Vietnam Agribusiness: From farm to chopsticks February 29th, 2008 
Figure 56. List of major supermarkets, hypermarkets and department stores in Vietnam 
Retailer Name Ownership No. of Outlets Estimated Sales 
Turnover (US$mln) 
Locations and expansion plan Imported Food Purchasing Agent 
COOPMART Local company operated under 
co­operative 
law 
24 supermarkets 
34 convenient stores 
200 - Mainly in HCMC (14 stores). - Just 
expanded to Can Tho, Long Xuyen, 
Phan Thiet, Gia Lai - Plan: other cities 
(Ben Tre, Buon Me Thuoc) 
29 Horizon Securities 
- Mainly from importers/distributor s and 
wholesalers. - Small portion of food 
imported directly 
BigC (CORA) Local Joint Venture with Casino 
Group of France 
5 Hypermarkets 
1 Supermarket 
> 65 - HCMC, Dong Nai, Hanoi, Hai Phong, 
Danang. - Plan: open 4 more stores. 
- Mainly from importers/distributor s and 
wholesalers. - Small portion of food 
imported directly 
Maximart An Phong Private-Owned 
Company 
4 48 - HCMC, Nha Trang, Cantho, Binh 
Duong - Expand to Binh Duong soon 
- Mainly from importers/distributor s and 
wholesalers. 
Citimart Private-Owned Company 12 Supermarkets 
4 minimarts 
38 - HCMC, Hanoi, Can THo, Dong Thap - Mainly from importers and distributors 
Intimex Joint-Stock Company 10 25 Hanoi, Haiphong, Hai Duong, Nghe 
An, Danang 
- Mainly from importers and distributors 
FIVIMART Private-Owned Company 10 25 - Hanoi, HCMC, Binh Duong - Mainly from importers and distributors 
Binh Dan Supermarkets Private-Owned Company 2 N/A -HCMC - Mainly from importers and distributors 
SATRA Supermarkets State-owned Company 2 N/A - HCMC - Mainly from importers and distributors 
Select Supermarts Private-Owned Company 5 supermarkets 
5 minimarts 
N/A -HCMC - Mainly from importers and distributors 
Metro Cash & Carry 100% Foreign Invested Company 
(Germany) 
8 >350 - HCMC, Hanoi, Hai Phong, Cantho, 
Danang. - Plan: open 4 more stores 
in HCMC, Hanoi, Dong Nai 
- Mainly from importers and distributors. - 
Direct imports for fresh and frozen 
products. 
SEYU Supermarket Local Joint-Venture with Seyu of 
Japan 
1 N/A - Hanoi - Mainly from importers and distributors. 
PAKSON Local Joint-Venture with Pakson 
of Malaysia 
3 N/A - HCMC, hai Phong. - Plan: open a 
total of 10 stores. 
- Mainly from importers and distributors. 
VINATEX State-owned company 20 supermarkets 
10 minimarts 
N/A HCMC, Dong Nai - Mainly from importers and distributors. 
HAPRO State-owned company 7 Hapromarts and 
18 convenient stores 
7 - Mainly from importers and distributors 
Wellcome Supermaket (Dairy 
Farm) 
Business Cooperation Contract 
with Citimart 
1 N/A - HCMC. -Plan: open a total of 6 
stores in Vietnam for the first phase. 
- Mainly from importers and distributors 
Source: USDA Foreign Agricultural Service
Vietnam Agribusiness: From farm to chopsticks February 29th, 2008 
VIII. Companies in focus 
30 Horizon Securities
Vietnam Agribusiness: From farm to chopsticks

More Related Content

Similar to Vietnam Agribusiness: From farm to chopsticks

Agriculture Materiality Report
Agriculture Materiality ReportAgriculture Materiality Report
Agriculture Materiality Report
Ryan Wampler
 
farmco (1).pptx Growing Sustainably, Harvesting Responsibly
farmco (1).pptx Growing Sustainably, Harvesting Responsiblyfarmco (1).pptx Growing Sustainably, Harvesting Responsibly
farmco (1).pptx Growing Sustainably, Harvesting Responsibly
LeeHuang12
 
Think Grain Think Feed April 2020
Think Grain Think Feed April 2020Think Grain Think Feed April 2020
Think Grain Think Feed April 2020
Think Grain Think Feed
 

Similar to Vietnam Agribusiness: From farm to chopsticks (20)

US Grains Council, Food 2040
US Grains Council, Food 2040US Grains Council, Food 2040
US Grains Council, Food 2040
 
iPES FOOD: TOO BIG TO FAIL
iPES FOOD: TOO BIG TO FAILiPES FOOD: TOO BIG TO FAIL
iPES FOOD: TOO BIG TO FAIL
 
Current Developments in AgTech Law: A Primer on Modern Agriculture Technologies
Current Developments in AgTech Law: A Primer on Modern Agriculture TechnologiesCurrent Developments in AgTech Law: A Primer on Modern Agriculture Technologies
Current Developments in AgTech Law: A Primer on Modern Agriculture Technologies
 
Future of agriculture agriculture - technology is a necessity in 2020 and beyond
Future of agriculture agriculture - technology is a necessity in 2020 and beyondFuture of agriculture agriculture - technology is a necessity in 2020 and beyond
Future of agriculture agriculture - technology is a necessity in 2020 and beyond
 
Adaptability and viability of "corporate farming" in agriculture sector in India
Adaptability and viability of "corporate farming" in agriculture sector in IndiaAdaptability and viability of "corporate farming" in agriculture sector in India
Adaptability and viability of "corporate farming" in agriculture sector in India
 
Technology and Equipment Manufacturing Opportunities in Food Processing Secto...
Technology and Equipment Manufacturing Opportunities in Food Processing Secto...Technology and Equipment Manufacturing Opportunities in Food Processing Secto...
Technology and Equipment Manufacturing Opportunities in Food Processing Secto...
 
Agriculture Materiality Report
Agriculture Materiality ReportAgriculture Materiality Report
Agriculture Materiality Report
 
F&B Supply Chain Report
F&B Supply Chain ReportF&B Supply Chain Report
F&B Supply Chain Report
 
farmco (1).pptx Growing Sustainably, Harvesting Responsibly
farmco (1).pptx Growing Sustainably, Harvesting Responsiblyfarmco (1).pptx Growing Sustainably, Harvesting Responsibly
farmco (1).pptx Growing Sustainably, Harvesting Responsibly
 
synthetic food market
synthetic food marketsynthetic food market
synthetic food market
 
synthetic food market
synthetic food marketsynthetic food market
synthetic food market
 
synthetic food market
synthetic food marketsynthetic food market
synthetic food market
 
synthetic food market
synthetic food marketsynthetic food market
synthetic food market
 
Emerging marketing trend - Veganism
Emerging marketing trend  - VeganismEmerging marketing trend  - Veganism
Emerging marketing trend - Veganism
 
synthetic food market
synthetic food marketsynthetic food market
synthetic food market
 
Think Grain Think Feed April 2020
Think Grain Think Feed April 2020Think Grain Think Feed April 2020
Think Grain Think Feed April 2020
 
ACE Presentation: The Warehouse Receipt System in Market Context, K. Schach M...
ACE Presentation: The Warehouse Receipt System in Market Context, K. Schach M...ACE Presentation: The Warehouse Receipt System in Market Context, K. Schach M...
ACE Presentation: The Warehouse Receipt System in Market Context, K. Schach M...
 
Agribuisness Management
Agribuisness ManagementAgribuisness Management
Agribuisness Management
 
MSP-Minimum support prize
MSP-Minimum support prizeMSP-Minimum support prize
MSP-Minimum support prize
 
Reforming agriculture
Reforming agricultureReforming agriculture
Reforming agriculture
 

Recently uploaded

Best VIP Call Girls Morni Hills Just Click Me 6367492432
Best VIP Call Girls Morni Hills Just Click Me 6367492432Best VIP Call Girls Morni Hills Just Click Me 6367492432
Best VIP Call Girls Morni Hills Just Click Me 6367492432
motiram463
 
VIP Independent Call Girls in Taloja 🌹 9920725232 ( Call Me ) Mumbai Escorts ...
VIP Independent Call Girls in Taloja 🌹 9920725232 ( Call Me ) Mumbai Escorts ...VIP Independent Call Girls in Taloja 🌹 9920725232 ( Call Me ) Mumbai Escorts ...
VIP Independent Call Girls in Taloja 🌹 9920725232 ( Call Me ) Mumbai Escorts ...
dipikadinghjn ( Why You Choose Us? ) Escorts
 
Call Girls Banaswadi Just Call 👗 7737669865 👗 Top Class Call Girl Service Ban...
Call Girls Banaswadi Just Call 👗 7737669865 👗 Top Class Call Girl Service Ban...Call Girls Banaswadi Just Call 👗 7737669865 👗 Top Class Call Girl Service Ban...
Call Girls Banaswadi Just Call 👗 7737669865 👗 Top Class Call Girl Service Ban...
amitlee9823
 
VIP Independent Call Girls in Mumbai 🌹 9920725232 ( Call Me ) Mumbai Escorts ...
VIP Independent Call Girls in Mumbai 🌹 9920725232 ( Call Me ) Mumbai Escorts ...VIP Independent Call Girls in Mumbai 🌹 9920725232 ( Call Me ) Mumbai Escorts ...
VIP Independent Call Girls in Mumbai 🌹 9920725232 ( Call Me ) Mumbai Escorts ...
dipikadinghjn ( Why You Choose Us? ) Escorts
 
VIP Call Girl in Mumbai Central 💧 9920725232 ( Call Me ) Get A New Crush Ever...
VIP Call Girl in Mumbai Central 💧 9920725232 ( Call Me ) Get A New Crush Ever...VIP Call Girl in Mumbai Central 💧 9920725232 ( Call Me ) Get A New Crush Ever...
VIP Call Girl in Mumbai Central 💧 9920725232 ( Call Me ) Get A New Crush Ever...
dipikadinghjn ( Why You Choose Us? ) Escorts
 
Call Girls in New Ashok Nagar, (delhi) call me [9953056974] escort service 24X7
Call Girls in New Ashok Nagar, (delhi) call me [9953056974] escort service 24X7Call Girls in New Ashok Nagar, (delhi) call me [9953056974] escort service 24X7
Call Girls in New Ashok Nagar, (delhi) call me [9953056974] escort service 24X7
9953056974 Low Rate Call Girls In Saket, Delhi NCR
 
VIP Call Girl in Mira Road 💧 9920725232 ( Call Me ) Get A New Crush Everyday ...
VIP Call Girl in Mira Road 💧 9920725232 ( Call Me ) Get A New Crush Everyday ...VIP Call Girl in Mira Road 💧 9920725232 ( Call Me ) Get A New Crush Everyday ...
VIP Call Girl in Mira Road 💧 9920725232 ( Call Me ) Get A New Crush Everyday ...
dipikadinghjn ( Why You Choose Us? ) Escorts
 

Recently uploaded (20)

Mira Road Memorable Call Grls Number-9833754194-Bhayandar Speciallty Call Gir...
Mira Road Memorable Call Grls Number-9833754194-Bhayandar Speciallty Call Gir...Mira Road Memorable Call Grls Number-9833754194-Bhayandar Speciallty Call Gir...
Mira Road Memorable Call Grls Number-9833754194-Bhayandar Speciallty Call Gir...
 
W.D. Gann Theory Complete Information.pdf
W.D. Gann Theory Complete Information.pdfW.D. Gann Theory Complete Information.pdf
W.D. Gann Theory Complete Information.pdf
 
Best VIP Call Girls Morni Hills Just Click Me 6367492432
Best VIP Call Girls Morni Hills Just Click Me 6367492432Best VIP Call Girls Morni Hills Just Click Me 6367492432
Best VIP Call Girls Morni Hills Just Click Me 6367492432
 
Navi Mumbai Cooperetive Housewife Call Girls-9833754194-Natural Panvel Enjoye...
Navi Mumbai Cooperetive Housewife Call Girls-9833754194-Natural Panvel Enjoye...Navi Mumbai Cooperetive Housewife Call Girls-9833754194-Natural Panvel Enjoye...
Navi Mumbai Cooperetive Housewife Call Girls-9833754194-Natural Panvel Enjoye...
 
Call Girls Koregaon Park Call Me 7737669865 Budget Friendly No Advance Booking
Call Girls Koregaon Park Call Me 7737669865 Budget Friendly No Advance BookingCall Girls Koregaon Park Call Me 7737669865 Budget Friendly No Advance Booking
Call Girls Koregaon Park Call Me 7737669865 Budget Friendly No Advance Booking
 
VIP Independent Call Girls in Taloja 🌹 9920725232 ( Call Me ) Mumbai Escorts ...
VIP Independent Call Girls in Taloja 🌹 9920725232 ( Call Me ) Mumbai Escorts ...VIP Independent Call Girls in Taloja 🌹 9920725232 ( Call Me ) Mumbai Escorts ...
VIP Independent Call Girls in Taloja 🌹 9920725232 ( Call Me ) Mumbai Escorts ...
 
Call Girls Rajgurunagar Call Me 7737669865 Budget Friendly No Advance Booking
Call Girls Rajgurunagar Call Me 7737669865 Budget Friendly No Advance BookingCall Girls Rajgurunagar Call Me 7737669865 Budget Friendly No Advance Booking
Call Girls Rajgurunagar Call Me 7737669865 Budget Friendly No Advance Booking
 
falcon-invoice-discounting-unlocking-prime-investment-opportunities
falcon-invoice-discounting-unlocking-prime-investment-opportunitiesfalcon-invoice-discounting-unlocking-prime-investment-opportunities
falcon-invoice-discounting-unlocking-prime-investment-opportunities
 
Call Girls Banaswadi Just Call 👗 7737669865 👗 Top Class Call Girl Service Ban...
Call Girls Banaswadi Just Call 👗 7737669865 👗 Top Class Call Girl Service Ban...Call Girls Banaswadi Just Call 👗 7737669865 👗 Top Class Call Girl Service Ban...
Call Girls Banaswadi Just Call 👗 7737669865 👗 Top Class Call Girl Service Ban...
 
Kopar Khairane Russian Call Girls Number-9833754194-Navi Mumbai Fantastic Unl...
Kopar Khairane Russian Call Girls Number-9833754194-Navi Mumbai Fantastic Unl...Kopar Khairane Russian Call Girls Number-9833754194-Navi Mumbai Fantastic Unl...
Kopar Khairane Russian Call Girls Number-9833754194-Navi Mumbai Fantastic Unl...
 
Top Rated Pune Call Girls Sinhagad Road ⟟ 6297143586 ⟟ Call Me For Genuine S...
Top Rated  Pune Call Girls Sinhagad Road ⟟ 6297143586 ⟟ Call Me For Genuine S...Top Rated  Pune Call Girls Sinhagad Road ⟟ 6297143586 ⟟ Call Me For Genuine S...
Top Rated Pune Call Girls Sinhagad Road ⟟ 6297143586 ⟟ Call Me For Genuine S...
 
VIP Independent Call Girls in Mumbai 🌹 9920725232 ( Call Me ) Mumbai Escorts ...
VIP Independent Call Girls in Mumbai 🌹 9920725232 ( Call Me ) Mumbai Escorts ...VIP Independent Call Girls in Mumbai 🌹 9920725232 ( Call Me ) Mumbai Escorts ...
VIP Independent Call Girls in Mumbai 🌹 9920725232 ( Call Me ) Mumbai Escorts ...
 
Booking open Available Pune Call Girls Shivane 6297143586 Call Hot Indian Gi...
Booking open Available Pune Call Girls Shivane  6297143586 Call Hot Indian Gi...Booking open Available Pune Call Girls Shivane  6297143586 Call Hot Indian Gi...
Booking open Available Pune Call Girls Shivane 6297143586 Call Hot Indian Gi...
 
Top Rated Pune Call Girls Viman Nagar ⟟ 6297143586 ⟟ Call Me For Genuine Sex...
Top Rated  Pune Call Girls Viman Nagar ⟟ 6297143586 ⟟ Call Me For Genuine Sex...Top Rated  Pune Call Girls Viman Nagar ⟟ 6297143586 ⟟ Call Me For Genuine Sex...
Top Rated Pune Call Girls Viman Nagar ⟟ 6297143586 ⟟ Call Me For Genuine Sex...
 
VIP Call Girl in Mumbai Central 💧 9920725232 ( Call Me ) Get A New Crush Ever...
VIP Call Girl in Mumbai Central 💧 9920725232 ( Call Me ) Get A New Crush Ever...VIP Call Girl in Mumbai Central 💧 9920725232 ( Call Me ) Get A New Crush Ever...
VIP Call Girl in Mumbai Central 💧 9920725232 ( Call Me ) Get A New Crush Ever...
 
20240419-SMC-submission-Annual-Superannuation-Performance-Test-–-design-optio...
20240419-SMC-submission-Annual-Superannuation-Performance-Test-–-design-optio...20240419-SMC-submission-Annual-Superannuation-Performance-Test-–-design-optio...
20240419-SMC-submission-Annual-Superannuation-Performance-Test-–-design-optio...
 
Call Girls in New Ashok Nagar, (delhi) call me [9953056974] escort service 24X7
Call Girls in New Ashok Nagar, (delhi) call me [9953056974] escort service 24X7Call Girls in New Ashok Nagar, (delhi) call me [9953056974] escort service 24X7
Call Girls in New Ashok Nagar, (delhi) call me [9953056974] escort service 24X7
 
Top Rated Pune Call Girls Dighi ⟟ 6297143586 ⟟ Call Me For Genuine Sex Servi...
Top Rated  Pune Call Girls Dighi ⟟ 6297143586 ⟟ Call Me For Genuine Sex Servi...Top Rated  Pune Call Girls Dighi ⟟ 6297143586 ⟟ Call Me For Genuine Sex Servi...
Top Rated Pune Call Girls Dighi ⟟ 6297143586 ⟟ Call Me For Genuine Sex Servi...
 
VIP Call Girl in Mira Road 💧 9920725232 ( Call Me ) Get A New Crush Everyday ...
VIP Call Girl in Mira Road 💧 9920725232 ( Call Me ) Get A New Crush Everyday ...VIP Call Girl in Mira Road 💧 9920725232 ( Call Me ) Get A New Crush Everyday ...
VIP Call Girl in Mira Road 💧 9920725232 ( Call Me ) Get A New Crush Everyday ...
 
Mira Road Awesome 100% Independent Call Girls NUmber-9833754194-Dahisar Inter...
Mira Road Awesome 100% Independent Call Girls NUmber-9833754194-Dahisar Inter...Mira Road Awesome 100% Independent Call Girls NUmber-9833754194-Dahisar Inter...
Mira Road Awesome 100% Independent Call Girls NUmber-9833754194-Dahisar Inter...
 

Vietnam Agribusiness: From farm to chopsticks

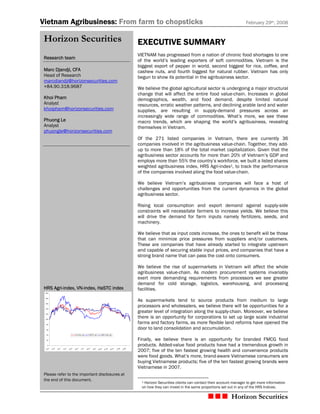
  • 1. Vietnam Agribusiness: From farm to chopsticks February 29th, 2008 EXECUTIVE SUMMARY VIETNAM has progressed from a nation of chronic food shortages to one of the world’s leading exporters of soft commodities. Vietnam is the biggest export of pepper in world, second biggest for rice, coffee, and cashew nuts, and fourth biggest for natural rubber. Vietnam has only begun to show its potential in the agribusiness sector. We believe the global agricultural sector is undergoing a major structural change that will affect the entire food value-chain. Increases in global demographics, wealth, and food demand, despite limited natural resources, erratic weather patterns, and declining arable land and water supplies, are resulting in supply-demand pressures across an increasingly wide range of commodities. What’s more, we see these macro trends, which are shaping the world’s agribusiness, revealing themselves in Vietnam. Of the 271 listed companies in Vietnam, there are currently 36 companies involved in the agribusiness value-chain. Together, they add-up to more than 18% of the total market capitalization. Given that the agribusiness sector accounts for more than 20% of Vietnam’s GDP and employs more than 55% the country’s workforce, we built a listed shares weighted agribusiness index, HRS Agri-index1, to track the performance of the companies involved along the food value-chain. We believe Vietnam’s agribusiness companies will face a host of challenges and opportunities from the current dynamics in the global agribusiness sector. Rising local consumption and export demand against supply-side constraints will necessitate farmers to increase yields. We believe this will drive the demand for farm inputs namely fertilizers, seeds, and machinery. We believe that as input costs increase, the ones to benefit will be those that can minimize price pressures from suppliers and/or customers. These are companies that have already started to integrate upstream and capable of securing stable input prices, and companies that have a strong brand name that can pass the cost onto consumers. We believe the rise of supermarkets in Vietnam will affect the whole agribusiness value-chain. As modern procurement systems invariably exert more demanding requirements from processors we see greater demand for cold storage, logistics, warehousing, and processing facilities. As supermarkets tend to source products from medium to large processors and wholesalers, we believe there will be opportunities for a greater level of integration along the supply-chain. Moreover, we believe there is an opportunity for corporations to set up large scale industrial farms and factory farms, as more flexible land reforms have opened the door to land consolidation and accumulation. Finally, we believe there is an opportunity for branded FMCG food products. Added-value food products have had a tremendous growth in 2007; five of the ten fastest growing health and convenience products were food goods. What’s more, brand-aware Vietnamese consumers are buying Vietnamese products; five of the ten fastest growing brands were Vietnamese in 2007. 1 Horizon Securities clients can contact their account manager to get more information on how they can invest in the same proportions set out in any of the HRS Indices. Horizon Securities Horizon Securities Research team Marc Djandji, CFA Head of Research marcdiandji@horizonsecurities.com +84.90.318.9687 Khoi Pham Analyst khoipham@horizonsecurities.com Phuong Le Analyst phuongle@horizonsecurities.com HRS Agri-index, VN-index, HaSTC index 200 180 160 140 120 100 80 60 40 20 0 1/07 2/07 3/07 4/07 5/07 6/07 7/07 8/07 9/07 10/07 11/07 12/07 1/08 2/08 VN-Index_adj HASTCI_adj AGRI-Index_adj Please refer to the important disclosures at the end of this document.
  • 2. Vietnam Agribusiness: From farm to chopsticks February 29th, 2008 Table of contents I. THE END OF CHEAP FOOD............................................................................................... 4 1.1 THE FOOD SUPPLY-DEMAND EQUATION; DEMAND FACTORS................................................. 4 1.2 THE FOOD SUPPLY-DEMAND EQUATION; SUPPLY FACTORS .................................................. 7 1.3 THE FOOD SUPPLY-DEMAND EQUATION; SOFT COMMODITIES ARE TAKING CENTRE STAGE ....... 7 II. CHALLENGES AND OPPORTUNITIES FOR VIETNAM AGRIBUSINESS ........................10 III. LISTED AGRIBUSINESS ................................................................................................14 IV. FARM INPUT..................................................................................................................16 4.1 FERTILIZER SECTOR IN VIETNAM: RELYING HEAVILY ON IMPORTS.......................................16 4.2 CROP PROTECTION ......................................................................................................18 4.3 OPPORTUNITIES FOR THE SEED SECTOR .........................................................................19 4.4 FARMING MACHINERY ..................................................................................................20 4.5 ANIMAL FEED..............................................................................................................21 V. RESOURCE PRODUCERS ..............................................................................................21 5.1 CROP PRODUCTION: OPPORTUNITIES FOR LARGE-SCALE FARMING ENTERPRISES.................21 5.2 CONTRACT FARMING....................................................................................................22 VI. PROCESSING ................................................................................................................22 6.1 DAIRY PRODUCTS: UPTREND DEMAND AND LOW LEVEL OF SUBSTITUTE .............................22 6.2 SUGAR INDUSTRY: UNDER GOVERNMENT’S “PRICE MANAGEMENT”...................................23 6.3 CONFECTIONERY: SEVERE COMPETITION AMONG RIVALS. .................................................25 6.4 AQUACULTURE PROCESSING: VIETNAM’S FOURTH LARGEST INCOME..................................26 6.5 SOFT DRINK: STILL ENOUGH ROOM FOR LOCAL PLAYERS TO GROWTH ................................27 VII. DISTRIBUTION: THE RISE OF SUPERMARKETS ........................................................28 VIII. COMPANIES IN FOCUS...............................................................................................30 2 Horizon Securities
  • 3. Vietnam Agribusiness: From farm to chopsticks February 29th, 2008 Table of figures FIGURE 1. WORLD’S MEAT CONSUMPTION VS. GDP ...................................................................................... 5 FIGURE 2. VIETNAM’S MEAT CONSUMPTION PER CAPITA.................................................................................. 5 FIGURE 3. FISHERIES AND LIVESTOCK OUTPUT VALUE (BLN’VND).................................................................... 5 FIGURE 4. AGRICULTURE, FISHERIES AND LIVESTOCK COMPOSITION ................................................................. 5 FIGURE 5. US GRAINS FOR ETHANOL PRODUCTION......................................................................................... 6 FIGURE 6. US BIOFUELS CONSUMPTION....................................................................................................... 6 FIGURE 7. WORLD’S GRAIN PRODUCTION AND CONSUMPTION.......................................................................... 7 FIGURE 8. WORLD UREA FERTILIZER PRICE ................................................................................................... 9 FIGURE 9. WORLD COFFEE PRICE................................................................................................................ 9 FIGURE 10. WORLD WHEAT PRICE .............................................................................................................. 9 FIGURE 11. VIETNAM FOOD CPI VS. TOTAL CPI ............................................................................................ 9 FIGURE 12. VIETNAM RICE PRICE ................................................................................................................ 9 FIGURE 13. VIETNAM PIG AND PIGLET PRICE ................................................................................................ 9 FIGURE 14. VIETNAM INDUSTRY AND DOMESTIC CHICKEN PRICE...................................................................... 9 FIGURE 15. VIETNAM GASOLINE PRICE......................................................................................................... 9 FIGURE 16. TOP 10 GROWTH CATEGORIES ................................................................................................ 11 FIGURE 17. TOP 10 FASTEST GROWING BRANDS ........................................................................................ 11 FIGURE 18. VIETNAM AGRICULTURE GDP TO TOTAL GDP ............................................................................ 13 FIGURE 19. VIETNAM AGRICULTURE OUTPUT............................................................................................... 13 FIGURE 20. VIETNAM AGRICULTURE EXPORT MIX ......................................................................................... 13 FIGURE 21. VIETNAM AGRICULTURE EXPORT VS. TOTAL EXPORT ..................................................................... 13 FIGURE 22. WORLD ARABLE LAND PER CAPITA............................................................................................ 13 FIGURE 23. VIETNAM ARABLE LAND FOR PADDY .......................................................................................... 13 FIGURE 24. VIETNAM ARABLE LAND FOR PERENNIAL INDUSTRIAL CROPS ......................................................... 13 FIGURE 25. VIETNAM ARABLE LAND FOR ANNUAL INDUSTRIAL CROPS ............................................................. 13 FIGURE 26. HRS AGRI-INDEX.................................................................................................................. 14 FIGURE 27. HRS AGRI-INDEX COVERED STOCKS: VALUATION COMPARABLES .................................................. 14 FIGURE 28. VIETNAM: AGRIBUSINESS VALUE CHAIN..................................................................................... 15 FIGURE 29. LISTED COMPANIES IN FARM INPUT SECTOR............................................................................... 16 FIGURE 30. LOCAL FERTILIZER PRODUCTION............................................................................................... 16 FIGURE 31. VIETNAM’S FERTILIZER IMPORT................................................................................................ 16 FIGURE 32. FERTILIZER PRICES ................................................................................................................ 17 FIGURE 33. LOCAL SUPPLY VS. DEMAND.................................................................................................... 17 FIGURE 34. MARKET SHARE 2007.......................................................................................................... 17 FIGURE 35. MARKET SHARE 2010.......................................................................................................... 17 FIGURE 36. VIETNAM GAS RESERVE AND PRODUCTION................................................................................. 18 FIGURE 37. GROWTH OF THE BIOTECH CROP MARKET IN THE WORLD.............................................................. 19 FIGURE 38. LIST OF REGISTERED SEEDS IN VIETNAM................................................................................... 20 FIGURE 39. WORLD PADDY YIELD ............................................................................................................. 21 FIGURE 40. LISTED COMPANIES IN MILK SECTOR......................................................................................... 22 FIGURE 41. VIETNAM: PRODUCTION OF MILK BY PROVINCE ........................................................................... 23 FIGURE 42. LISTED COMPANIES IN SUGAR SECTOR ...................................................................................... 23 FIGURE 43. SUGAR MARKET IS HIGHLY FRAGMENTED .................................................................................. 24 FIGURE 44. DOMESTIC SUGAR PRICE IN THE PAST 2 YEARS........................................................................... 24 FIGURE 45. VIETNAM: TARIFF REDUCTION ROADMAP IN COMPLIANCE WITH WTO ............................................. 24 FIGURE 46. KEY PLAYER MARKET SHARES ................................................................................................. 25 FIGURE 47. LISTED COMPANIES IN CONFECTIONERY SECTOR......................................................................... 25 FIGURE 48. VIETNAM AQUACULTURE EXPORT .............................................................................................. 26 FIGURE 49. PRODUCTION OF AQUATIC PRODUCT.......................................................................................... 26 FIGURE 50. LISTED COMPANIES IN FISHERY SECTOR .................................................................................... 26 FIGURE 51. EXPORTS REPRESENT A SIGNIFICANT PORTION OF AQUACULTURE PROCESSORS’ TOTAL REVENUE........ 27 FIGURE 52. LISTED COMPANIES IN SOFT-DRINK SECTOR............................................................................... 27 FIGURE 53. TRADITIONAL SHOPPING STILL DOMINATES VIETNAM................................................................... 28 FIGURE 54. …BUT MODERN SHOPPING TREND IS ON THE RISE ...................................................................... 28 FIGURE 55. MODERN TRADING FORM IS CHANGING AGRIBUSINESS VALUE CHAIN ............................................. 28 FIGURE 56. LIST OF MAJOR SUPERMARKETS, HYPERMARKETS AND DEPARTMENT STORES IN VIETNAM ................ 29 FIGURE 57. RETURN ON AGRIBUSINESS STOCKS......................................................................................... 31 FIGURE 58. AGRIBUSINESS SHARES ABSOLUTE PERFORMANCE (TOP 10 COMPANIES) ...................................... 32 3 Horizon Securities
  • 4. Vietnam Agribusiness: From farm to chopsticks February 29th, 2008 I. The end of cheap food We believe the global agricultural sector is undergoing a major structural change that will affect the entire food value-chain. The global macro trends that are shaping the world’s agribusiness are also revealing themselves in Vietnam. Continuous increases in global demographics, wealth, and food demand, despite limited natural resources, erratic weather patterns, and declining arable land and water supplies, are resulting in pressures across an increasingly, wide range of soft commodities. Soaring oil prices have contributed to the increased inflationary pressure of most agricultural crops: 1) by raising input and transportation costs, and 2) by boosting demand for agricultural crops used as feedstock in the production of alternative energies. Hence, we are entering a period of short supply, yet robust global demand for agricultural products and food, resulting in worldwide agflation2. There can be no discussion concerning the current environment affecting agribusiness without mentioning biofuels and China. The recent surge in demand for biofuels and the greater hectarage allocated to biofuels feedstock which followed, coupled with China’s insatiable hunger for animal protein have compounded the current global agflation pressures. We believe these factors, have and will continue to put pressure on the supply-demand equation for years to come. Since the introduction of its economic reforms, Vietnam progressed from a nation of chronic food shortages to one of the world’s leading exporters of agricultural products, namely rice, coffee, rubber, and tea. Vietnam has only begun to show its potential in the agriculture sector and at this stage most of its agribusiness is involved in low margin commodity exports, rather than value-added processed foods. Vietnamese agribusiness industry must confront issues of low production yields, high costs, food safety, and deficiencies in the processing and distribution segments. In view of Vietnam’s dependency on agriculture and exports of commodities, and given that agribusiness accounts for more than 18% of total listed market capitalization, Horizon Securities has sought out the listed agribusiness companies and has highlighted some of the major opportunities and challenges these companies will face. 1.1 The food supply-demand equation; demand factors We observe three key catalysts driving the long-term demand for agricultural production and agribusiness. Demographics: Current world population is believed to have reached over 6.6 billion and is expected to surpass 7.5 billion by 2025, growing by over 70 million per year. That 70 million additional people a year worldwide need to bed fed, while the supply of arable land has been on the decline. Current population growth compounded by improvement in health and life expectancy in developing countries intensifies the demand for food. We see China and India as being key factors in the global food supply-demand equation as they account for more than one-third of the world’s population. With a population of about 1.3 billion, China feeds the largest number of consumers in the world. China becoming a net importer of food would have major repercussions on world demand and soft commodity prices. China has already shifted from being self-sufficient to an importer for certain food staples, such as soybean of which it is now the world's largest importer. In addition, we are facing the fact that China will soon have to begin importing much more corn than the 100,000 tones it is currently importing. According to Zhu Changguo, Chairman of the Chinese Cereals and Oils Association, China could be forced to import 10 million tons of corn a year by 2010 to feed its growing livestock industry and ethanol production. 2 Merrill Lynch, April 2007 We believe major structural change in global agricultural that will affect the entire food value-chain Agribusiness accounts for more than 18% of Vietnam’s total listed market capitalization China has shifted from being self-sufficient to an importer for certain food staples 4 Horizon Securities
  • 5. Vietnam Agribusiness: From farm to chopsticks February 29th, 2008 Vietnam’s population exceeded 85 million in 2007 with over 50% under 30 years old and a median age of 26.4 years. Successful family planning efforts resulted in the population growth rate dropping to 1% in 2007 from 2.1 percent in 1989. According to the US Census Bureau the Vietnam’s population will be just short of 100 million by 2025, growing at an average 0.8 million per year. Eating habits: Demand for animal protein, such as beef, pork, poultry, and dairy generally increases with affluence. Increasing real income and urbanization in emerging markets are encouraging higher levels of nutrition and diets that incorporate more animal protein. Figure 1. World’s meat consumption vs. GDP Figure 2. Vietnam’s meat consumption per capita y = 24.201Ln(x) - 159.24 R2 = 0.6254 160 140 120 100 80 60 40 20 0 -20 0 10,000 20,000 30,000 40,000 50,000 60,000 GDP Meat consumption (k g pe r cap i ta) 45.00 40.00 35.00 30.00 25.00 20.00 15.00 10.00 5.00 - 1987 1988 1989 1990 1991 1992 1993 1994 1995 1996 1997 1998 1999 2000 2001 2002 2003 2004 2005 2006 2007 kg/person Source: Horizon Securities, FAO Source: Horizon Securities, FAO, USDA Rising income, particularly in Vietnam’s urban areas induced a rapid increase in demand for meat. Per capita meat consumption went from 16kg/year in 1987 to 38.17kg/year in 2007, 70% of which is pork meat. In response to this rising demand, the private sector invested heavily in feed, breeding, and slaughtering/processing. Between 2000 and 2006 the total value of livestock output increased at over 7% GAGR while the total agricultural sector increased by 4%. Figure 3. Fisheries and livestock output value (bln’VND) more animal protein in Vietnamese diet… Figure 4. Agriculture, fisheries and livestock composition 30,000 25,000 20,000 15,000 10,000 5,000 0 1990 1991 1992 1993 1994 1995 1996 1997 1998 1999 2000 2001 2002 2003 2004 2005 2006 O u tp u t v a l u e o f f i s h i n g & l i v e s to c k a t 1 9 9 4 c o n s ta n t p r i c e s Oceanic fisheries Aquaculture Domestic animal Poultry Non - meat product 200,000 180,000 160,000 140,000 120,000 100,000 80,000 60,000 40,000 20,000 - 1990 1991 1992 1993 1994 1995 1996 1997 1998 1999 2000 2001 2002 2003 2004 2005 2006 Bi l l ion VND Domestic animals Poultry Non-meat products Grains Vegetables Industrial crops Fruit crops Oceanic fisheries Aquaculture Source: GSO Source: GSO In 2000, the state selected pork and dairy as strategic livestock commodities. While pork was chosen to develop an export market, dairy was developed in order to reduce Vietnam’s reliance on milk imports. The number of live pigs increased from 18.9 million in 1999 to 26.9 million by 2006. Live cattle increased from just above 4 million in 1999 to over 6.5 million in 2006. Thanks to better breeding methods, higher quality feeds, and new large-scale animal farming facilities, the country was able to increase production capacity and yields. Between 2000 and 2006, the average weight of a pig increased by over 30%, while the amount of milk domestically produced went from 51,000 tons to over 200,000 tons per year. … means more livestock production 5 Horizon Securities
  • 6. Vietnam Agribusiness: From farm to chopsticks February 29th, 2008 Economic growth has also benefited the production of other types of animal proteins. The Vietnamese poultry sector had been scaling up at a rapid pace in the last decade. However, the outbreaks of Avian Influenza in 2004, 2005, and country-wide culling of chicken, caused production to be scaled back significantly, as farmers worry about loosing their flocks from further outbreaks in the future. In 2001, the state formulated a plan to bolster fish farming in the Mekong Delta by developing 700,000 hectares of land. Backed by strong government support, fish and shrimp farming grew at over 19% CAGR from 2000 to 2007. There are now close to one million fish farming hectares and the sector produces more than two million tons of farmed aquatic products per year. Most of the world's livestock is grain fed; grain account for 70% of the cost of the animals’ diet. To raise poultry and pork, it takes an estimated 2 to 4 kg of grain to produce 1 kg of meat, and for grain-fed cattle, the figure is an estimated 7 kg of grain per 1 kg of meat. Therefore, as demand for grain-fed animal protein increases, so does demand for animal feed. The increasing demand for animal feed has prompted Hanoi to boost maize production (at the expense of arable land used to growing rice) in an effort to reduce Vietnam’s dependency on maize imports for feed manufacturing. Biofuels: In response to higher energy prices, and fueled by government incentives, the fledgling biofuels industry has started to grow at an explosive pace. This growth was fuelled by a series of government policies aiming to reduce petroleum dependency. In his State of the Union address, in January 2007, President Bush declared that the US would need to expand the use of biofuels and invest in new technologies to produce ethanol. Concretely, in December 2007, the adoption of the United States Energy Bill doubled the Renewable Fuel Standard (RFS) for first generation biofuels to 15 billion gallons per year by 2015. Figure 5. US grains for ethanol production Figure 6. US biofuels consumption 120 100 80 60 40 20 0 1980 1985 1990 1995 2000 2005 Mi l l i on Tons 500,000,000 450,000,000 400,000,000 350,000,000 300,000,000 250,000,000 200,000,000 150,000,000 100,000,000 50,000,000 0 … more grain for animal feed results in less grain for food grain account for 70% of the cost of the animals’ diet 2000 2001 2002 2003 2004 2005 2006 2007E Demand (tons) Source: Earth Policy Institute Source: US National Biodiesel Board By far the largest producer of biodiesel in the world, the European Union has about 180 operational biodiesel plants which have a production capacity estimated at 10.2 million tons. Supportive government policies in the European Union have encouraged biodiesel production. The US National Biodiesel Board indicates there are 171 operational biodiesel plants in the United States, with a total production capacity exceeding 8.48 billion liters. Production capacity has rocketed in response to growing demand, which has risen from 98 million liters in 2004 to 852 million liters in 2006. Although we believe this will significantly disrupts the supply-demand structure of major crops, government biofuels policy is the key variable that will determine the extent of ethanol’s effect on soft commodity prices. In fact, in response to higher food prices and research suggesting limited environmental benefits of starch-based 6 Horizon Securities
  • 7. Vietnam Agribusiness: From farm to chopsticks February 29th, 2008 biofuels technology, there is growing concern, particularly in Europe, about the viability of diverting arable land for biofuels feedstock. 1.2 The food supply-demand equation; supply factors Over the past 50 years, the green revolution had enabled world food production to outpace rising demand (and sustain a low-priced food environment). New technologies and agricultural techniques such as crop rotation, mass production and use of agrochemicals, expanded irrigation, and the introduction of genetically superior, disease-resistant plants brought about considerable benefits. However, the demand has caught up while supply has slowed. In Vietnam, major investments in irrigation had contributed to past sector growth, for rice in particular, but this production has begun to plateau. Among the most serious constraints to increasing yields in the face of population growth are: 1) shortages of arable land, 2) degradation of land resources, 3) loss of agricultural land due to urbanization, 4) diversification to non-food of arable land, 5) water shortages and pollution, 6) irrigation problems, 7) collapsing oceanic fisheries, and 8) climate change. As a result capacity to increase food production may well be shrinking. At the time of writing this report, we are reminded of Vietnam’s agri-sector’s vulnerability to adverse weather and risks of disease/pests outbreaks. A record-long cold weather in the North of Vietnam has caused over 60,000 cattle to die, and has destroyed over 150,000 hectares of rice paddies. Water shortages caused by low rainfall in the North of Vietnam, are hurting agriculture in the Red River Delta. There are also growing concerns about elevated risks of another bird flue outbreak and potential blue-ear outbreak. Since the beginning of the year there have been H5N1 outbreaks in seven provinces in the country. Although Vietnam has been vaccinating poultry for years, there is a clear and present risk that farmers may have to cull millions of birds as they did in 2004 and 2005. 1.3 The food supply-demand equation; soft commodities are taking centre stage Soft commodities prices have soared to decade-highs affecting producers, consumers, and governments everywhere. The triggering factor was the sudden increase in demand for grain used to manufacture ethanol in the US. From 2006 to 2007, grain used for ethanol production jumped from 54 million tons to 81 millions, effectively doubling the annual growth in world grain demand. The most significant year-over- year price increase has been for wheat, which rose by an average 74.5%. World maize prices increased by nearly 20% in 2007, but this follows an increase of almost 45% in the previous year. For rice, world prices registered a 17% rise year-over-year. Declining global stockpiles of soft commodities are Figure 7. World’s grain production and consumption 2,500 2,000 1,500 1,000 500 0 Production Consumption 1960 1970 1980 1990 2000 Mil l ion Metr ic Tons Source: USDA exacerbating current price pressures. Global inventories of grains are currently at a 25-year low. What sets apart the current agri-sector conditions to previous ones is the fact that prices are soaring, not just for a selected few, but for nearly all, major food and feed commodities. From 2006 to 2007, grain used for ethanol production jumped from 54 million tons to 81 millions 7 Horizon Securities
  • 8. Vietnam Agribusiness: From farm to chopsticks February 29th, 2008 As these events permeate into the food value-chain in Vietnam, processors and consumers are feeling the crunch. Furthermore, a politic of food scarcity is emerging as Hanoi has limited rice exports in an attempt to limit the rise in domestic food prices. In 2007, Vietnam’s Consumer Price Index rose by 12.6%, while food and foodstuff jumped 19%, the highest increase among the CPI’s components. Food and foodstuff alone, account for more than 42% of the CPI basket. Fighting inflation in Vietnam We are concerned about Vietnam’s rampant inflation and the ramifications it will have on the economy and consumer spending. However, the current inflation environment is not only inherent to Vietnam, as we point out throughout this report; there are global pressures at work that are affecting inflation everywhere. It’s always difficult to know why central bankers do what they do, and we are uncertain about how the State Bank’s recent moves will pan out in the economy. First, the State Bank announced it would reduce the money supply by approximately VND34,000 billion (US$2.13 billion) by requiring commercial banks 1) to increase their reserves by 1% to 11% of their deposits, and 2) by forcing commercial banks to buy treasury bonds to be issued on 17 March 2008. Then, last week the State Bank, through open market instruments, injected VND39,000 billion (US$2.44 billion) into the monetary market with a maturity date on 8 March 2008. In short, the State Bank withdrew money and injected it right back, but did this through different channels. Almost instantly after these measures were announced, a cold chill ran across the red hot real estate market. Commercial banks may have interpreted these measures as a message that they needed to restructure their mortgage portfolio. It is still unclear, however, how these measures will affect the economy in the short to medium term and whether they will be successful at curbing inflation. 8 Horizon Securities
  • 9. Vietnam Agribusiness: From farm to chopsticks February 29th, 2008 Figure 8. World urea fertilizer price Figure 9. World coffee price 450 400 350 300 250 200 150 100 50 0 9/27/2002 12/26/2002 3/26/2003 6/24/2003 9/22/2003 12/19/2003 3/18/2004 6/16/2004 9/14/2004 12/13/2004 3/11/2005 10/5/2005 1/3/2006 4/3/2006 6/30/2006 9/28/2006 12/27/2006 3/27/2007 6/25/2007 9/21/2007 US$/ton 2,500 2,000 1,500 US$/ton 1,000 500 - 11/14/2002 2/10/2003 5/16/2003 8/26/2003 11/18/2003 2/17/2004 5/7/2004 7/28/2004 10/18/2004 1/6/2005 3/29/2005 6/17/2005 9/7/2005 11/28/2005 2/16/2006 5/9/2006 7/28/2006 10/18/2006 1/8/2007 3/29/2007 6/19/2007 9/7/2007 11/28/2007 Source: Reuters Source: Reuters Figure 10. World wheat price Figure 11. Vietnam food CPI vs. total CPI 125.0 120.0 115.0 110.0 105.0 100.0 95.0 90.0 Dec-02 Aug -02 Vietnam CPI Food CPI Dec-03 Apr-03 Aug-03 Dec-04 Apr-04 Aug-04 Dec-05 Apr-05 Aug-05 Dec-06 Apr-06 Aug-06 Dec-07 Apr-07 Aug-07 Source: futures.tradingcharts.com Source: GSO Figure 12. Vietnam rice price Figure 13. Vietnam pig and piglet price 9,000 8,000 7,000 6,000 5,000 4,000 3,000 2,000 1,000 0 Jan-01 May-01 Jan-02 May-02 Sep-01 Jan-03 May-03 Sep-02 Jan-04 May-04 Sep-03 Jan-05 May-05 Sep-04 Jan-06 May-06 Sep-05 Jan-07 May-07 Sep-06 Sep-07 Jan-08 VND/kg 80,000 70,000 60,000 50,000 40,000 30,000 20,000 10,000 0 Jan-01 Jul-01 Oct-01 Apr-01 Piglet Live pig Jan-02 Jul-02 Oct-02 Apr-02 Jul-03 Oct-03 Apr-03 Jan-03 Jan-04 Jul-04 Oct-04 Apr-04 Jul-05 Oct-05 Apr-05 Jan-05 Jan-06 Jul-06 Oct-06 Apr-06 Jan-07 Jul-07 Oct-07 Apr-07 Jan-08 VND/k g Source: Agriculture Information Center of Vietnam Source: Agriculture Information Center of Vietnam Figure 14. Vietnam industry and domestic chicken Figure 15. Vietnam gasoline price price 120,000 100,000 80,000 60,000 40,000 20,000 0 Industry Chicken Domestic Chicken Jan-06 Feb-06 Mar-06 Apr-06 May-06 Jun-06 Jul-06 Aug-06 Sep-06 Oct-06 Nov-06 Dec-06 Jan-07 Feb-07 Mar-07 Apr-07 May-07 Jun-07 Jul-07 Aug-07 Sep-07 Oct-07 Nov-07 Dec-07 Jan-08 Feb-08 VND/kg 14,000 12,000 10,000 8,000 6,000 4,000 2,000 0 Jan-01 May-01 Sep-01 Jan-02 May-02 Sep-02 Jan-03 May-03 Sep-03 Jan-04 May-04 Sep-04 Jan-05 May-05 Sep-05 Jan-06 May-06 Sep-06 Jan-07 May-07 Sep-07 Jan-08 VND/l i ter Source: Agriculture Information Center of Vietnam Source: Agriculture Information Center of Vietnam 9 Horizon Securities
  • 10. Vietnam Agribusiness: From farm to chopsticks February 29th, 2008 II. Challenges and opportunities for Vietnam agribusiness Government reforms were successful in stimulating agricultural production to the extent that Vietnam moved from being a rice importer to the world’s second largest rice exporter. Despite positive strides in the sector, Vietnamese farmers still face many challenges and continue to operate with very limited capital. Outdated machinery is common and the majority of Vietnam's fields are still tended by non-mechanical means, mainly manual labor or water buffalo. Poor transportation systems and the lack of post-harvest handling, storage, and processing facilities are causing high spoilage rates. The MARD estimates that 20% of all production is lost due to inadequate storage and processing equipment. To sum up, since the late 1990’s Vietnam’s agribusiness increased owing to strong domestic demand for food and rising agri-exports. However, considering the need for investments in the sector and poor fixed asset base, we are concerned about the ability of Vietnam’s agribusiness companies to maintain margins amid surging soft commodities costs. We believe, however, that there will be significant growth opportunities for well positioned players all along the agribusiness value-chain, from farm inputs to retailers, as Vietnam’s agribusiness sector must increase production, yields, quality of products, processing capabilities, handling, packaging and logistics. Rising local consumption and export demand against supply-side constraints (limited land, water supply, low reserves, and weather) will necessitate farmers to increase yields. We believe this will drive the demand for farm inputs such as agrochemicals, seeds, and machinery. While there is no new capacity expected before 2010, the growing demand for fertilizer is leading to rising imports. We believe domestic fertilizer producers could benefit from a potential government “release” of domestic prices as these have yet to be aligned with world prices. We believe that as input costs increase, the ones to benefit will be those that can minimize price pressures from suppliers and/or customers. These are companies that have already started to integrate upstream and capable of securing stable input prices, and companies that have a strong brand name that can pass the cost onto consumers. Moreover, we believe there is an opportunity for corporations to set up large scale industrial farms and factory farms, as more flexible land reforms have opened the door to land consolidation and accumulation. Additionally, exports of food products can become a valuable growth driver for the agribusiness sector if Vietnam is able to improve price competitiveness, quality of products, and move towards higher-value products. Domestic producers must meet all the processes and hygiene requirements set by importing countries, regarding farming, harvesting, processing and packing. Over the past several years, Vietnam's urban economy has begun a steady transition from traditional open-air markets to modern supermarkets and shopping centers. Although early stage, this trend alone has increased the extent of the food value-chain. The success of large-scale retailing and food exports is depends on an efficient supply chain. As modern procurement systems invariably exert more demanding requirements from processors we see greater demand for cold storage, logistics, warehousing, and processing facilities. Finally, the urban middle-class accounted for 55% of the urban population in 2006, up from 33% in 2003. With a fast-growing urban middle-class and demand for higher value products in Vietnam’s cities, we believe there is an opportunity for branded FMCG food products. Added-value food products have had a tremendous growth in 2007; five of the ten fastest growing health and convenience products were food Vietnam moved from being a rice importer to the world’s second largest rice exporter Rising local consumption and export demand drive the demand for farm inputs …fast-growing urban middle-class and demand for high-value products in Vietnam’s cities create opportunity for branded FMCG food products 10 Horizon Securities
  • 11. Vietnam Agribusiness: From farm to chopsticks February 29th, 2008 goods. What’s more, brand-aware Vietnamese consumers are buying Vietnamese products; five of the ten fastest growing brands were Vietnamese in 2007. Figure 16. Top 10 growth categories (value growth % 2007 vs. 2006) Figure 17. Top 10 fastest growing brands 82% 68% 59% 57% 53% 51% 46% 45% 36% 32% 90% 80% 70% 60% 50% 40% 30% 20% 10% 0% Ready-to-drink tea Milk Pasterizeed Tonic drink Razor Insect trap Toner/ Astringent Sun protection Adult diaper Ice cream Milk powder for infant 17.0% 11.4% 10.3% 7.9% 7.7% 7.4% 6.4% 5.6% 5.1% 4.7% 18.0% 16.0% 14.0% 12.0% 10.0% 8.0% 6.0% 4.0% 2.0% 0.0% Khong do RTD Tea (THP) Vinamilk Ice cream Trang Tien Ice Cream Sting (Pepsi) Maggi (Soya sauce) C2 (RTD) Tw ister (Pepsi) Vinh Hue (Soya Milk) Chinsu (Soya sauce) Aji-Ngon (MSG) Source: TNS Worldpanel Source: TNS Worldpanel 11 Horizon Securities
  • 12. Vietnam Agribusiness fast facts 9 Vietnam ranks first in export of pepper, second in rice, coffee, cashew nuts, and top-five of natural rubber and seafood. 9 Rice productivity in Vietnam is at 4.89 tons per hectares one of the highest level in the world. 9 Average farm size in Vietnam is at 0.5ha; three hundred times lower than that in the US. 9 Paddy area has lost 6.5%, from 7.7mln ha in 2000 to 7.2mln ha in 2007. 51.5% of paddy land is in the Mekong Delta. 9 Since the “Economic Reform” in the 90s, share of agriculture in overall GDP has come down to more than 20% in 2006 from 40% in 1990. 9 Total investment in agriculture stands at 4.17% of GDP with public investment accounting for 2.19% of GDP. 9 The Government is now targeting 3.0-3.5% growth in agriculture over the next 5 years. The agriculture sector achieved a 4.1% CAGR over the past 10 years. 9 Total agro-forestry export value to grow at 12% pa to 2010. Export value in 2007 has already surpassed government’s targets for 2010. 9 60mln or 72.88% of the total population reside in Vietnam’s rural area. Agribusiness employs more than 55% of the country’s workforce. 9 10mln rural households, at the current household income level of US$1,000 pa, make up a sizable buying power. 9 In the past 5 years, the Government has stipulated Law on Land, Law on Cooperative, Law of Forest Protection & Development and many others regulations on framing and agriculture activities. 9 Vietnamese companies are now allowed to trade in commodities exchanges through local banks. 9 The list of 10 sensitive products, governed by the state, includes fertilizer, rice, foodstuffs, cement, steel, gasoline, sugar, salt, paper and medicines. 9 State finance system for agriculture includes Agriculture Bank, Bank for Public Policies and 926 public funds. 9 Only 50% of farmers have access to state credit system with preferential interest rates 7.2- 8.4% pa. 9 In 2006, the State’s spending on agriculture reached US$776mln, up 7% yoy. 9 The Government is spending VND157tln (US$9.8bln) to improve rural infrastructure – irrigation, roads, electrification, R&D and training. 9 Fisheries, industrial crops and food processing are the major focus areas for Vietnam’s agri-industry. 9 Fish farming production has increased nine-fold since 1990. 9 Since the beginning of 2007, exported rice and coffee prices have risen 40% and 32% respectively. 9 Price of rice increases 2x-3x along the supply chain due to poor infrastructure, inadequate storage and excessive intermediation. 9 Vietnam’s beer sales totaled US$2.2bln in 2007. The alcoholic drink industry has grown at 10% CAGR in the past 5 years. 9 Only 10% of agri-product in Vietnam is processed. The Government plan to increase the figure to 20% by 2010. 9 Food processing makes up 8.1% of industrial output and has been growing at 13% CAGR in the past 5 years. 9 Vietnam’s food retailing sector is a US$10bln, growing at 11% CAGR in the past 5 years. 9 Around 76mln (90%) Vietnamese people still shop at traditional wet market and groceries. 9 Co-op Mart is the leader in the retailing business with 27 supermarkets and plans to expand to 100 locations by 2010. 9 Metro Cash&Carry, BigC, Parkson, Lotte Department, Dairy Farm are already in Vietnam. While Wal- Mart, Carrefour have Vietnam in their expansion plans. 9 There are 36 listed companies in the agribusiness sector, on Ho Chi Minh Stock Exchange and Ha Noi Trading Center. 12 Horizon Securities
  • 13. Vietnam Agribusiness: From farm to chopsticks February 29th, 2008 Figure 18. Vietnam agriculture GDP to total GDP Figure 19. Vietnam agriculture output 1,200,000 1,000,000 800,000 600,000 400,000 200,000 - 1990 1991 1992 1993 1994 1995 1996 1997 1998 1999 2000 2001 2002 2003 2004 2005 2006 Total GDP (Bln VND) 45% 40% 35% 30% 25% 20% 15% 10% 5% 0% % Agricul ture, forestry and fishery to GDP 70,000 60,000 50,000 40,000 30,000 20,000 10,000 0 1990 1991 1992 1993 1994 1995 1996 1997 1998 1999 2000 2001 2002 2003 2004 2005 2006 Food Vegetable and bean Industrial crop Fruit crop Source: GSO Source: GSO Figure 20. Vietnam agriculture export mix Figure 21. Vietnam agriculture export vs. total export Fishery products Wood and wooden products Vegetables & fruit Other Rice Rubber Coffee 35,000 30,000 25,000 20,000 15,000 10,000 5,000 0 1995 1996 1997 1998 1999 2000 2001 2002 2003 2004 2005 Mi l l i o n U SD Total Agri Export Total Export Source: GSO Source: GSO Figure 22. World arable land per capita Figure 23. Vietnam arable land for paddy 800 700 600 500 400 300 200 100 0 Oceania North America Europe South America Sub-Saharan Africa Middle East & North Africa Central America & Caribbean Vietnam Popul a ti on (Mi l l i on) 1.8 1.6 1.4 1.2 1.0 0.8 0.6 0.4 0.2 0.0 Hecta r es o f a rabl e l a nd per capi ta Population Arable Land per capita 9,000.0 8,000.0 7,000.0 6,000.0 5,000.0 4,000.0 3,000.0 2,000.0 1,000.0 - 1990 1991 1992 1993 1994 1995 1996 1997 1998 1999 2000 2001 2002 2003 2004 2005 2006 2007 thousand ha Source: Earthtrends Source: GSO Figure 24. Vietnam arable land for perennial industrial crops Figure 25. Vietnam arable land for annual industrial crops 900 800 700 600 500 400 300 200 100 0 1990 1995 1996 1997 1998 1999 2000 2001 2002 2003 2004 2005 2006 2007E Thousand ha Sugar-cane Cotton Jute Sedge Peanut Soya-bean Tobacco 1,800 1,600 1,400 1,200 1,000 800 600 400 200 0 1990 1991 1992 1993 1994 1995 1996 1997 1998 1999 2000 2001 2002 2003 2004 2005 2006 Thousand ha Tea Coffee Rubber Pepper Cashew nut Coconut Source: GSO Source: GSO 13 Horizon Securities
  • 14. Vietnam Agribusiness: From farm to chopsticks February 29th, 2008 III. Listed agribusiness Of the 271 listed companies in Vietnam, there are currently 36 companies involved in the agribusiness value-chain. Agribusiness in Vietnam’s capital markets accounts for more than 18% of the total market capitalization. In addition, of the thirty largest market caps, agribusiness is the third most predominant industry after real estate and construction, and financial services. Given the sector’s significant contribution to Figure 26. HRS Agri-Index3 200 180 160 140 120 100 80 60 40 20 0 1/07 2/07 3/0 7 4/07 5/07 VN-Index_adj HASTCI_adj AGRI-Index_adj 6/07 7/07 8/07 9/07 10/07 11/07 12 /07 1/08 2/08 Source: HOSE, HASTC, Horizon Securities Vietnam’s GDP, we built a listed shares market cap weighted agribusiness index to track the performance of the companies involved along the food value-chain. There are four parts to the agribusiness value-chain; farm inputs, production, processing, and distribution/marketing. Most of the listed companies are mainly processors with some level of upstream and possibly downstream integration. Horizon Securities believes that as a leading commodities exporter Vietnam will face a host of challenges and opportunities from the current dynamics in the global agribusiness sector. Horizon Securities has sought out the listed agribusiness companies and has highlighted some of them in this report. Figure 27. HRS Agri-index covered stocks: Valuation comparables Net sales EBIT % yoy EBIT % yoy EBIT % yoy OPM Sales growth 2Y-CAGR FY05 FY06 FY07 FY05 FY06 FY07 FY07 Ticker Company name Subsector DPM.HM PVFCCo Fertilizer (urea) 2,537,555 3,050,829 3,779,038 22% 7 90,106 N/A 9 19,765 16% 1 ,269,695 38% 34% HSI.HM MF JSC Fertilizer (NPK) 137,778 389,476 656,894 118% 5 ,832 N/A 26,911 361% 5 6,200 109% 9% TSC.HM TSC Fertilizer (trading) 879,702 1,138,957 1,375,090 25% 4 ,620 179% 1 2,511 171% 8 6,267 590% 6% HAI.HN HAI Crop protection 358,864 415,502 496,545 18% 4 4,600 N/A 29,648 -34% 4 6,080 55% 9% NSC.HM NSC Seed 102,579 96,552 140,388 17% 8 ,957 N/A 6,062 -32% 1 2,708 110% 9% SSC.HM SOUTHERN SEED Seed 127,919 129,861 155,857 10% 2 9,280 10% 2 4,654 -16% 2 4,957 1% 16% TRI.HM TRIBECO SAIGON Berverage 306,451 293,779 384,639 12% 7 ,095 -24% 1 6,095 127% 1 7,421 8% 5% SCD.HM CHUONG DUONG BEV. Berverage 148,021 194,485 238,894 27% 1 7,932 N/A 18,625 4% 2 0,238 9% 8% VTL.HN THANG LONG JSC Berverage 7 2,116 63,390 75,164 2% 1 1,696 13% 1 1,099 -5% 1 0,782 -3% 14% VDL.HN LAM DONG FOOD Berverage 1 36,174 130,238 151,845 6% N/A N/A N/A N/A 1 0,398 N/A 7% IFS.HM INTERFOOD Berverage 507,213 641,686 723,272 19% 6 7,913 N/A 71,363 5% 8 6,808 22% 12% VNM.HM VINAMILK Dairy 5,638,784 6,619,102 6,821,864 10% 5 24,448 2% 5 94,186 13% 6 71,963 13% 10% HNM.HN HANOIMILK Dairy 288,076 327,972 323,829 6% 2 6,411 N/A 18,149 -31% 2 0,231 11% 6% KDC.HM KINH DO CORP Confectionery 798,617 998,149 1,233,119 24% 1 11,219 10% 1 31,881 19% 1 56,464 19% 13% NKD.HM NORTH KINH DO Confectionery 354,789 419,429 561,580 26% 4 3,824 49% 5 5,506 27% 6 9,406 25% 12% BBC.HM BIEN HOA CONF. Confectionery 285,362 341,331 453,975 26% 1 8,854 24% 1 9,022 1% 2 2,998 21% 5% HHC.HN HAI HA CONF. Confectionery 330,058 325,830 341,248 2% 1 6,800 N/A 18,957 13% 2 2,975 21% 7% ABT.HM BENTRE AQUATEX Aquaculture 282,433 331,215 429,706 23% 9 ,996 79% 2 6,627 166% 3 2,397 22% 8% ICF.HM INVESTMENT COM. Aquaculture 281,202 283,154 326,025 8% 1 2,441 N/A 23,070 85% 2 5,122 9% 8% ANV.HM NAM VIET CORP Aquaculture 1,212,316 2,707,076 3,193,437 62% N/A N/A 2 99,334 N/A 3 90,237 30% 12% MPC.HM MINH PHU SEAFOOD Aquaculture 2,027,425 1,352,531 N/A N/A N/A N/A 98,861 N/A N/A N/A N/A VHC.HM VINH HOANG Aquaculture 507,014 1,516,245 1,789,557 88% 6 ,903 N/A 98,579 1328% 1 42,636 45% 8% AGF.HM AN GIANG FISH. Aquaculture 786,182 1,190,906 1,233,734 25% 3 0,484 8% 5 2,339 72% 4 6,277 -12% 4% ACL.HM CUU LONG FISH. Aquaculture 88,475 311,275 537,449 146% N/A N/A 4 1,022 N/A 6 5,271 59% 12% TS4.HM SEAFOOD NO.4 Aquaculture 83,880 151,827 172,904 44% 3 ,623 -13% 6 ,546 81% 7 ,850 20% 5% SJ1.HM SEAFOOD NO.1 Aquaculture 130,781 147,895 145,553 5% 5 ,650 N/A 4,980 -12% 6 ,240 25% 4% FMC.HM SAO TA FOOD Aquaculture 970,807 925,197 999,764 1% 3 7,581 N/A 33,782 -10% 3 6,511 8% 4% FBT.HM FAQUIMEX Aquaculture 373,460 457,661 N/A N/A 21,331 N/A 35,912 68% N/A N/A N/A LAF.HM LAFOOCO LONG AN Aquaculture 784,550 699,904 626,503 -11% 1 7,390 -55% ( 14,139) -181% 3 5,453 351% 6% SGC.HM SA GIANG IM. Food processor 98,100 88,489 118,917 10% 1 5,013 N/A 16,840 12% 1 7,671 5% 15% SAF.HM SAFOCO Food processor 203,970 272,065 333,205 28% N/A N/A 8 ,411 N/A 1 0,429 24% 3% CAN.HM HALONG FOOD Food processor 191,255 204,206 309,086 27% 1 0,647 84% 1 1,289 6% 1 3,074 16% 4% TAC.HM TUONG AN OIL Cooking oil 1,181,594 1,515,469 2,554,229 47% 2 2,333 N/A 28,868 29% 1 02,790 256% 4% LSS.HM LAM SON SUGAR Sugar 6 51,976 626,661 813,958 12% N/A N/A 1 15,718 N/A 1 18,805 3% 15% BHS.HM BIEN HOA SUGAR Sugar 540,656 766,123 643,945 9% 5 3,292 22% 6 9,429 30% 4 4,783 -35% 7% SBT.HM BOURBON TAYNINH Sugar 629,791 679,860 674,272 3% 1 19,365 173% 1 73,847 46% 1 49,109 -14% 22% Source: Horizon Securities, Reuters, company’s report 3 Horizon Securities clients can contact their account manager to get more information on how they can invest in the same proportions set out in any of the HRS Indices. 14 Horizon Securities
  • 15. Vietnam Agribusiness: From farm to chopsticks February 29th, 2008 Figure 28. Vietnam: Agribusiness value chain Farm Input Production Processing Distribution • Fertilizers • Plantation • Meat processing • Logistics • Crop protection • Crop production • Aquaculture • Strorage • Seed • Fishery • Confectionary • Suppermarkets • Machinery • Livestock • Sugar • Hypermarkets DPM Petrovietnam HSI General Fertilizer TSC Techno–Agricultural HAI H.A.I JSC NSC National Seed SSC Southern Seed ABT Ben Tre Aquaproduct ICF Investment Commerce ANV Nam Viet Fisheries MPC Minh Phu Seafood VHC Vinh Hoan AGF An Giang Fisheries ACL Cuu Long Fisheries TS4 Seapriexco 4 LSS Lam Son Sugar BHS Bien Hoa Sugar TRI Tribeco Sai Gon SCD Chuong Duong Beverage VTL Thang Long Wine VDL Lam Dong Foodstuffs KDC Kinh Do Corp. NKD North Kinh Do BBC Bien Hoa Confectionary SBT Sucrerie De Bourbon TN HHC Hai Hai Confectionary SJ1 Seafood No. 1 FMC Sao Ta Food FBT Ben Tre Forestry LAF Lafooco Long An IFS Interfood SGC Sa Giang Import Export SAF SAFOCO CAN Canfoco Ha Long TAC Tuong An Oil VNM Vietnam Diary Products HNM Ha Noi Milk Source: Horizon Securities 15 Horizon Securities
  • 16. Vietnam Agribusiness: From farm to chopsticks February 29th, 2008 IV. Farm input The farm input segment includes companies engaged in fertilizers, crop protection (such as pesticides, fungicides, and insecticides), farming machinery, seed, and feed. These products help to enhance the productivity of land, crops, and animal husbandry. The key drivers for this sector involve the increasing concerns for higher productivity yields resulting from rising food demand against depleting arable land. We believe the rising income in Vietnam’s rural areas will help farmers deal with the current rise in prices of farm inputs. Figure 29. Listed companies in farm input sector Ticker Name Sector Market Cap. (VND’mln) Net sales (VND’mln) EBITDA Margin The key drivers for this sector involve the increasing concerns for higher productivity yields resulting from rising food demand against depleting arable land Net Profit Margin ROA ROE DPM.HM PVFC Urea fertilizer 21,470,000 3,779,038 NA 35.0% 21.3% 29.3% HSI.HM General Fertilizer NPK fertilizer 275,000 656,894 NA 3.8% 5.2% 31.8% TSC.HM TSC Fertilizer trading 694,128 1,375,090 NA 5.0% 17.8% 57.3% HAI.HN HAI Crop protection 558,600 496,545 9.5% 10.3% 14.3% 30.2% NSC.HM National Seed Seed 123,840 140,388 9.9% 9.6% 12.6% 20.2% SSC.HM Southern Seed Seed 421,000 155,857 NA 14.1% 14.8% 18.1% Source: Horizon Securities, company’s data 4.1 Fertilizer sector in Vietnam: relying heavily on imports Increasing at a 4.5% CAGR over the past 5 years, by 2007 Vietnam’s aggregate fertilizer demand had reached 6.2 million tons. Due to insufficient domestic production capacity, the country has to import more than 61% of the yearly demand, making it one of the biggest fertilizer importers in the world. In order to encourage local production, the government has accorded a number of favorable policies to fertilizer producers, such as low VAT (5%), subsidies on transportation and raw material costs, and privileged access to natural resources. Since fertilizer is on the list of the ten key products4 under the government’s “price management”, the government “recommends” a selling price range to local producers. The end result is that fertilizer prices in Vietnam have not moved in step with the world prices. In 2007, as the international urea prices had surged by 104% year-over-year, local prices increased by just about 20%. Although revenues have been capped, local producers are able maintain their profit margins thanks government subsidies and low raw material costs. As Vietnam fulfills its WTO’s agreements and more state-own enterprises are privatized, we expect less price controls and subsidies from the state. Figure 30. Local fertilizer production Figure 31. Vietnam’s fertilizer import 3,000 2,500 2,000 1,500 1,000 500 - 10% CAGR 2000 2001 2002 2003 2004 2005 2006 2007 4,500 4,000 3,500 3,000 2,500 2,000 1,500 1,000 500 - Vietnam has to import more than 61% total fertilizer consumption… making it biggest fertilizer importers in the world. Phu My Fertilizer commenced operation 2001 2002 2003 2004 2005 2006 2007 '000 tons Urea (N) Phosphate (P) Potash (K) NPK Others Source: Vietnam Fertilizer Association Source: GSO 4 10 products include: fertilizer, food, food stuffs, cement, steel, gasoline, sugar, salt, paper and medicines 16 Horizon Securities
  • 17. Vietnam Agribusiness: From farm to chopsticks February 29th, 2008 Urea market (N) The state monopolizes Vietnam’s urea market. Although there are hundreds of fertilizer trading companies, there are only two urea producers; Petrovietnam Fertilizer & Chemicals Plc. (PVFC), listed on HOSE, and Habac Nitrogenous Fertilizers & Chemical Ltd. (HANICHEMCO), which is a subsidiary of the state-owned conglomerate, Vietnam National Chemical Corporation (VINACHEM)5. In 2007, Vietnam consumed more than 1.7mln tons urea, 45% of which was imported, mainly from China. The Ministry of Agriculture and Development estimates urea demand to increase by 8% per year to 2.1mln tons by 2010. Because demand still outstrips the domestic supply, we believe that in the short-run, local prices will continue to increase despite the government’s effort to minimize the increase. Moreover, China, the largest fertilizer exporter to Vietnam, in a bid to ensure supply to its farmers, decided last month to raise export tariffs on urea fertilizer. By 2010, the Hanoi plans to establish two more state-owned fertilizer companies with a total built up production capacity of 1.3 million tons of urea per year, hence providing enough supply to the market. Figure 32. Fertilizer prices Figure 33. Local supply vs. demand 600 500 400 300 200 100 - Sep-02 Dec-02 Jun-03 Sep-03 Mar-03 Jun-04 Sep-04 Mar-04 Dec-03 Jun-05 Sep-05 Dec-04 Mar-05 Jun-06 Sep-06 Mar-06 Dec-05 Jun-07 Sep-07 Dec-06 Mar-07 Dec-07 VN UREA WORLD UREA 3,000 2,500 2,000 1,500 1,000 500 - (500) (1,000) (1,500) …urea demand is estimated to increase by 8% CAGR to 2.1mln tons by 2010 2008 2009 2010 Total Demand Total Local Supply Shortage/Surplus Source: Reuters, Price Department Source: Vietnam Fertilizer Association Figure 34. Market share 2007 Figure 35. Market share 2010 Phu My Fertilizer 45% Ha Bac Fertilizer 10% Import 45% Phu My Fertilizer 37% Ha Bac Fertilizer Ca Mau Fertilizer Ninh Binh Fertilizer 7% 23% 33% Source: Horizon Securities, Vietnam Fertilizer Association Source: Horizon Securities, Vietnam Fertilizer Association PVFC Fertilizer (ticker: DPM.HM) opened its urea production plant in 2004, and has been listed on HOSE since November 2007. With its current capacity of 740,000 tons per year, PVFC accounts for more than 45% of total urea consumption in Vietnam. To secure its position in the market, PVFC has recently invested US$50 million in a new production facility, which will add 125,000 tons to PVFC’s total production in 2010. 5 www.vinachem.com.vn. VINACHEM is the largest corporation in the chemical industry in Vietnam, owning more than 40 companies in fertilizer, crop-protection, rubber, oil refinery, and various chemical sectors. 17 Horizon Securities
  • 18. Vietnam Agribusiness: From farm to chopsticks February 29th, 2008 Raw material for nitrogen fertilizer is abundant The main raw materials for urea production are coal or natural gas, which contribute more than 90% of total production costs. For economic and environmental reasons, natural gas is the feedstock of choice. According to Cedigaz, Vietnam has around 400 billion cubic meters of proven natural gas reserves. Current production level is about 7 billion cubic meters per annum. The country has discovered four gas fields, including the Bach Ho Oil Field, Nam Con Son Gas Basin, May Lay Tho Chu Basin and Song Hong (Red River) Basin. Beside these projects, many companies are carrying exploration activities to prove more gas reserves offshore Vietnam. PVFC is using natural gas in the production while HANICHEMCO, since 1960, has been using coal-based production. PVFC’s natural gas consumption is currently around 53,000-54,000 metric tons per hour, which it gets from the Bach Ho (White Tiger) Oil Field and Nam Con Son Gas Project. The company has secured a long-term agreement with the state to purchase natural gas at US$2.2 per million BTU until 2012, and US$3.6 per million Figure 36. Vietnam gas reserve and production 8.0 7.0 6.0 5.0 4.0 3.0 2.0 1.0 0.0 36% CAGR 1991 1992 1993 1994 1995 1996 1997 1998 1999 2000 2001 2002 2003 2004 2005 2006 billion cubic meter 450 400 350 300 250 200 150 100 50 0 Gas reserve Gas production Source: Horizon Securities BTU thereafter. Other types of fertilizers – Phosphate (P2O2), Potash (K2O), NPK Vietnam is self-sufficient for the production of super-phosphate (OSP); but due to the scarcity of phosphate and salt deposits, the country is unable to produce DAP and potash fertilizers. Annual consumption of these fertilizers has reached more than 2 million tons; mainly imported from China. The Ministry of Planning and Investments forecasts that demand will continue growing at 3% to 5% annually until 2010. The state-owned Vinachem operates thirteen fertilizer companies, which dominate 60% of the NPK processing market. Other major producers in this sector include the General Biochemistry Fertilizer (ticker: HSI.HM), the Vietnam-Japan Fertilizer (Japan), the Tan Hung Fertilizer Ltd., and the Proconco JV (France). The General Biochemistry Fertilizer Co. (ticker: HSI.HM) recently expanded its total production to 480,000 tons per year, enough to cover 15% of the domestic NPK demand. Revenue in 2007 reached US$41mln, up 86% yoy. Management announced its intention to move into other agrochemical markets and has invested US$0.72 million in a new insecticide factory. The company also plans to invest over US$40 million into two infrastructure projects; an industrial park and a port. The Techno-Agricultural Supplying Co. (ticker: TSC.HM) is a fertilizer trading company. As such it imports more than 10% of Vietnam’s total fertilizer imports. Sales for 2007, reached US$86 million up 21% over the previous year. Management decided to establish a new securities brokerage house in the Mekong Delta region, the Can Tho Securities JSC, which will start operations in the first quarter of 2008. 4.2 Crop protection The crop protection industry includes pesticides, fungicides, and insecticides. Rising health and environmental concerns, and tougher regulations over the use of these chemicals have caused world crop protection sales to drop by 2.5% to US$30.4 billion. The most significant reduction in crop protection sales was in the NAFTA region loosing 5.3%, followed by Asia, which fell by 4.1%. Global growth expectations remain low at 1-2% over the next five years. Vietnam has around 400 billion cubic meters of proven natural gas reserves In Vietnam, PVFC is using natural gas in the production while HANICHEMCO, since 1960, has been using coal-based production …annual consumption is around 2mln ton, mainly imported from China… demand continues to grow at 3-5% annually to 2010. 18 Horizon Securities
  • 19. Vietnam Agribusiness: From farm to chopsticks February 29th, 2008 Every year Vietnam consumes more than 9 million tons of crop protection chemicals, mainly pesticides. Vietnam’s Plant Protection Department estimates that more than 95% of farmers excessively use pesticides. In the context of the tainted food scandals in China, the misuse of chemical pesticides may have a serious detrimental effect on Vietnam’s agri-exports. Industry analysts estimate that consumption of chemical crop protection products in Vietnam will gradually decrease in the future. The key local players in the industry include; H.A.I JSC (ticker: HAI.HM), An Giang Pesticide (AGPPS), Sai Gon Pesticide (SPC), the Microbiological & Chemical Industry JSC (BICICO) and Vietnam Pesticide JSC (VIPESCO). HAI has a very small production capacity; it mainly buys pesticides in bulk then re-packages in bottles and distributes them to the market. The company estimates it holds about 10% market share. In 2007, HAI sales reached VND496.5 billion (US$31 million), representing a 19.5% increase over the previous year. 4.3 Opportunities for the seed sector According to Phillip McDougall, in 2006 the value of the market for agriculture biotechnology based products, which currently comprises sales of seed of herbicide tolerant (HT) and insect resistant (IR) crops, continued to advance by 14.2% to US$6,050 million. The market for biotech crops is expected to continue to expand, both through the adoption of advanced traits and uptake in further country markets, particularly in Asia. The Vietnamese government allows local and foreign companies to sell genetically modified seeds as long as they comply with the state regulations. In Vietnam, there are more than 65 domestic and foreign companies operating in the seed sector; most of them are either state-owned companies or governmental research centers. Global industry leaders have made headway into the country; namely Bayer Cropscience, Monsanto, and Syngenta. Figure 37. Growth of the biotech crop market in the world 7,000 6,000 5,000 4,000 3,000 2,000 1,000 0 1996 1997 1998 1999 2000 2001 2002 2003 2004 2005 2006 $ million Source: World Fertilizer Association Of the domestic companies, only three have the capabilities to produce seeds themselves. Two of these companies are listed; they are the National Seed JSC (ticker: NSC.HM) and the Southern Seed JSC (ticker: SSC.HM). Established in 1968, the National Seed JSC currently operates three production plants, and an experimental farm. The company’s main products include rice, maize, vegetable, and sweet potato seeds. Its main markets are in the North of Vietnam and Laos. Total revenue in 2007 was VND140.4bln (US$8.7mln), a 45.4% increase over 2006. The company recently raised capital to acquire other domestic seed companies, and to invest in an industrial park in the North of Vietnam. The Southern Seed Co. produces rice, maize, beans, bitter melons, cucumbers and watermelons seeds mainly for the South of Vietnam. Total revenue in 2007 was VND155.9bln (US$9.7mln), up 20.0% year-over-year. The company also has announced significant investments to acquire a research center and two experimental farms. Management recently announced the acquisition of Ha Tay Seed Co., and the development of a seed production facility in Ha Noi. The Company also acquired a 49% stake in an office building in HCMC. In Vietnam, there are more than 65 companies operating in the seed industry; most of them are either state-owned companies or governmental research center. 19 Horizon Securities
  • 20. Vietnam Agribusiness: From farm to chopsticks February 29th, 2008 Figure 38. List of registered seeds in Vietnam Type Code Companies Paddies LC93-1 Syngenta Vietnam Maize WAX44 Monsanto Thailand Maize DEKALB 979 Monsanto Thailand Maize DEKALB 959 GM Paddies Research Center GM Paddies HYT 83 GM Paddies Research Center Paddies HYT 100 Thai Agriculture Department Paddies PRACHIBURI Quoc Hao Co. (China) GM Paddies Kim Uu 75 Thai Binh Seed Paddies TBR-1 Luong Nong Co. (China) Maize LNS 222 Agriculture University of Vietnam Paddies Huong Com Southern Seed (SSC) Maize MX10 Southern Seed (SSC) Paddies N46 Agriculture Development Center GM Paddies CNR36 High-tech Agriculture Co. (China) GM Paddies D ưu 725 Quoc Hao Co. (China) Paddies Nghi Huong Uu 725 Quoc Hao Co. (China) Peanut TB25 Thai Binh Seed Paddies TBR 18 Thai Binh Seed Paddies BC15 Thai Binh Seed Paddies Thuc Hung 6 Thuc Hung Co. (China) Paddies B-TE 1 BAYER Cropscience AG Paddies Ha Uu 108 Vietnam-China Co. Paddies KOSHIHIKARI H3 HONDA Motor Co. Maize NK 4300 Syngenta Vietnam Maize NK 67 Syngenta Vietnam Maize NK 66 Syngenta Vietnam Maize DKC 9301 Monsanto Thailand GM Paddies Khang Dan National Seed (NSC) Source: Horizon Securities, VSTA 4.4 Farming machinery There are no listed companies in this segment. The domestic production is still dominated by the state-owned Vietnam Engine and Agriculture Machinery Corporation (VEAM), and 15 of its subsidiaries. Some of VEAM’s companies have already been privatized. The Agriculture Production Department of Vietnam estimates that the current machinery utilization rate in agriculture is less than 30%. Prices for agriculture equipments are still out of reach for many farmers in Vietnam; a tractor costs up VND100 million (US$6,250) while a harvester sells for VND20 million (US$1,250). Moreover, the country-wide average farm size of 0.5 hectares, coupled with the fact that many farms hold two to five plots of land scattered in different locations, deter household farms from buying expensive machinery. Greater land consolidation, increasing urbanization, and the rural exodus to big cities will drive the need for greater mechanized farming. We believe the rise of industrial farming and co-operatives holding larger plots of land will trigger growth in machinery usage, while better access to bank financing and economies of scales will make farming machinery more affordable to farmers. The Ministry of Industry estimates that total farming machinery production will grow at an average 12% per year to reach VND3,280bln (US$205mln) by 2015. Country-wide as of 2007, there are 145,805 tractors, 793,400 water pumps, 288,400 rice threshers and 257,500 boats. The Ministry of Industry expects that by 2015 Vietnam will need 830,565 tractors, 12,450 harvesting machines, 4,350,570 water pumps and 525,844 boats. Current machinery utilization rate in agriculture is less than 30%. …we believe there will be increasing demand for tractors, pumps, planting and harvesting machine 20 Horizon Securities
  • 21. Vietnam Agribusiness: From farm to chopsticks February 29th, 2008 4.5 Animal feed The Livestock Department of Vietnam estimates there are 241 feed trading and manufacturing companies in Vietnam (82.2% local, 13.7% foreign invested and 4.1% joint venture companies), none of which are listed. The leading industry players are the large global agribusiness companies, namely Cargill (US), CP Group (Thailand), Proconcon (France) and Uni-President (Taiwan). To produce commercial animal feed, Vietnam has to rely on imported corn since local corn production is insufficient and local ingredients are usually more expensive than imported ones. The animal feed industry is the driver of corn consumption in Vietnam; feed accounts for about 80% of total corn consumption in the country. Vietnam produces around 10 million tons of feed annually, with only 33% commercially manufactured. To feed the livestock that will supply Vietnam’s growing demand for meat, feed grain production will have to be increased. The Livestock Department of Vietnam believes that by 2010, total demand for animal feed will reach 16-17 million tons per year. V. Resource producers 5.1 Crop production: Opportunities for large-scale farming enterprises There are no listed companies in this sector; most players are cooperative or state-owned companies. Key players in this industry include the Vietnam Northern Food Corporation (Vinafood 1), Vietnam Southern Food Corporation (Vinafood 2), Song Hau Food Processing JSC (Sohafood), Codo State Farm Export-Import (Codofarm), VinhLong Cereal and Food Import-Export JSC (Vinhlong Food), An Giang Import-Export Co., Gentraco Feed JSC (Gentraco), Tien Giang Food Co. (Tigifood), Long An Food Co. (Longanfood), An Giang Agriculture and Foods Import-Export Co. (An Giang Afiex) and Dong Thap Foods - Agriculture Co. (Dargrimex). Fragmented agriculture One of the most important undertakings of the state, in regards to agriculture and food safety, has been to increase rice quality and yields. Through successful seed management and selection, Vietnam has been able to develop new, pest-resistant, rice varieties which have significantly increased the country’s yields per hectare. Today, Vietnam’s paddy yields are above world standards. Though the land allocated to rice culture has diminished, the rice yield and production has increased. Today’s rice production is of better quality and higher efficiency than ever and production has been increasingly tied to the market requirements. In addition, the country has been able to increase its rice exports to approximately 20% of its total rice production. At 0.1 ha per capita, Vietnam has one of the lowest arable land per capita ratio in the world. In addition, total arable land in Vietnam has been under pressure from greater Figure 39. World paddy yield 10,000 8,000 6,000 4,000 2,000 - Egypt US China Vietnam World India Paddy (k g/h a ) Source: FAO industrialization and urbanization. Between 2000 and 2006, the total area allocated to rice cultivation decreased by almost 6.5%, as farmers allocate land to more valuable crops. Over 70% of Vietnam’s population lives in rural areas, and there are more 10 million household farms throughout the country. The country-wide average arable land size per farm is 0.5 ha. Farms in the Mekong Delta are bigger than in the North, with an average size of 1.2 ha. In addition, the degree of fragmentation in the South is less of a problem, with many farmers having only one plot. Household farms are considered 21 Horizon Securities
  • 22. Vietnam Agribusiness: From farm to chopsticks February 29th, 2008 the basic economic farm unit. Small farm size and fragmentation of land are some of the main obstacles to increasing productivity and economies of scale in Vietnam. Emerging trends from land reforms Thanks to more flexible land reforms, which have facilitated leasing of land, allowed larger holding size and provided longer use rights, a trend towards greater land consolidation and accumulation has emerged. There is evidence that a “land market” has emerged in every region of Vietnam with activities including renting and leasing land, lending and borrowing land, “‘buying”’ and “selling” Land Use Rights, land exchange and bidding for land. Additionally, recent government policies support the notion of larger farms that will permit the concentration of land and capital. There are currently about 113,000 commercial farms with an average land area of 5 hectares throughout the country, this represent an 86% increase over 2001 figures. We believe this is an important development which will facilitate the development of larger industrial farms. 5.2 Contract farming6 Although first attempts of contract farming were unsuccessful, the state has indicated that it supports the concept as a means to link farmers to market demands. Consequently, the government passed Decision 80/2002/ TTg in 2002, to promote the consumption of agricultural products through signed contracts between enterprises and farmers. Private involvement in contract farming is not a novelty. While success stories vary greatly between types of commodities and geographic localities, there have been some encouraging developments. According to the Ministry of Agriculture and Rural Development (MARD) the majority of rice, maize, sugar cane, and most other industrial crops output is produced under contract farming. Also, we have seen some companies such as Charoen Pokphand (C.P.) Group, Lam Son Sugar and Sugarcane Company (LSS:HM), Angimex-Kitoku JVC, Antesco already integrating upstream and securing with farmers timely access to raw materials. VI. Processing There are 30 listed companies involved in the processing segment of the agri-food value-chain. 6.1 Dairy Products: Uptrend demand and low level of substitute Key players in the industry include two listed companies: Vinamilk (ticker: VNM.HM), and Hanoimilk (ticker: HNM.HN). Other players include Dutch Lady Vietnam, and some joint-ventures F&N Vietnam Foods Co., and Nestle Vietnam. Figure 40. Listed companies in milk sector Ticker Name Market Cap. (VNDmln) Net sales (VNDmln) EBITDA Margin Net Profit Margin ROA ROE HNM.HN HANOIMILK 173,418 323,829 NA 3.7% 5.0% 8.2% VNM.HM VINAMILK 19,981,426 6,821,864 NA 14.2% 21.6% 27.4% Source: Horizon Securities, company’s data Vietnam’s dairy consumption is one of the fastest growing food segments in the country. Current dairy consumption is around 9kg per annum and dairy product consumption has been growing at 16.3% CAGR from 2004 to 2006. Local supply only meets about 22% of the demand for dairy products. Vinamilk purchase about 60% of fresh milk produced in Vietnam. Dutch Lady collects another 20% while the rest is bought by a number of smaller companies. Vietnam currently imports dairy 6 Contract farming can be defined as an agreement between farmers and processing and/or marketing firms for the production and supply of agricultural products under forward agreements, frequently at predetermined prices. The arrangement also invariably involves the purchaser in providing a degree of production support through, for example, the supply of inputs and the provision of technical advice. The basis of such arrangements is a commitment on the part of the farmer to provide a specific commodity in quantities and at quality standards determined by the purchaser and a commitment on the part of the company to support the farmer’s production and to purchase the commodity. (FAO, 2001) Local supply only meets about 22% of the demand for dairy 22 Horizon Securities
  • 23. Vietnam Agribusiness: From farm to chopsticks February 29th, 2008 from various countries including, notably the United States, Australia, Korea, and the Netherlands. Figure 41. Vietnam: production of milk by province Unit: tons Year Provinces 2001 2002 2003 2004 2005 Vietnam 64,703 78,453 126,697 151,314 197,679 Red River Delta 4,958 7,032 9,865 12,218 14,098 North East - 33 482 2,739 6,803 North West 4,026 4,550 5,934 7,677 7,820 South Central Coast 365 414 670 971 739 Central Highlands 998 1,673 2,566 3,827 4,853 South Central Coast ex. HCMC 9,814 13,058 16,110 19,711 26,802 Ho Chi Minh City 44,540 51,691 90,264 104,160 130,054 Mekong River Delta 1,871 4,353 5,766 7,859 11,723 Source: MARD Vinamilk (ticker: VNM.HM) is the leading company in the industry with 183 distribution centers and more than 94,000 outlets throughout Vietnam. The company’s current capacity is 491 million litres per year. Net income in 2007 increased 32% yoy. The company has captured 40% of the powder milk market, it dominates 90% of the yogurt market, and 73% of the condensed milk market. In October 2007, Vinamilk acquired a 55% stake in the Lam Son Dairy JSC a small dairy company in northern Vietnam with a capacity of 20,000 litres per year. Hanoimilk (ticker: HNM.HN) is the third largest dairy producer and the largest in northern Vietnam. The company’s total production capacity is 80 million liters per year. Hanoimilk focuses on producing sterilized fresh milk for children between 7–12 years old; a market of which it holds 25-28%. Net profit in 2007 increased by 66.5% compared to the previous year. In August 2007, the company signed a strategic partnership agreement with Maeil, one of Korea’s leading dairy companies, in which Maeil would acquire a 10% stake in Hanoimilk. Hanoimilk’s products have recently been picked-up by Hapro, a state-owned retail and supermarket distribution business, which will distribute them in its stores. 6.2 Sugar industry: Under government’s “price management” Figure 42. Listed companies in sugar sector Ticker Name Market Cap. (VNDmln) Vinamilk acquired a 55% stake in the Lam Son Dairy JSC a small dairy company in northern Vietnam Hanoimilk signed a strategic partnership agreement with Maeil, one of Korea’s leading dairy companies Net sales (VNDmln) EBITDA Margin Net Profit Margin ROA ROE BHS.HM BIEN HOA SUGAR 614,942 643,945 NA 8.3% 8.5% 14.6% LSS.HM LAM SON SUGAR 900,000 813,958 21.9% 10.0% 9.7% 14.5% SBT.HM SUCRERIE DE BOURBON TAY NINH 1,021,991 674,272 32.5% 28.4% 11.8% 12.6% Source: Horizon Securities, company’s data Vietnam has 37 sugar processors with a total capacity of 1.05 million tons per year. In 2007, local producers manufactured 0.97 million tons, about 75% of the domestic demand. As a result, domestic sugar production fails to meet the continuously increasing demand in the beverage and confectionery sectors. The country has to import around 0.3-0.4 million tons each year. 23 Horizon Securities
  • 24. Vietnam Agribusiness: From farm to chopsticks February 29th, 2008 Figure 43. Sugar market is highly fragmented Figure 44. Domestic sugar price in the past 2 years Others, 58.6% Bien Hoa Sugar, 7.6% Nghe An Tate & Lyle Sugar JV, 7.6% Lam Son Sugar Vietnam Taiwan 5.3% Nagarjuna Intl 5.5% 9.0% Sucrerie De Bourbon Tay Ninh, 6.4% 14,000 12,000 10,000 8,000 6,000 4,000 2,000 - Jan-0 6 Jul-06 Apr-06 Jan-0 7 Oct-06 Jul-07 Apr-07 VND Sources: Horizon Securities, VASP Sources: MARD The sugar industry is one the ten key industries of the state; therefore, Hanoi has historically imposed high import tariffs. Vietnam’s WTO engagements require the country to reduce sugar import tariffs. Figure 45. Vietnam: tariff reduction roadmap in compliance with WTO items 2005 2006 2007 2008 2009 2010 Raw sugar 30% 30% 30% 20% 10% 5% Refined sugar 40% 40% 30% 20% 10% 5% Source: Horizon Securities, Vietnam Tax Authorities Lam Son Sugar (ticker: LSS.HM) is Vietnam’s biggest sugar producer, with two processing plants and a total capacity of 110,000 tons. The company controls approximately 9% of the market. The company secures supply of sugar cane through contract farming on more than 18,000 hectares. Management recently announced it would diversify the company’s business into banking and insurance and in setting up a private higher education institution. Management also intends to set up a dairy farm. Bien Hoa Sugar (ticker: BHS.HM), the second largest sugar company in Vietnam, has a capacity of 90,000 tons. In 2007, the company produced approximately 75,000 tons of sugar to capture 7.6% market share. It is currently the main sugar supplier to the leading domestic food & beverage companies, notably, Vinamilk, Nestle, Coca- Cola, and Pepsi. To ensure supply of raw material, the company contracted out, a total area of 6,900 ha for growing sugar cane. In addition, the company owns 1,000 ha on which it grows sugar cane for its own production. In November 2007, BHS successfully acquired Tri An Sugar Co. The factory has been upgraded and will be put into operation in early 2008. Management announced a US$62.5 million investment to build an integrated sugar/ethanol processing plant. The “The West Vam Co Dong Industrial Processing Park” will cover an area 38 hectares and include: • a sugar processing plant with a 6,000TMN capacity (expected to be completed by the end of 2009); • an ethanol plant with capacity of 220,000 liters per day (expected to be completed in 2008); • a furfural alcohol factory; • a fertilizer factory; • an animal feed factory; and • shipping docks and port facilities. The project began in October 2007, and Bien Hoa is currently involved in site clearance. Sucrerie De Bourbon Tay Ninh (ticker: SBT.HM) holds 6.4% of the total domestic sugar market. Similarly to Lam Son Sugar and Bien Hoa Sugar, the company has Jan-08 Oct-07 Lam Son Sugar controls approximately 9% of the market 24 Horizon Securities
  • 25. Vietnam Agribusiness: From farm to chopsticks February 29th, 2008 contracted farmers over an area of 14,500 hectares; to grow sugar cane. Contributing 90% to total sales, the Mimosa Sugar brand is the company’s major source of revenue. Total revenue in 2007 rose 13% compared to 2006. Management plans to invest over US$65 million to build a 504 million kWh per year thermal power plant, and a 30 million liters per year ethanol factory. 6.3 Confectionery: Severe competition among rivals Vietnam’s confectionery industry is extremely fragmented, with hundreds of small regional producers. Major players count about 30 companies. Competition is intensifying as larger players have been spending heavily on advertising and marketing campaigns. Over the past five years, Vietnam’s confectionery industry has grown at an average rate of 7%. Driven by greater disposable income, consumption per capita reached 2kg per year in 2007 Figure 46. Key player market shares BBC 7.0% NKD 11.0% HHC 6.5% Others 53.0% KDC 20.0% IFS 2.5% Source: Horizon Securities estimate up from 1.25kg per year in 2003. Industry sales are seasonal as consumption increases significantly from the Mid-Autumn Festival (September) to Vietnam’s New Year (late January to mid-February). Figure 47. Listed companies in confectionery sector Ticker Name Market Cap. (VNDmln) Net sales (VNDmln) EBITDA Margin Net Profit Margin ROA ROE IFS.HM INTERFOOD 195,948 723,272 15.0% 10.0% 9.7% 18.1% BBC.HM BIEN HOA CONFECTIONERY 894,898 453,975 7.5% 5.5% 8.0% 12.8% HHC.HN HAI HA CONFECTIONERY 218,453 341,248 NA 5.8% 10.9% 23.0% KDC.HM KINH DO CORP 6,720,952 1,233,119 15.9% 19.5% 12.0% 15.8% NKD.HM NORTH KINH DO 1,259,973 561,580 17.0% 14.1% 16.6% 34.4% Source: Horizon Securities, company’s data Kinh Do Corp (ticker: KDC.HM), by far the largest producer of snacks and confectionery products in Vietnam has 200 distributors and 65,000 retailers. The company manufactures a wide range of products such as cookies, cakes and snacks. From 2006 to 2007, KDC’s sales and net profit increased by 23.5% and 41% respectively. The company exports to countries in Asia, Europe and North America. In August 2007, Kinh Do signed a joint-venture with Cadbury to become its exclusive distributor in Vietnam. The company has also expanded into real estate, investing in and building office, apartment, and retail space. North Kinh Do (ticker: NKD.HM), a subsidiary of Kinh Do Corp. is the second biggest player in the market. With 46 distributors, 5 bakeries and more than 12,000 retail outlets, the company controls about 30% of the northern market. In 2007 revenue reached VND566 billion (US$34.75 million), increasing by 31.2% yoy. In April 2007, management announced that together with Tribeco, the company would establish North Tribeco, a beverage company focusing on the northern market. North Kinh Do would own 15% of the newly established North Tribeco. Bien Hoa Confection (ticker: BBC.HM) is the third largest confectionery company capable of producing 45 tons of sweets, cakes and nutritional foods and 18 tons malt per day. Revenue in 2007 increased 33% yoy and BBC has gained 7% of the domestic market and has been exporting its products to over twenty countries. Kinh Do signed a joint venture with Cadbury to become its exclusive distributor in Vietnam North Kinh Do controls about 30% of the northern market 25 Horizon Securities
  • 26. Vietnam Agribusiness: From farm to chopsticks February 29th, 2008 Hai Ha Confectionery (ticker: HHC.HN) is a large confectionery in North of Vietnam with total capacity of 70 tons per day. In order to increase its output and expand its market share, the company has invested close to US$1.75 million in new machinery and new production lines. HHC’s net income in 2007 jumped 31% to VND19.7 billion (US$1.23 million). 6.4 Aquaculture processing: Vietnam’s fourth largest income Aquaculture is the country’s fourth largest revenue earner putting Vietnam in the world’s top 10 seafood exporter. Vietnam has more than 450 aquaculture processing and exporting companies but there are very few vertically integrated players. In 2006, because total processing capacity had jumped 20% while fish farmers had only increased output by 7.6%, many aquaproducts processors were operating at 30% to 50% under capacity. There is some level of upstream integration between processors and farmers to the extent that processors often assist farmers by providing training, veterinary counseling, and access to feed and inputs at bargain prices. Farmers, on the other hand, will sell their fish at market price, typically selling to their partner-processor. Processors win by ensuring stable raw materials supply. Some processors are currently planning to integrate upstream by farming fish themselves. Figure 48. Vietnam aquaculture export Figure 49. Production of aquatic product 4,500 4,000 3,500 3,000 2,500 2,000 1,500 1,000 500 0 14.74% CAGR 2000 2001 2002 2003 2004 2005 2006 2007E USDmln 3,500 3,000 2,500 2,000 1,500 1,000 500 0 1995 1996 2001 2000 1999 1997 1998 '000 tons Oceanic fisheries Fish farming Shrimp farming Source: Ministry of Aquaculture Source: GSO Figure 50. Listed companies in fishery sector Ticker Name Market Cap. (VNDmln) Net sales (VNDmln) 2002 2003 2004 2005 EBITDA Margin 2006 Net Profit Margin ROA ROE ABT.HM BENTRE AQUAPRODUCT IMPORT EXPORT 441,000 429,706 7.5% 9.5% 15.3% 22.8% ACL.HM CUU LONG FISH CORP. 612,000 537,449 13.0% 10.4% 31.4% 60.9% AGF.HM ANGIANG FISHERIES IMPORT & EXPORT 681,542 1,233,734 5.8% 3.2% 6.0% 8.6% ANV.HM NAM VIET CORPORATION 4,719,000 3,193,437 12.2% 12.1% 22.9% 30.8% FBT.HM FAQUIMEX 390,000 NA NA NA NA NA FMC.HM SAO TA FOODS 255,990 999,764 NA 2.8% 9.2% 19.9% ICF.HM INVESTMENT COMMERCE FISHERIES CORP 265,500 326,025 NA 6.0% 7.0% 15.0% MPC.HM MINH PHU SEAFOOD 2,527,000 NA NA NA NA NA SJ1.HM SEAFOOD NO.1 111,650 145,553 4.3% 4.0% 9.1% 11.2% TS4.HM SEAFOOD NO.4 128,581 172,904 5.8% 4.6% 6.8% 9.6% VHC.HM VINH HOANG 1,230,000 NA NA NA NA NA LAF.HM LAFOOCO LONG AN FOOD PROCESSING EXPORT 202,962 626,503 NA 3.0% 14.0% 26.0% Source: Horizon Securities, company’s data With a current processing capacity of 700 tons per day, Nam Viet Corporation is Vietnam’s largest basa fish processing and exporting company. NAV’s 2007 sales figures increased by 18% compared to 2006. The company is heavily dependant on exports, which represent on average 60% of total revenue. Exports markets are mostly in Asia and Europe. For 2008, management intends to build a commercial feed factory with a capacity of 750,000 tons per year. Management wants to solidify ties with farmers they depend on, by offering them feed input. NAV will be able to manufacture feed by utilizing its discarded waste from its fish processing activity. 26 Horizon Securities
  • 27. Vietnam Agribusiness: From farm to chopsticks February 29th, 2008 Figure 51. Exports represent a significant portion of aquaculture processors’ total revenue Code Companies Export revenue as % of total revenue Main products ANV NAM VIET CORPORATION 65.00% basa fish VHC VINH HOAN CORP. 92.23% basa fish ICF INVESTMENT COMMERCE FISHERIES CORP. 96.00% shrimp, fish ABT BENTRE AQUAPRODUCT IMPORT & EXPORT JSC. 98.04% ark shell MPC MINH PHU SEAFOOD CORP 94.20% shrimp AGF AN GIANG FISHERIES IMPORT & EXPORT JSC 80.00% basa fish ACL CUULONG FISH JSC 95.00% basa fish FMC SAO TA FOODS JSC 98.00% shrimp FBT BEN TRE FORESTRY & AQUAPRODUCT IMPORT EXPORT 88.42% basa fish Source: Horizon Securities, Company data 2007 Antibiotic residue in seafood & anti-dumping tariff: Major threat to aquaculture industry Japan is currently the third largest market for Vietnam’s aquaculture exports. However, shrimp exports to Japan fell 15.6% because Vietnamese products were repeatedly found to have traces of antibiotics. Japan now tests 100% of aquaculture products from Vietnam, for animal chemicals. Another major concern for Vietnam’s aquaculture industry is the dumping charges in the US. Since the US placed anti-dumping tariffs on Vietnamese companies, aquaculture exports to the US have decreased significantly. 6.5 Soft drink: Still enough room for local players to growth The sector is dominated by Coca Cola Vietnam and Pepsi International Vietnam, who jointly share 84% of the soft drink (sparkling) market. The remaining 16% is divided between a host of local players. To avoid direct competition with the giants, the domestic companies have been focusing on niche markets. TNS Worldpanel estimates that Vietnam’s carbonated soft drink market will grow at 5% to 10% per year, while the non-sparkling segment should grow at 20-25%. Figure 52. Listed companies in soft-drink sector Ticker Name Market Cap. (VNDmln) Net sales (VNDmln) …carbonated soft drink market will grow at 5% to 10% per year and non-sparkling segment expect to grow at 20 -25% EBITDA Margin Net Profit Margin ROA ROE SCD.HM CHUONG DUONG BEVERAGE 227,800 238,894 NA 9.2% 14.4% 18.9% TRI.HM TRIBECO SAIGON BEVERAGE 275,515 384,639 NA 4.0% 3.5% 14.2% IFS.HM INTERFOOD 195,948 723,272 15.0% 10.0% 9.7% 18.1% Source: Horizon Securities, Company data Having lost market share to Coca Cola and Pepsi when they entered Vietnam in 1990’s, Tribeco Beverage (ticker: TRI.HM) turned to soymilk products for which it has built a popular brand. The company reported US$24.9 million revenue in 2007, up The company reported 31.8% from 2006. The company plans to invest over US$20 million to build two new US$24.9 million revenue in factories with total capacity of 39 million cases per year. Net sales in 2007 increased 2007, up 31.8% from 2006. to US$24mln from US$18.36mln in 2006, representing 30.9% growth. Chuong Duong Beverage (ticker: SCD.HM) focuses on sarsaparilla-based drinks. The company also intends to construct a new factory, with a capacity of 100 million liters per year, worth US$22.8mln. Sales have been growing at 27% CAGR since 2005, and the company has been able to maintain operating margins around 8%. Interfood Shareholding Co. (ticker: IFS.HM) owns the Wonderfarm brand and produces a wide range of tropical fruit juices, coffees, canned bird's nest drinks, winter melon tea, and a Korean ginger drink. Operating profit grew 22% from 2006 to Tan Hiep Phat Group owns 2007, and the company maintained its operating margin at 12% of sales. Number One Energy, which holds 30% to 40% of the Among the unlisted companies, Tan Hiep Phat Group is worth mentioning. THP Group energy drink market is a private, diversified beverage company with strong brand names in soft drinks 27 Horizon Securities
  • 28. Vietnam Agribusiness: From farm to chopsticks February 29th, 2008 and beer. It manufactures the Number One Energy drink, which holds 30% to 40% of the energy drink market. THP Group also manufactures the O Degree Green Tea, which was the fastest growing brand in Vietnam between 2006 and 2007. The group’s owns three beer brands; Ben Thanh Beer, Ben Thanh Gold, and Laser. VII. Distribution: The rise of supermarkets We estimate that total retail sales in Vietnam reached US$36bln in 2007, growing at over 21% CAGR in the last five years. The food retailing sector has grown at 11%, reaching US$10.2bln in 2006. Even though traditional wet markets still dominate retail trade, Vietnam’s supermarkets are becoming more popular among urbanites. Since 1993, when the first supermarket opened its doors, there has been a significant increase in the number of supermarkets. Global chains, namely Big C and Metro, have been in the country for years and have been increasing their foothold. Local chains, like Co-op Mart, have been aggressively opening new stores in large and intermediate cities in the South of Vietnam. Currently, there are more than 200 supermarkets all over the country. We believe the rise of supermarkets in Vietnam will affect the whole agribusiness value-chain. As modern procurement systems invariably exert more demanding requirements from processors and farmers, there will be a need for increased investments and changes in current practices. We see greater demand for industrial farming, cold storage and warehousing, processing facilities, and logistics. As supermarkets tend to source products from medium to large processors and wholesalers, we believe there will be opportunities for a greater level of integration along the supply chain. Figure 53. Traditional shopping still dominates Vietnam …modern shopping form is becoming more popular among urbanites Figure 54. …but modern shopping trend is on the rise Hong Kong Japan Thailand Korea Vietnam Indonesia India Tai wan Australia Singapore Philipines NZ Malaysia 50% Traditional Grocery Stores - Regular users % Wet Markets - Regular users % 50% 140 120 100 80 60 40 20 0 2001 2002 2003 2004 2005 2006 No.of supermarkets No. of department stores Source: AC Nielsen Source: Euromonitor Currently, there are no listed companies operating in the distribution business. Co-op Mart is the market leader with more than 24 supermarkets and 34 convenience stores in operation. Total turnover of Co-op Mart last year was around US$200mln. Figure 55. Modern trading form is changing agribusiness value chain Farmers/Co-operatives Farm collectors Wholesalers Wet markets Groceries Street vendors Consumers Consumers Consumers Source: Horizon Securities Farmers/Co-operatives Retailers/Supermarkets/ Hypermarkets Consumers 28 Horizon Securities
  • 29. Vietnam Agribusiness: From farm to chopsticks February 29th, 2008 Figure 56. List of major supermarkets, hypermarkets and department stores in Vietnam Retailer Name Ownership No. of Outlets Estimated Sales Turnover (US$mln) Locations and expansion plan Imported Food Purchasing Agent COOPMART Local company operated under co­operative law 24 supermarkets 34 convenient stores 200 - Mainly in HCMC (14 stores). - Just expanded to Can Tho, Long Xuyen, Phan Thiet, Gia Lai - Plan: other cities (Ben Tre, Buon Me Thuoc) 29 Horizon Securities - Mainly from importers/distributor s and wholesalers. - Small portion of food imported directly BigC (CORA) Local Joint Venture with Casino Group of France 5 Hypermarkets 1 Supermarket > 65 - HCMC, Dong Nai, Hanoi, Hai Phong, Danang. - Plan: open 4 more stores. - Mainly from importers/distributor s and wholesalers. - Small portion of food imported directly Maximart An Phong Private-Owned Company 4 48 - HCMC, Nha Trang, Cantho, Binh Duong - Expand to Binh Duong soon - Mainly from importers/distributor s and wholesalers. Citimart Private-Owned Company 12 Supermarkets 4 minimarts 38 - HCMC, Hanoi, Can THo, Dong Thap - Mainly from importers and distributors Intimex Joint-Stock Company 10 25 Hanoi, Haiphong, Hai Duong, Nghe An, Danang - Mainly from importers and distributors FIVIMART Private-Owned Company 10 25 - Hanoi, HCMC, Binh Duong - Mainly from importers and distributors Binh Dan Supermarkets Private-Owned Company 2 N/A -HCMC - Mainly from importers and distributors SATRA Supermarkets State-owned Company 2 N/A - HCMC - Mainly from importers and distributors Select Supermarts Private-Owned Company 5 supermarkets 5 minimarts N/A -HCMC - Mainly from importers and distributors Metro Cash & Carry 100% Foreign Invested Company (Germany) 8 >350 - HCMC, Hanoi, Hai Phong, Cantho, Danang. - Plan: open 4 more stores in HCMC, Hanoi, Dong Nai - Mainly from importers and distributors. - Direct imports for fresh and frozen products. SEYU Supermarket Local Joint-Venture with Seyu of Japan 1 N/A - Hanoi - Mainly from importers and distributors. PAKSON Local Joint-Venture with Pakson of Malaysia 3 N/A - HCMC, hai Phong. - Plan: open a total of 10 stores. - Mainly from importers and distributors. VINATEX State-owned company 20 supermarkets 10 minimarts N/A HCMC, Dong Nai - Mainly from importers and distributors. HAPRO State-owned company 7 Hapromarts and 18 convenient stores 7 - Mainly from importers and distributors Wellcome Supermaket (Dairy Farm) Business Cooperation Contract with Citimart 1 N/A - HCMC. -Plan: open a total of 6 stores in Vietnam for the first phase. - Mainly from importers and distributors Source: USDA Foreign Agricultural Service
  • 30. Vietnam Agribusiness: From farm to chopsticks February 29th, 2008 VIII. Companies in focus 30 Horizon Securities