The Year in Search is a summary of key trends and changes in the online world in 2015. Published by the Google team, it compiles various researches published through the year.
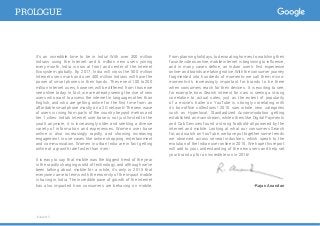
It’s an incredibletime to be in India! With over 300 million
Indians using the Internet and 6 million new users joining
every month, India is now at front and center of the Internet
Ecosystem globally. By 2017, India will cross the 500 million
Internet users mark and over 400 million Indians will have the
power of smartphones in their hands. These next 100 to 200
million Internet users, however, will be different from those we
see online today. In fact, we are already seeing the rise of new
users who want to access the internet in languages other than
English, and who are getting online for the first time from an
affordable smartphone mostly on a 2G network! The new wave
of users is rising from parts of the country beyond metros and
tier 1 cities. India’s Internet user base is not just limited to the
youth anymore, it is increasingly older and seeking a diverse
variety of information and experiences. Women user base
online is also increasingly rapidly, and showing increasing
engagement in use cases like online shopping, entertainment
and communication. Women in urban India are in fact getting
online at a growth rate faster than men.i
It is easy to say that mobile was the biggest trend of the year
in the rapidly changing world of technology, and although we’ve
been talking about mobile for a while, it’s only in 2015 that
everyone came to terms with the enormity of the impact mobile
is having in India. The incredible pace of growth of the internet
has also impacted how consumers are behaving on mobile.
From planning holidays, to decorating homes, to watching their
favorite videos online, mobile internet is beginning to influence,
and in many cases define, an Indian user’s first experience
online- and brands are taking notice. With the consumer journey
fragmented into hundreds of moments-we call them micro-
moments-it’s increasingly important for brands to be there
when consumers reach for their devices. It is exciting to see,
for example, how Search interest for cars is seeing a strong
correlation to actual sales, just as the extent of popularity
of a movie’s trailer on YouTube is strongly correlating with
its box-office collections! 2015 saw whole new categories
such as Hyperlocal, Standardized Accommodation getting
established as mainstream, while others like Digital Payments
and Cab Services found a strong foothold-all powered by the
internet and mobile. Looking at what our consumers Search
for, and watch on YouTube, we have put together some trends
we observed across several industries, which speak to the
evolution of the Indian user online in 2015. We hope this report
will add to your understanding of the new users and help set
your brand up for an incredible run in 2016!
-Rajan Anandan
PROLOGUE
iCube 2015i
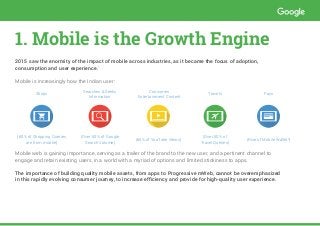
1. Mobile isthe Growth Engine
2015 saw the enormity of the impact of mobile across industries, as it became the focus of adoption,
consumption and user experience.1
Mobile is increasingly how the Indian user:
Shops
Searches & Seeks
Information
Consumes
Entertainment Content
Travels Pays
(60% of Shopping Queries
are from mobile)
(Over 50% of Google
Search Volume)
(60% of YouTube Views)
(Over 50% of
Travel Queries)
(Rise of Mobile Wallet2
)
Mobile web is gaining importance, serving as a trailer of the brand to the new user, and a pertinent channel to
engage and retain existing users, in a world with a myriad of options and limited stickiness to apps.
The importance of building quality mobile assets, from apps to Progressive mWeb, cannot be overemphasized
in this rapidly evolving consumer journey, to increase efficiency and provide for high-quality user experience.
5.
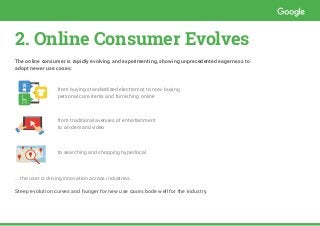
2. Online ConsumerEvolves
The online consumer is rapidly evolving and experimenting, showing unprecedented eagerness to
adopt newer use cases:
... the user is driving innovation across industries.
Steep evolution curves and hunger for new use cases bode well for the industry.
from buying standardized electronics to now buying
personal care items and furnishing online
from traditional avenues of entertainment
to on-demand video
to searching and shopping hyperlocal
6.
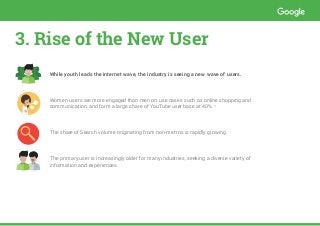
While youth leadsthe internet wave, the industry is seeing a new wave of users.
Women users are more engaged than men on use cases such as online shopping and
communication, and form a large share of YouTube user base at 40%.3
The share of Search volume originating from non-metros is rapidly growing.
The primary user is increasingly older for many industries, seeking a diverse variety of
information and experiences.
3. Rise of the New User
7.
4. Simplification and
Customer Centricity
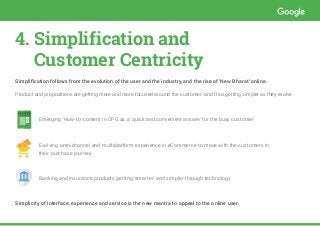
Simplification follows from the evolution of the user and the industry, and the rise of ‘New Bharat’ online.
Product and propositions are getting more and more focused around the customer- and thus getting simpler as they evolve.
Emerging ‘How-to’ content in CPG as a quick and convenient answer for the busy customer
Evolving omnichannel and multiplatform experience in eCommerce to move with the customers in
their purchase journey
Banking and insurance products getting ‘smarter’ and simpler through technology
Simplicity of interface, experience and service is the new mantra to appeal to the online user.
HOW-TO
1
2
W-TO
1
2
AUTO
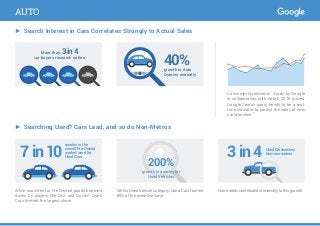
► Search Interestin Cars Correlates Strongly to Actual Sales
Consumer Querimetrix Study by Google
in collaboration with Kotak, 2016 proved
Google Search query trends to be a real-
time indicator to predict the sales of new
car launches.5
More than 3in4
car buyers research online
40%growth in Auto
Queries annually
► Searching Used? Cars Lead, and so do Non-Metros
While searches for Pre-Owned goods boomed
driven by players like OLX and Quickr4
, Used
Cars formed the largest share.
Within Used Vehicle category, Used Cars formed
90% of the overall volume.
Non-metroscontributedimmenselytothisgrowth.
7in10 3in4
200%
queries in the
overall Pre-Owned
market were for
Used Cars
Used Car searches
from non-metros
growth in queries for
Used Vehicles
10.
AUTO
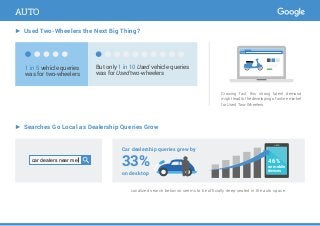
► Used Two-Wheelersthe Next Big Thing?
Growing fast, this strong latent demand
might lead to the developing of online market
for Used Two-Wheelers.
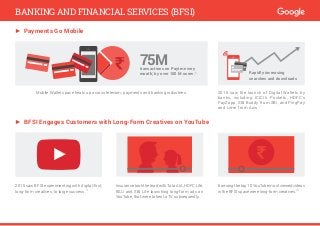
► Searches Go Local as Dealership Queries Grow
Localized search behavior seems to be officially deep-seated in the auto space.
46%
on mobile
devices
Car dealership queries grew by
33%
on desktop
car dealers near me $XX
1 in 5 vehicle queries
was for two-wheelers
But only 1 in 10 Used vehicle queries
was for Used two-wheelers
11.
$
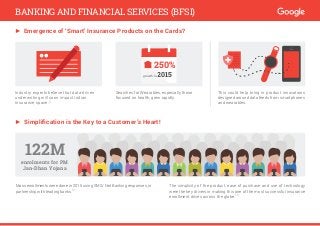
► Payments GoMobile
Mobile Wallet space heats up across telecom, payments and banking industries. 2015 saw the launch of Digital Wallets by
banks, including ICICI’s Pockets, HDFC’s
PayZapp, SBI Buddy from SBI, and PingPay
and Lime from Axis.7
75Mtransactions on Paytm every
month; by over 100 M users.6 Rapidly increasing
searches and downloads
► BFSI Engages Customers with Long-Form Creatives on YouTube
Insurance took the lead with Tata AIA, HDFC Life,
BSLI and SBI Life launching long-form ads on
YouTube, that were taken to TV subsequently.
2015 saw BFSI experimenting with digital-first,
long-form creatives, to large success.9
6amongthetop10YouTubemostviewedvideos
in the BFSI space were long-form creatives.10
BANKING AND FINANCIAL SERVICES (BFSI)
12.
► Emergence of‘Smart’ Insurance Products on the Cards?
Industry experts believe that data-driven
underwriting will soon impact Indian
Insurance space.11
Searches for Wearables, especially those
focused on health, grew rapidly.
This could help bring in product innovations
designed around data feeds from smartphones
and wearables.
250%
growth
in 2015
in 20growth in
► Simplification is the Key to a Customer’s Heart!
Mass enrollments were done in 2015 using SMS/ Net Banking responses, in
partnership with leading banks.12
The simplicity of the product, ease of purchase and use of technology
were the key drivers in making this one of the most successful insurance
enrollment drives across the globe.12
122M
enrolments for PM
Jan-Dhan Yojana
BANKING AND FINANCIAL SERVICES (BFSI)
13.
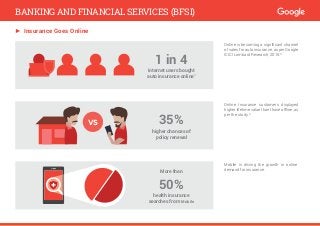
► Insurance GoesOnline
Online is becoming a significant channel
of sales for auto insurance, as per Google
ICICI Lombard Research, 2015.8
Mobile is driving the growth in online
demand for insurance.
Online Insurance customers displayed
higher lifetime value than those offline, as
per the study.8
1 in 4
internet users bought
auto insurance online8
35%
higher chances of
policy renewal
More than
50%
health insurance
searches from Mobile
VS
BANKING AND FINANCIAL SERVICES (BFSI)
14.
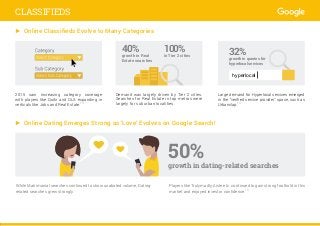
► Online ClassifiedsEvolve to Many Categories
Demand was largely driven by Tier 2 cities.
Searches for Real Estate in top metros were
largely for suburban localities.
2015 saw increasing category coverage
with players like Quikr and OLX expanding in
verticals like Jobs and Real Estate.13
Large demand for Hyperlocal services emerged
in the “verified service provider” space, such as
Urbanclap.14
40%
growth in Real
Estate searches
32%
growth in queries for
hyperlocal services
100%
in Tier 2 cities
hyperlocal
► Online Dating Emerges Strong as ‘Love’ Evolves on Google Search!
While Matrimonial searches continued to show unabated volume, Dating-
related searches grew strongly.
Players like Trulymadly, Aisle etc. continued to gain strong foothold in this
market and enjoyed investor confidence.15
50%growth in dating-related searches
CLASSIFIEDS
15.
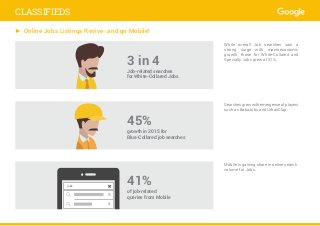
► Online JobsListings Revive- and go Mobile!
While overall Job searches saw a
strong surge with macroeconomic
growth, those for White-Collared and
Specialty Jobs grew at 31%.
Mobile is gaining share in online search
volume for Jobs.
Searchesgrewwithemergenceofplayers
such as BabaJobs and UrbanClap.
jobs
3 in 4
Job-related searches
for White-Collared Jobs
45%
growth in 2015 for
Blue-Collared job searches
41%
of job-related
queries from Mobile
CLASSIFIEDS
16.
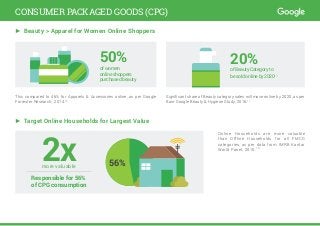
► Beauty >Apparel for Women Online Shoppers
This compared to 46% for Apparels & Accessories online, as per Google
Forrester Research, 2014.16
Significant share of Beauty category sales will move online by 2020, as per
Bain-Google Beauty & Hygiene Study, 2016.17
► Target Online Households for Largest Value
Online Households are more valuable
than Offline Households for all FMCG
categories, as per data from IMRB Kantar
World Panel, 2015.18
50%
of women
online shoppers
purchased beauty
20%
of Beauty Category to
be sold online by 202017
2xmore valuable
Responsible for 56%
of CPG consumption
56%
CONSUMER PACKAGED GOODS (CPG)
17.
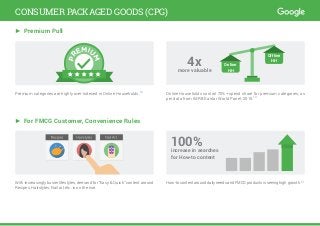
Premium categories arehighly over-indexed in Online Households.18
Online Households control 70%+ spend share for premium categories, as
per data from IMRB Kantar World Panel, 2015.18
4xmore valuable
Online
HHPR
EMIU
M
With increasingly busier lifestyles, demand for “Easy & Quick” content around
Recipes, Hairstyles, Nail art etc. is on the rise.
How-to content around daily needs and FMCG products is seeing high growth.14
100%increase in searches
for How-to content
Offline
HH
CONSUMER PACKAGED GOODS (CPG)
► For FMCG Customer, Convenience Rules
► Premium Pull
18.
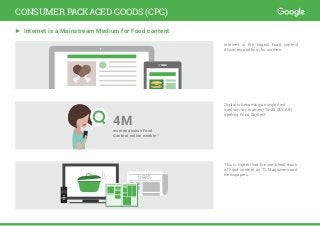
Internet is thelargest food content
discovery platform for women.
This is higher than the combined reach
of Food content on TV, Magazines and
Newspapers.19
Digital is becoming an important
medium for women (15-35 SEC AB)
seeking Food Content.
4M
women access Food
Content online weekly19
NEWS
CONSUMER PACKAGED GOODS (CPG)
► Internet is a Mainstream Medium for Food content
19.
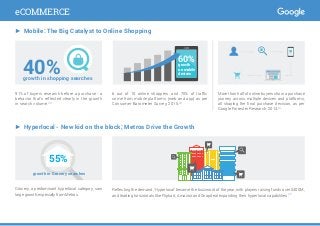
► Mobile: TheBig Catalyst to Online Shopping
More than half of online buyers show a purchase
journey across multiple devices and platforms,
all shaping the final purchase decision, as per
Google Forrester Research, 2014.16
91% of buyers research before a purchase - a
behavior that’s reflected clearly in the growth
in search volume.20
6 out of 10 online shoppers, and 70% of traffic
come from mobile platforms (web and app) as per
Consumer Barometer Survey, 2015.20
60%
growth
on mobile
devices40%growth in shopping searches
growth in Grocery searches
► Hyperlocal - New kid on the block; Metros Drive the Growth
Grocery, a predominant hyperlocal category, saw
large growth, especially from Metros.
Reflecting the demand, ‘Hyperlocal’ became the buzzword of the year, with players raising funds over $400M,
and leading horizontals like Flipkart, Amazon and Snapdeal expanding their hyperlocal capabilities.22
55%
eCOMMERCE
20.
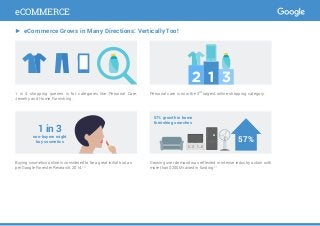
► eCommerce Growsin Many Directions: Vertically Too!
Growing user demand was reflected in intense industry action with
more than $200M raised in funding.21
Buying cosmetics online is considered to be a great initial trial, as
per Google Forrester Research, 2014.16
1 in 4 shopping queries is for categories like Personal Care,
Jewelry and Home Furnishing.
Personal care is now the 3rd
largest online shopping category.
1 in 3
non-buyers might
buy cosmetics 57%
57% growth in home
furnishing searches
eCOMMERCE
21.
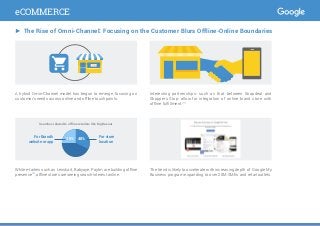
The trend islikely to accelerate with increasing depth of Google My
Business program expanding to over 20M SMEs and retail outlets.
While e-tailers such as Lenskart, Babyoye, Paytm are building offline
presence24
, offline stores are seeing search interest online.
A hybrid Omni-Channel model has begun to emerge, focusing on
customer’s needs across online and offline touchpoints.
Interesting partnerships- such as that between Snapdeal and
Shoppers Stop- allow for integration of online brand store with
offline fulfillment.23
► The Rise of Omni-Channel: Focusing on the Customer Blurs Offline-Online Boundaries
Searches related to offline retailers like Big Bazaar
For store
location
For Brand’s
website or app
15% 40%
OPENOPEN
eCOMMERCE
22.
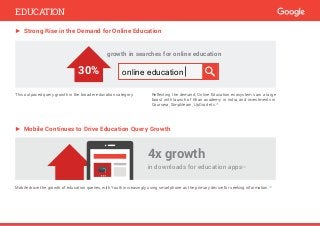
► Strong Risein the Demand for Online Education
► Mobile Continues to Drive Education Query Growth
This outpaced query growth in the broader education category.
Mobile drove the growth of education queries, with Youth increasingly using smartphone as the primary device for seeking information.20
Reflecting the demand, Online Education ecosystem saw a large
boost with launch of Khan academy in India, and investments in
Coursera, Simplilearn, UpGrad etc.25
4x growth
in downloads for education apps26
growth in searches for online education
30% online education
EDUCATION
23.
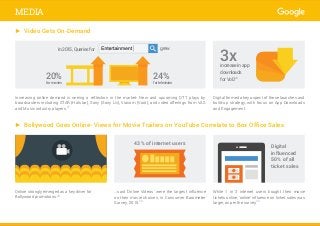
► Video GetsOn-Demand
Increasing online demand is seeing a reflection in the market- New and upcoming OTT plays by
broadcasters including STAR (Hotstar), Sony (Sony Liv), Viacom (Voot), and video offerings from VAS
and Music industry players.27
Digital formed a key aspect of these launches and
build-up strategy, with focus on App Downloads
and Engagement.
3xincreaseinapp
downloads
forVoD28
In2015,Queriesfor grew
20%formovies
24%fortelevision
► Bollywood Goes Online- Views for Movie Trailers on YouTube Correlate to Box Office Sales
...said ‘Online Videos’ were the largest influence
on their movie choices, in Consumer Barometer
Survey, 2015.20
Online strongly emerged as a key driver for
Bollywood promotions.29
While 1 in 3 internet users bought their movie
tickets online, ‘online’ influence on ticket sales was
larger, as per the survey.20
43% of internet users
Digital
influenced
50% of all
ticket sales
MEDIA
24.
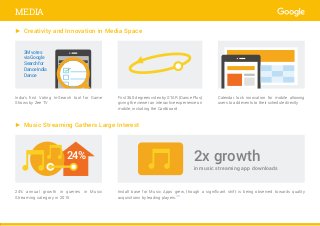
► Music StreamingGathers Large Interest
Install base for Music Apps grew, though a significant shift is being observed towards quality
acquisitions by leading players.30
24% annual growth in queries in Music
Streaming category in 2015
24% 2x growth
in music streaming app downloads
► Creativity and Innovation in Media Space
India’s first Voting In-Search tool for Game
Shows by Zee TV
First 360 degrees video by STAR (Dance Plus)
giving the viewer an interactive experience on
mobile, including the Cardboard
Calendar lock innovation for mobile allowing
users to add events to their schedule directly
3Mvotes
viaGoogle
Searchfor
DanceIndia
Dance
MEDIA
25.
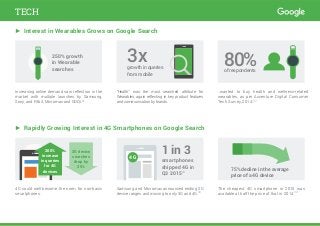
► Interest inWearables Grows on Google Search
► Rapidly Growing Interest in 4G Smartphones on Google Search
Increasing online demand saw reflection in the
market with multiple launches by Samsung,
Sony, and Fitbit, Micromax and GOQi.31
4G could well become the norm for non-basic
smartphones.
“Health” was the most searched attribute for
Wearables, again reflecting in key product features
andcommunicationbybrands.
..wanted to buy health and wellness-related
wearables, as per Accenture Digital Consumer
Tech Survey, 2014.32
Samsung and Micromax announced ending 2G
device ranges and moving to only 3G and 4G.33
The cheapest 4G smartphone in 2015 was
available at half the price of that in 2014.34
250% growth
in Wearable
searches
3G device
searches
drop by
35%
smartphones
shipped 4G in
Q3 201534
75% decline in the average
price of a 4G device
1 in 3
3xgrowthinqueries
frommobile
80%ofrespondents
200%
increase
in queries
for 4G
devices
4G
TECH
26.
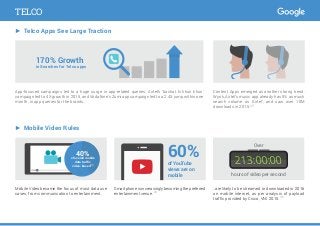
► Telco AppsSee Large Traction
App-focused campaigns led to a huge surge in app-related queries: Airtel’s ‘bachat ki khun khun’
campaign led to 4X growth in 2015, and Vodafone’s Zumi app campaign led to a 2.4X jump within one
month, in app queries for the brands.
Content Apps emerged as another strong trend.
Wynk, Airtel’s music app already has 5% as much
search volume as ‘Airtel’, and saw over 10M
downloads in 2015.35
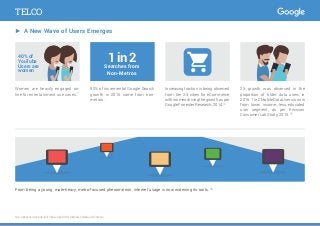
► Mobile Video Rules
..are likely to be streamed or downloaded in 2016
on mobile internet, as per analysis of payload
traffic provided by Cisco, VNI 2015. 36
Mobile Video became the focus of most data use
cases, from communication to entertainment.
Smartphone is increasingly becoming the preferred
entertainment venue. 20
60%of YouTube
views are on
mobile
Over
hoursofvideopersecond
213:00:00213:00:00
170% Growth
in Searches for Telco apps
40%
of overall mobile
data traffic
video-based36
TELCO
27.
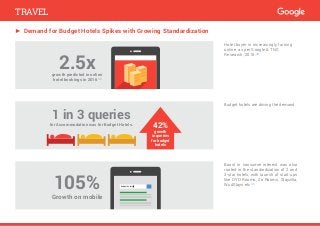
► A NewWave of Users Emerges
2X growth was observed in the
proportion of ‘older’ data users in
2015.1in2MobileDataUsersisnow
from lower income, less educated
user segment, as per Ericsson
Consumer Lab Study, 2015. 37
From being a young, male-heavy, metro-focused phenomenon, internet usage is now widening its roots.38
Women are heavily engaged on-
line for entertainment use cases.3
90% of incremental Google Search
growth in 2015 came from non-
metros.
Increasing traction is being observed
from tier 2-3 cities for eCommerce,
withwomendrivingthegrowth,asper
Google Forrester Research, 2014.16
1in2
Searches from
Non-Metros
Non-metros here include all of India, except Delhi, Mumbai, Kolkata, and Chennai.
40% of
YouTube
Users are
women
TELCO
28.
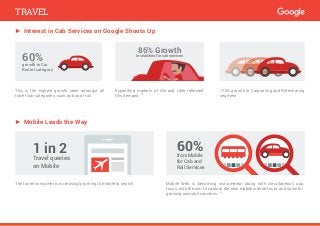
► Demand forBudget Hotels Spikes with Growing Standardization
Hotel buyer is increasingly turning
online, as per Google & TNS
Research, 2015.39
Boost in consumer interest was also
rooted in the standardization of 2 and
3-star hotels, with launch of start-ups
like OYO Rooms, Zo Rooms, Stayzilla,
WudStays etc 40
Budget hotels are driving the demand.
2.5xgrowth predicted in online
hotel bookings in 2016 39
1 in 3 queries
for Accommodation was for Budget Hotels.
42%
growth
in queries
for budget
hotels
105%
Growth on mobile
budget hotels
TRAVEL
29.
► Interest inCab Services on Google Shoots Up
Expanding markets of Ola and Uber reflected
this demand. 41
This is the highest growth seen amongst all
travel sub-categories, such as bus or rail.
173% growth in Carpooling and Ridesharing
segment
60%growth in Car
Rental category
86% Growth
in searches for cab services
► Mobile Leads the Way
The travel consumer is increasingly turning to mobile to search. Mobile Web is becoming instrumental along with simultaneous app
focus, with the aim to capture the new mobile internet user, and solve for
growing uninstall concerns.14
1 in 2
Travel queries
on Mobile
60%from Mobile
for Cab and
Rail Services
TRAVEL
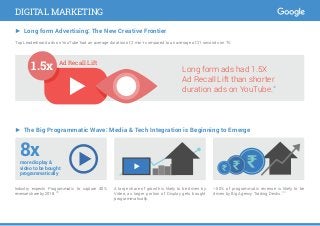
► The BigProgrammatic Wave: Media & Tech Integration is Beginning to Emerge
Top Leaderboard ads on YouTube had an average duration of 2 min+ compared to an average of 21 seconds on TV.
1.5x Long form ads had 1.5X
Ad Recall Lift than shorter
duration ads on YouTube.
42
Ad Recall Lift
~50% of programmatic revenue is likely to be
driven by Big Agency Trading Desks. 43
Industry expects Programmatic to capture 40%
revenue share by 2018. 43
A large share of growth is likely to be driven by
Video, as larger portion of Display gets bought
programmatically.
8xmore display &
video to be bought
programmatically
DIGITAL MARKETING
► Long form Advertising: The New Creative Frontier
32.
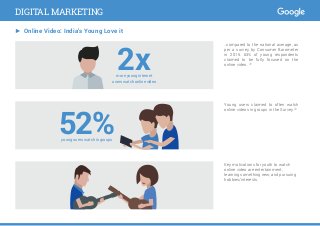
► Online Video:India’s Young Love it
..compared to the national average, as
per a survey by Consumer Barometer
in 2015. 63% of young respondents
claimed to be fully focused on the
online video. 20
Key motivations for youth to watch
online video are entertainment,
learning something new, and pursuing
hobbies/interests.
Young users claimed to often watch
online videos in groups in the Survey.20
2xmore young internet
users watch online video
52%young users watch in groups
DIGITAL MARKETING
33.
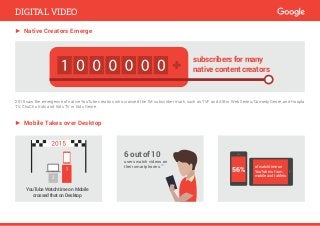
2015 saw theemergence of native YouTube creators who crossed the 1M subscriber mark, such as TVF and AIB in Web Series/Comedy Genre, and Hoopla
TV, ChuChu Kids and Kids TV in Kids Genre.
► Mobile Takes over Desktop
subscribers for many
native content creators
6 out of 10
users watch videos on
their smartphones.44
YouTube Watch time on Mobile
crossed that on Desktop
of watchtime on
YouTube is from
mobile and tablets
56%
DIGITAL VIDEO
► Native Creators Emerge
34.
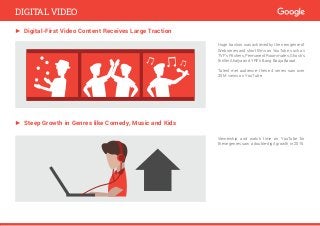
Huge traction wasachieved by the new genre of
Web series and short films on YouTube, such as
TVF’s Pitchers, Permanent Roommates, Ghosh’s
thriller Ahalya and YRF’s Bang Baaja Baraat.
Talent met audience- these 4 series saw over
20M views on YouTube.
► Steep Growth in Genres like Comedy, Music and Kids
Viewership and watch time on YouTube for
these genres saw a double-digit growth in 2015.
DIGITAL VIDEO
► Digital-First Video Content Receives Large Traction
35.
1. IAMAI Report:Mobile Internet: Raring to Go, 2015
2. TechSci Research report, “India Mobile Wallet Market Opportunities and Forecast, 2020”
3. Nielsen Featured Insights, What Women Want on their Smartphones, 2015), Ericsson The Changing Mobile Broadband Landscape in India, 2015),
60 mn women in India online; 24 mn log in daily: Google. Economic Times. Jun 20, 2013
4. ‘Another Startup Quikr To Hit Billion-Dollar Valuation In India, Asia’s Top E-Commerce Market’, Forbes Asia, March 9, 2015
5. Google Kotak Study, 2015, Launch of Consumer Querimetrix
6. ’Paytm tying up with banks to help customers top-up mobile wallet using ATMs’ - The Economic Times, 22 Oct 2015
7. Internal Google Search Data, Jan -Dec 2015. App Annie Data on Payment Apps. ‘Axis Bank launches mobile wallet to shop, pay and bank’, Sep 2015,
Business Standard
8. Google ICICI Lombard Research, 2015
9. ‘Of Life Insurance, Long Format ad films and Fear, Jan 2015
10. Internal YouTube Analysis, India YouTube Ads Leaderboard 2015
11. Wearable Devices can change insurance underwriting, .Net From India, May 2015
12. ‘Pradhan Mantri Jan Dhan Yojana (PMJDY),Launched by the Prime Minister Shri Narendra Modi on 28th August, 2014, Celebrates its First
Anniversary’ Press Information Bureau, Government of India, Ministry of Finance, May 2015
13. Quikr-Commonfloor deal: Merged realty entity may raise up to $150 million, The Economic Times, ET Bureau Dec 2, 2015
14. Google Search Data, Jan-Dec 2015
15. ‘Made in India online dating app TrulyMadly raises Rs 35 Cr’, Your Story, Mar 2015
16. Google Forrester Research, The Online Buyer, Nov 2014
17. ‘Impact of Digital on Beauty & Hygiene’ Bain Google Study, 2016
18. IMRB Kantar World Panel, 2015
19. TAM, TGI 2014, Google Internal Data, Industry estimates
20. Consumer Barometer Survey, 2015
21. ‘It is curtains up for online home furnishing market – now online fashion mall Fashionara forays into $20 B worth market’, Your Story, March 2015.
‘Urban Ladder raises $50 million in series C funding’, Your Story, April 2015.
SOURCES
36.
22. ‘How hyperlocalstartups are giving e-com giants a run for their money’, Your Story, June 2015
23. Shoppers Stop ties up with Snapdeal: Retail chain to sell products such as clothes, footwear on Snapdeal in north Indian cities where it has a
presence, Livemint, Aug 2015
24. ‘Lenskart to aggressively expand offline’, Oct 2015, Livemint
25. ‘Khan Academy to launch Hindi platform on 3 December’, Livemint, Dec 2015
26. App Annie. Use Of Education Apps By Indian Students Grew By 217% yoy, Report by Online learning platform Meritnation, 2015
27. Broadcasters eye digital platforms to enhance viewership in single-TV households, Aug 2014, Exchange4media
28. Digital Media: Rise of On-demand Content, Deloitte 2015. App Annie.
29. Correlation exercise done basis 1 week YouTube views and opening box office collections, 2015
30. Digital Media: Rise of On-demand Content, Deloitte 2015, App Annie Data on Music Streaming Apps, Music apps eye sound business, Techcircle.in,
Nov 2015
31. Wearable technology is changing the world really fast, Forbes India, Oct 2015
32. ‘India is likely to become a big market for wearable technologies: Vishal Gondal, GOQii’ DQ India, Nov 2015. Digital Consumer Tech Survey 2014,
Accenture
33. 4G in India: 2016 is going to be the year of 4G, Telecomtalk.info, Oct 2015
34. IDC Shipments data, Q3 2015. ‘IDC: One Out Of 3 Smartphones Shipped In India Are 4G’ Teleanalysis, Nov 2015
35. Airtel’s Wynk Music App Crosses 12 Million Downloads, Nov 2015, NextBigWhat
36. Cisco Visual Networking Index: Global Mobile Data Traffic Forecast Update 2014–2019 White Paper
37. Ericsson Consumer Lab, The Changing Mobile Broadband Landscape in India, 2015
38. The Changing Connected Consumer in India, BCG India, 2015
39. Google TNS Research Survey on Online Hotel Booking, 2015
40. SoftBank Leads $100M Investment In India-Based Budget Hotel Network OYO Rooms, Aug 2015, Techcrunch
41. ‘Uber on its way to gliding ahead of Ola in the Indian Market’, Oct 2015, Entrepreneur.com
42. YouTube Leaderboard, Internal Google Data, 2015
43. Internal Industry Estimates, Statista, eMarketer research. ‘Digital ad spend to rise significantly in India’ - The Economic Times, ET Bureau Apr 14,
2015
44. The Connected Consumer Survey 2015, Analysys Mason
While this report talks of various companies and industries, it only relates to information and insights based on data on Google products.
Unless otherwise specified, all statistics are based on analysis of internal Search queries data and YouTube Usage Data in 2015.
Joint reports by Google cited in this Playbook are independent market reports and are not influenced by any party.
Data from search queries used in this Playbook is based on searches done by users independently on Google.
Google doesn’t take any responsibility of the publically available data cited in the report.
SOURCES