SlideShare a Scribd company logo
1 of 8
Download to read offline
North RTP Station
                                                                                            DER
                                                                                  T W ALEXAN


                                                                    MI
                           1 Mile


                                                                  MIA
          CO
             RN


                                                                                          GE Aircraft Engines
               W


                                                 IBM
               AL
                 LIS
             7
           14
         NC


                       Research Triangle Institute
                                         DAVIS


                                                         Syngenta Biotechnology
                                                                                                          Map Layers
                                                                                                        Freeway Barrier
                                                                                                      Walk Time (Minutes)
                                                                                                        0 to 5
                                                                     CHIN PAGE                          6 to 10
                                       Research Triangle Park Headquarters                              11 to 15
                                                                                                        16 to 20
                              I4                                                                        Over 20
                                   0                                                              0        .15        .3       .45
                                                                                                              Miles


                                                                                                                           1
North RTP Station
                                                                                            DER
                                                                                  T W ALEXAN


                                                                    MI
                           1 Mile


                                                                  MIA
          CO
             RN


                                                                                          GE Aircraft Engines
               W


                                                 IBM
               AL
                 LIS
             7
           14
         NC


                       Research Triangle Institute
                                         DAVIS


                                                         Syngenta Biotechnology
                                                                                                      Walkscores
                                                                                                         Below 25
                                                                                                         25 to 49
                                                                                                         50 to 59
                                                                     CHIN PAGE                           60 to 69
                                       Research Triangle Park Headquarters                               70 to 79
                                                                                                         80 to 89
                              I4                                                                         90 to 100
                                   0                                                              0   .15        .3       .45
                                                                                                          Miles


                                                                                                                      2
North RTP Station
                                                                                            DER
                                                                                  T W ALEXAN


                                                                    MI
                           1 Mile


                                                                  MIA
          CO
             RN


                                                                                           GE Aircraft Engines
               W


                                                 IBM
               AL
                 LIS
             7
           14
         NC


                       Research Triangle Institute
                                         DAVIS


                                                                                         Activity Intensity Measure (2005)
                                                         Syngenta Biotechnology
                                                                                           Below 2
                                                                                           2 to 3.9
                                                                                           4 to 5.9
                                                                                           6 to 7.9
                                                                                           8 to 9.9
                                                                     CHIN PAGE             10 to 11.9
                                       Research Triangle Park Headquarters                 12 to 13.9
                                                                                           14 to 15.9
                              I4                                                           16 and Above
                                   0                                                        0         .15           .3   .45
                                                                                                            Miles


                                                                                                                               3
North RTP Station
                                                                                            DER
                                                                                  T W ALEXAN


                                                                    MI
                           1 Mile


                                                                  MIA
          CO
             RN


                                                                                           GE Aircraft Engines
               W


                                                 IBM
               AL
                 LIS
             7
           14
         NC


                       Research Triangle Institute
                                         DAVIS


                                                                                         Activity Intensity Measure (2035)
                                                         Syngenta Biotechnology
                                                                                           Below 2
                                                                                           2 to 3.9
                                                                                           4 to 5.9
                                                                                           6 to 7.9
                                                                                           8 to 9.9
                                                                     CHIN PAGE             10 to 11.9
                                       Research Triangle Park Headquarters                 12 to 13.9
                                                                                           14 to 15.9
                              I4                                                           16 and Above
                                   0                                                        0         .15           .3   .45
                                                                                                            Miles


                                                                                                                               4
North RTP Station
                                                                  DER
                                                        T W ALEXAN


                                            MI
                       1 Mile


                                           MIA
          CO
             RN
               W
               AL
                 LIS
             7
           14
         NC


                                   DAVIS


                                                                                Map Layers
                                                                              Intersections
                                                                            Walk Time (Minutes)
                                                                              0 to 5
                                            CHIN PAGE                         6 to 10
                                                                              11 to 15
                                                                              16 to 20
                          I4                                                  Over 20
                               0                                        0        .15        .3       .45
                                                                                    Miles


                                                                                                 5
North RTP Station
                                                                  DER
                                                        T W ALEXAN


                                            MI
                       1 Mile


                                           MIA
          CO
             RN
               W
               AL
                 LIS
             7
           14
         NC


                                   DAVIS


                                                                                Map Layers
                                                                              Missing Sidewalks
                                                                              Sidewalks
                                                                            Walk Time (Minutes)
                                                                              0 to 5
                                            CHIN PAGE                         6 to 10
                                                                              11 to 15
                                                                              16 to 20
                          I4                                                  Over 20
                               0                                        0        .15        .3        .45
                                                                                    Miles


                                                                                                  6
North RTP Station

                                                                                                          Radii                             Walk Time
  Aggregate Statistics                                                                          1/4      1/2         3/4        1      5      10            15      20
 Area                                                                                          0.20     0.79        1.77     3.14   0.17   0.53          1.08     1.88
 Sidewalks Miles                                                                               0.00     0.35        1.97     3.51   0.00   0.32          0.84     2.43
 Centerline Miles                                                                              0.96     4.07        8.92   13.94    0.87   2.57          6.34    10.00
 Dead Ends                                                                                        0        1           2        6      0       1             2       2
 Intersections                                                                                    1        5          14       21      0       3            12      16
 Intersections + Dead Ends                                                                        1        6          16       27      0       4            14      18
                                                                     Data Points                  1        7          16       28      1       5            10      18
 Walkscore
                                                                     Average Score               22       23          25       26     22      25            26      27
                                                                     TAZs                         0        2           2        4      0       1             2       2
 TAZ Data
                                                                     Total Area                0.00     1.56        1.56     2.42   0.00    0.79         1.56     1.56
                                                                     Dwelling Units               0        0           0        0      0       0             0       0
                                                                     Jobs                         0   12060       12060    16294       0   3876         12060    12060
 2005 SE Data                                                        DU/Acre                   0.00     0.00        0.00     0.00   0.00    0.00          0.00    0.00
                                                                     Jobs/Acre                 0.00    12.05       12.05    10.52   0.00   7.70         12.05    12.05
                                                                     AIM                       0.00     3.76        3.76     3.29   0.00    2.41         3.76     3.76
                                                                     Dwelling Units               0        0           0        0      0       0             0       0
                                                                     Jobs                         0   12795       12795    18190       0   4057         12795    12795
 2035 SE Data                                                        DU/Acre                   0.00     0.00        0.00     0.00   0.00    0.00          0.00    0.00
                                                                     Jobs/Acre                 0.00    12.78       12.78    11.74   0.00   8.06         12.78    12.78
                                                                     AIM                       0.00     3.99        3.99     3.67   0.00    2.52         3.99     3.99
                                                                                                          Radii                             Walk Time
 MOE                                                                 Optimal Value             1/4      1/2         3/4        1      5      10            15      20
                   2
 Sidewalk Miles/mi                                                   Optimal ≈ 50                0        0           1        1      0       1             1       1
 Centerline Miles/mi2                                                Optimal ≈ 25                 5       5           5        4       5      5             6        5
                       2
 Intersections/mi                                                    Optimal ≈ 200                5       6           8        7       0      6            11        9
 Intersections/(Intersections + Dead Ends)                           Optimal ≈ 1               0.00    0.83        0.88     0.78    0.00   0.00          0.00     0.00
 AIM (2005)                                                          Optimal ≈ 25               0.0     3.8         3.8      3.3     0.0    2.4           3.8      3.8
 AIM (2035)                                                          Optimal ≈ 25               0.0     4.0         4.0      3.7     0.0    2.5           4.0      4.0
                                                                                                          Radii                             Walk Time
 Score                                                               Range                     1/4      1/2         3/4        1      5      10            15      20
 Sidewalk Frontage Score                                                                         0        4          11       13      0       6             7      12
 Intersection Score                                                                              3        3           4        3      0       3             6       4
                                                                       0 = Worst; 100 = Best
 Average Walkscore (Within Band)                                                                22       23          25       26     22      25            26      27
 Street Network Score                                                                           20       21          20       18     21      19            23      21
                                                                               Total            11       13          15       15     11      13            15      16
 Sidewalk Frontage Score = Sidewalk Miles / (Centerline Miles * 2)                                        13                                  14
 Intersection Score = (Intersections/mi2)/ 200
 Street Network Score = (Centerline Miles/mi2) /25


                                                                                                                                                                         7
North RTP Station

                                                                                                          Radii                          Walk Time
  Within Band Statistics                                                                        1/4      1/2       3/4       1      5      10          15     20
 Area                                                                                          0.20    0.59       0.98   1.37    0.17   0.37         0.55   0.80
 Sidewalks Miles                                                                               0.00    0.35       1.62   1.54    0.00   0.32         0.53   1.59
 Centerline Miles                                                                              0.96    3.11       4.85   5.01    0.87   1.70         3.77   3.66
 Dead Ends                                                                                        0        1         1       4      0       1           1      0
 Intersections                                                                                    1        4         9       7      0       3           9      4
 Intersections + Dead Ends                                                                        1        5        10      11      0       4          10      4
                                                                     Data Points                  1        6         9      12      1       4           5      8
 Walkscore
                                                                     Average                     22       23        26      28     22      25          27     29
                                                                     TAZs                         0        2         0       2      0       1           1      0
 TAZ Data
                                                                     Total Area                0.00     1.56      0.00    0.86   0.00    0.79        0.78   0.00
                                                                     Dwelling Units               0        0         0       0      0       0           0      0
                                                                     Jobs                         0   12060          0   4234       0   3876         8184      0
 2005 SE Data                                                        DU/Acre                    0.0      0.0       0.0     0.0    0.0     0.0         0.0    0.0
                                                                     Jobs/Acre                  0.0    12.0        0.0     7.7    0.0     7.7        16.5    0.0
                                                                     AIM                        0.0      3.8       0.0     2.4    0.0     2.4         5.1    0.0
                                                                     Dwelling Units               0        0         0       0      0       0           0      0
                                                                     Jobs                         0   12795          0   5395       0   4057         8738      0
 2035 SE Data                                                        DU/Acre                    0.0      0.0       0.0     0.0    0.0     0.0         0.0    0.0
                                                                     Jobs/Acre                  0.0    12.8        0.0     9.8    0.0     8.1        17.6    0.0
                                                                     AIM                        0.0      4.0       0.0     3.1    0.0     2.5         5.5    0.0
                                                                                                          Radii                          Walk Time
 MOE                                                                 Optimal Value             1/4      1/2       3/4       1      5      10          15     20
                   2
 Sidewalk Miles/mi                                                   Optimal ≈ 50                0        1         2       1      0       1           1      2
 Centerline Miles/mi2                                                Optimal ≈ 25                 5       5          5      4       5      5            7      5
                       2
 Intersections/mi                                                    Optimal ≈ 200                5       7          9      5       0      8           16      5
 Intersections/(Intersections + Dead Ends)                           Optimal ≈ 1               0.00    0.80       0.90   0.64    0.00   0.00         0.00   0.00
 AIM (2005)                                                          Optimal ≈ 25               0.0     3.8        0.0    2.4     0.0    2.4          5.1    0.0
 AIM (2035)                                                          Optimal ≈ 25               0.0     4.0        0.0    3.1     0.0    2.5          5.5    0.0
                                                                                                          Radii                          Walk Time
 Score                                                               Range                     1/4      1/2       3/4       1      5      10          15     20
 Sidewalk Frontage Score                                                                         0        6        17      15      0       9           7     22
 Intersection Score                                                                              3        3         5       3      0       4           8      3
                                                                       0 = Worst; 100 = Best
 Average Walkscore (Within Band)                                                                22       23        26      28     22      25          27     29
 Street Network Score                                                                           20       21        20      15     21      19          27     18
                                                                               Total            11       13        17      15     11      14          17     18
 Sidewalk Frontage Score = Sidewalk Miles / (Centerline Miles * 2)                                        14                               15
 Intersection Score = (Intersections/mi2)/ 200
 Street Network Score = (Centerline Miles/mi2) /25


                                                                                                                                                                   8

More Related Content

Viewers also liked (10)

New Hope Church Station
New Hope Church StationNew Hope Church Station
New Hope Church Station
 
Downtown Raleigh Station
Downtown Raleigh StationDowntown Raleigh Station
Downtown Raleigh Station
 
好的情緒想法就會有好的運
好的情緒想法就會有好的運好的情緒想法就會有好的運
好的情緒想法就會有好的運
 
www.TromborgLindskov.dk
www.TromborgLindskov.dkwww.TromborgLindskov.dk
www.TromborgLindskov.dk
 
Portfolio Show
Portfolio ShowPortfolio Show
Portfolio Show
 
COULD THE NEXT GOOGLE COME FROM LATIN AMERICA?
COULD THE  NEXT GOOGLE COME FROM LATIN AMERICA?COULD THE  NEXT GOOGLE COME FROM LATIN AMERICA?
COULD THE NEXT GOOGLE COME FROM LATIN AMERICA?
 
Ejercicios para habilidades conceptuales
Ejercicios para habilidades conceptualesEjercicios para habilidades conceptuales
Ejercicios para habilidades conceptuales
 
Air motor gast catalogue
Air motor gast catalogueAir motor gast catalogue
Air motor gast catalogue
 
Thank You For Smoking Review
Thank You For Smoking ReviewThank You For Smoking Review
Thank You For Smoking Review
 
沙子與石頭
沙子與石頭沙子與石頭
沙子與石頭
 

North RTP Station

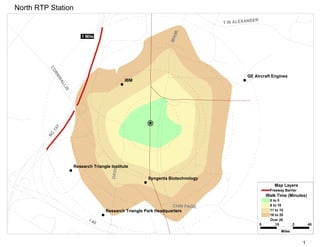
  • 1. North RTP Station DER T W ALEXAN MI 1 Mile MIA CO RN GE Aircraft Engines W IBM AL LIS 7 14 NC Research Triangle Institute DAVIS Syngenta Biotechnology Map Layers Freeway Barrier Walk Time (Minutes) 0 to 5 CHIN PAGE 6 to 10 Research Triangle Park Headquarters 11 to 15 16 to 20 I4 Over 20 0 0 .15 .3 .45 Miles 1
  • 2. North RTP Station DER T W ALEXAN MI 1 Mile MIA CO RN GE Aircraft Engines W IBM AL LIS 7 14 NC Research Triangle Institute DAVIS Syngenta Biotechnology Walkscores Below 25 25 to 49 50 to 59 CHIN PAGE 60 to 69 Research Triangle Park Headquarters 70 to 79 80 to 89 I4 90 to 100 0 0 .15 .3 .45 Miles 2
  • 3. North RTP Station DER T W ALEXAN MI 1 Mile MIA CO RN GE Aircraft Engines W IBM AL LIS 7 14 NC Research Triangle Institute DAVIS Activity Intensity Measure (2005) Syngenta Biotechnology Below 2 2 to 3.9 4 to 5.9 6 to 7.9 8 to 9.9 CHIN PAGE 10 to 11.9 Research Triangle Park Headquarters 12 to 13.9 14 to 15.9 I4 16 and Above 0 0 .15 .3 .45 Miles 3
  • 4. North RTP Station DER T W ALEXAN MI 1 Mile MIA CO RN GE Aircraft Engines W IBM AL LIS 7 14 NC Research Triangle Institute DAVIS Activity Intensity Measure (2035) Syngenta Biotechnology Below 2 2 to 3.9 4 to 5.9 6 to 7.9 8 to 9.9 CHIN PAGE 10 to 11.9 Research Triangle Park Headquarters 12 to 13.9 14 to 15.9 I4 16 and Above 0 0 .15 .3 .45 Miles 4
  • 5. North RTP Station DER T W ALEXAN MI 1 Mile MIA CO RN W AL LIS 7 14 NC DAVIS Map Layers Intersections Walk Time (Minutes) 0 to 5 CHIN PAGE 6 to 10 11 to 15 16 to 20 I4 Over 20 0 0 .15 .3 .45 Miles 5
  • 6. North RTP Station DER T W ALEXAN MI 1 Mile MIA CO RN W AL LIS 7 14 NC DAVIS Map Layers Missing Sidewalks Sidewalks Walk Time (Minutes) 0 to 5 CHIN PAGE 6 to 10 11 to 15 16 to 20 I4 Over 20 0 0 .15 .3 .45 Miles 6
  • 7. North RTP Station Radii Walk Time Aggregate Statistics 1/4 1/2 3/4 1 5 10 15 20 Area 0.20 0.79 1.77 3.14 0.17 0.53 1.08 1.88 Sidewalks Miles 0.00 0.35 1.97 3.51 0.00 0.32 0.84 2.43 Centerline Miles 0.96 4.07 8.92 13.94 0.87 2.57 6.34 10.00 Dead Ends 0 1 2 6 0 1 2 2 Intersections 1 5 14 21 0 3 12 16 Intersections + Dead Ends 1 6 16 27 0 4 14 18 Data Points 1 7 16 28 1 5 10 18 Walkscore Average Score 22 23 25 26 22 25 26 27 TAZs 0 2 2 4 0 1 2 2 TAZ Data Total Area 0.00 1.56 1.56 2.42 0.00 0.79 1.56 1.56 Dwelling Units 0 0 0 0 0 0 0 0 Jobs 0 12060 12060 16294 0 3876 12060 12060 2005 SE Data DU/Acre 0.00 0.00 0.00 0.00 0.00 0.00 0.00 0.00 Jobs/Acre 0.00 12.05 12.05 10.52 0.00 7.70 12.05 12.05 AIM 0.00 3.76 3.76 3.29 0.00 2.41 3.76 3.76 Dwelling Units 0 0 0 0 0 0 0 0 Jobs 0 12795 12795 18190 0 4057 12795 12795 2035 SE Data DU/Acre 0.00 0.00 0.00 0.00 0.00 0.00 0.00 0.00 Jobs/Acre 0.00 12.78 12.78 11.74 0.00 8.06 12.78 12.78 AIM 0.00 3.99 3.99 3.67 0.00 2.52 3.99 3.99 Radii Walk Time MOE Optimal Value 1/4 1/2 3/4 1 5 10 15 20 2 Sidewalk Miles/mi Optimal ≈ 50 0 0 1 1 0 1 1 1 Centerline Miles/mi2 Optimal ≈ 25 5 5 5 4 5 5 6 5 2 Intersections/mi Optimal ≈ 200 5 6 8 7 0 6 11 9 Intersections/(Intersections + Dead Ends) Optimal ≈ 1 0.00 0.83 0.88 0.78 0.00 0.00 0.00 0.00 AIM (2005) Optimal ≈ 25 0.0 3.8 3.8 3.3 0.0 2.4 3.8 3.8 AIM (2035) Optimal ≈ 25 0.0 4.0 4.0 3.7 0.0 2.5 4.0 4.0 Radii Walk Time Score Range 1/4 1/2 3/4 1 5 10 15 20 Sidewalk Frontage Score 0 4 11 13 0 6 7 12 Intersection Score 3 3 4 3 0 3 6 4 0 = Worst; 100 = Best Average Walkscore (Within Band) 22 23 25 26 22 25 26 27 Street Network Score 20 21 20 18 21 19 23 21 Total 11 13 15 15 11 13 15 16 Sidewalk Frontage Score = Sidewalk Miles / (Centerline Miles * 2) 13 14 Intersection Score = (Intersections/mi2)/ 200 Street Network Score = (Centerline Miles/mi2) /25 7
  • 8. North RTP Station Radii Walk Time Within Band Statistics 1/4 1/2 3/4 1 5 10 15 20 Area 0.20 0.59 0.98 1.37 0.17 0.37 0.55 0.80 Sidewalks Miles 0.00 0.35 1.62 1.54 0.00 0.32 0.53 1.59 Centerline Miles 0.96 3.11 4.85 5.01 0.87 1.70 3.77 3.66 Dead Ends 0 1 1 4 0 1 1 0 Intersections 1 4 9 7 0 3 9 4 Intersections + Dead Ends 1 5 10 11 0 4 10 4 Data Points 1 6 9 12 1 4 5 8 Walkscore Average 22 23 26 28 22 25 27 29 TAZs 0 2 0 2 0 1 1 0 TAZ Data Total Area 0.00 1.56 0.00 0.86 0.00 0.79 0.78 0.00 Dwelling Units 0 0 0 0 0 0 0 0 Jobs 0 12060 0 4234 0 3876 8184 0 2005 SE Data DU/Acre 0.0 0.0 0.0 0.0 0.0 0.0 0.0 0.0 Jobs/Acre 0.0 12.0 0.0 7.7 0.0 7.7 16.5 0.0 AIM 0.0 3.8 0.0 2.4 0.0 2.4 5.1 0.0 Dwelling Units 0 0 0 0 0 0 0 0 Jobs 0 12795 0 5395 0 4057 8738 0 2035 SE Data DU/Acre 0.0 0.0 0.0 0.0 0.0 0.0 0.0 0.0 Jobs/Acre 0.0 12.8 0.0 9.8 0.0 8.1 17.6 0.0 AIM 0.0 4.0 0.0 3.1 0.0 2.5 5.5 0.0 Radii Walk Time MOE Optimal Value 1/4 1/2 3/4 1 5 10 15 20 2 Sidewalk Miles/mi Optimal ≈ 50 0 1 2 1 0 1 1 2 Centerline Miles/mi2 Optimal ≈ 25 5 5 5 4 5 5 7 5 2 Intersections/mi Optimal ≈ 200 5 7 9 5 0 8 16 5 Intersections/(Intersections + Dead Ends) Optimal ≈ 1 0.00 0.80 0.90 0.64 0.00 0.00 0.00 0.00 AIM (2005) Optimal ≈ 25 0.0 3.8 0.0 2.4 0.0 2.4 5.1 0.0 AIM (2035) Optimal ≈ 25 0.0 4.0 0.0 3.1 0.0 2.5 5.5 0.0 Radii Walk Time Score Range 1/4 1/2 3/4 1 5 10 15 20 Sidewalk Frontage Score 0 6 17 15 0 9 7 22 Intersection Score 3 3 5 3 0 4 8 3 0 = Worst; 100 = Best Average Walkscore (Within Band) 22 23 26 28 22 25 27 29 Street Network Score 20 21 20 15 21 19 27 18 Total 11 13 17 15 11 14 17 18 Sidewalk Frontage Score = Sidewalk Miles / (Centerline Miles * 2) 14 15 Intersection Score = (Intersections/mi2)/ 200 Street Network Score = (Centerline Miles/mi2) /25 8