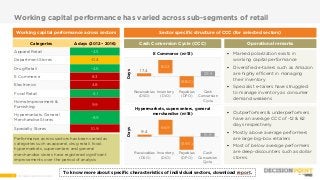
Like many companies, retail companies need to reward their shareholders. But with 3 out of every 5 retailers exceeding their net income with payments to shareholders via dividend payments and repurchases, managing working capital has become essential to generating a positive impact on cash flow. WNS DecisionPoint™ analyzed the working capital performance of 147 publicly listed retailers from North America and Europe, across nine global sectors for the years 2012 through 2016. Our analysis shows that most retailers have been unable to sustain improvements in their performance so far.
This report looks at why that is and where improvements can be made to working capital management. It looks at 9 retail sectors and examines how Day Sales Outstanding, Days Inventory Outstanding, and Days Payable Outstanding affect the Cash Conversion Cycle of each sector. They reveal trends in each of the 9 sectors and allow us to create a Working Capital Management Playbook.
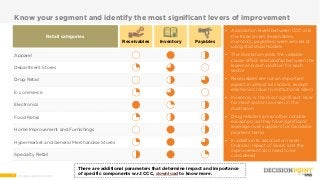
Discover some of the key strategies in the Working Capital Management Playbook, including:
- Extension of net payment terms: The extension of payment terms with suppliers allows retailers to achieve a longer payables cycle, which can enable companies to hold on to their cash longer.
- Assortment rationalization: Retailers need to optimize their assortments, eliminating products that do not draw crowds or sell well, to achieve higher inventory efficiency.
- Supplier segmentation to allocate payments: Retailers need to place suppliers in different categories in order to optimize the method and terms of payment with each.
To discover the detailed roadmap toward better working capital management, read the full report at
https://www.wnsdecisionpoint.com/our-insights/reports/detail/61/managing-working-capital-to-unlock-value-in-retail