SlideShare a Scribd company logo
Relationship Between Psychosocial Stress and Intuitive
Eating in Overweight Latino and African American Youth
Vennis Hong1, Claudia M. Toledo-Corral, PhD2, Beth Hoffman, PhD2
1University of California, San Diego, 2California State University, Los Angeles
INTRODUCTION
OBJECTIVE
METHODS
ACKNOWLEDGEMENTS
STRENGTHS & LIMITATIONS
CONCLUSIONS
SUMMARY
RESULTS
• Nearly 1/3 of the child and adolescent
population in the US is obese
• Stress and eating behaviors have been
linked to obesity
• Intuitive eating is the ability to eat in
accordance with physiological cues
• Limited knowledge exists on the association
between psychosocial stress and intuitive
eating (IE) behaviors
To investigate the relationship between
psychosocial stressors and intuitive eating and
to propose cortisol as a biological mechanism
for this relationship
• Variables
• Intuitive eating score
• Perceived stress score (PSS)
• Stressful life events (LES)
• Cortisol
• Participants: Diabetes Risk due to Ectopic
Adiposity in Minority youth (DREAM) Study
• 183 boys and girls, ages 8-17
• Mean IE score (SD): 3.61(0.44) out of 5
• Mean PSS (SD): 23.69 (5.73) out of 56
• Mean LES (SD): 20.16 (11.60) out of 66
• Statistical Analysis
• Multiple linear regression, adjusted for
age, ethnicity, sex, percent body fat,
and SES
• Perceived stress was negatively associated with
intuitive eating behaviors.
• Nighttime salivary cortisol at 2200 was negatively
correlated with intuitive eating behaviors.
• No association was observed between stress and
cortisol.
• Psychosocial stress may play a role in
intuitive eating behaviors.
• Cortisol does not appear to be a biological
mechanism for this relationship.
• Future studies should take into account
participants’ overall wellbeing, coping
strategies, and lifestyle.
• Future studies should also include a white
comparison group to determine whether
minority status contributes to this
relationship.
.
• One of few studies to examine
psychosocial stress and IE
• Focus on an understudied population
• Causality cannot be established
• Possible confounding by resilience,
coping strategies, and wellbeing
• May not be generalizable to other
races/ethnicities
• CDC Cooperative Agreement Number
3U50MN000025
• The study was funded by NIH
Grant P60 MD00254 (M.I. Goran &
M.J. Weigensberg)
Table 1
Regression of Intuitive Eating on Stress Measures
Dependent Variable: Intuitive
Eating
Perceived Stress B
P-value
95% CI
-0.02 + 0.01
< 0.01
(-0.03, -0.01)
School-Related Stressful Life Events B
P-Value
95% CI
-0.001 + 0.01
0.95
(-0.02, 0.02)
Family-Related Stressful Life Events B
P-value
95% CI
-0.01 + 0.01
0.20
(-0.03, 0.01)
Personal Stressful Life Events B
P-value
95% CI
-0.01 + 0.01
0.46
(-0.03, 0.02)
Peer-Related Stressful Life Events B
P-Value
95% CI
-0.01 + 0.01
0.223
(-0.03, 0.01)
Table 2
Regression of Intuitive Eating on Cortisol
Dependent Variable:
Intuitive Eating
Urinary Free Cortisol B
P-Value
95% CI
0.02 + 0.04
0.56
(-0.06, 0.11)
Salivary Cortisol at 2200 B
P-Value
95% CI
-0.08 + 0.03
0.04
(-0.15, -0.01)
Salivary Cortisol at 0530 B
P-Value
95% CI
0.04 + 0.08
0.64
(-0.11, 0.18)
Salivary Cortisol at 0600 B
P-Value
95% CI
-0.02 + 0.07
0.73
(-0.16, 0.11)
Serum Cortisol at 0800 B
P-Value
95% CI
-0.01 + 0.01
0.27
(-0.031, 0.01)
Nocturnal Cortisol Rise B
P-Value
95% CI
0.08 + 0.07
0.26
(-0.06, 0.23)
Cortisol Awakening Response B
P-Value
95% CI
-0.04 + 0.07
0.54
(-0.17, 0.09)
Table 3
Regression of Cortisol Measures on Stress Measures
Dependent Variables
Natural Log of
Urinary Free
Cortisol
Natural Log of
Salivary Cortisol
2200
Salivary Cortisol
0530
Salivary Cortisol
0600
Serum Cortisol
0800
Nocturnal Cortisol
Rise
Cortisol Awakening
Response
Perceived Stress B
P-Value
95% CI
-0.03 + 0.02
0.107
(-0.07, 0.01)
0.01 + 0.01
0.34
(-0.01, 0.04)
0.004 + 0.01
0.56
(-0.01, 0.02)
-0.01 + 0.01
0.87
(-0.02, 0.02)
-0.05 + 0.05
0.35
(-0.15, 0.06)
0.01 + 0.01
0.56
(-0.01, 0.02)
-0.002 + 0.01
0.84
(-0.02, 0.02)
School-Related Stressful Life Events B
P-Value
95% CI
0.02 + 0.50
0.64
(-0.08, 0.12)
0.004 + 0.02
0.83
(-0.03, 0.04)
-0.01 + 0.01
0.55
(-0.02, 0.01)
-0.003 + 0.01
0.73
(-0.02, 0.02)
0.07 + 0.06
0.26
(-0.05, 0.20)
-0.01 + 0.01
0.49
(-0.03, 0.01)
0.004 + 0.01
0.73
(-0.02, 0.03)
Family-Related Stressful Life Events B
P-Value
95% CI
-0.002 + 0.02
0.95
(-0.05, 0.05)
-0.001 + 0.02
0.95
(-0.04, 0.04)
-0.01 + 0.01
0.70
(-0.03 0.02)
0.02 + 0.01
0.21
(-0.01, 0.04)
-0.05 + 0.08
0.55
(-0.21, 0.11)
-0.003 + 0.01
0.83
(-0.03, 0.02)
0.02 + 0.02
0.29
(-0.01, 0.04)
Personal Stressful Life Events B
P-Value
95% CI
-0.01 + 0.03
0.71
(-0.07, 0.05)
0.03 + 0.03
0.34
(-0.03, 0.08)
0.00 + 0.02
0.99
(-0.03, 0.03)
0.02 + 0.02
0.16
(-0.01, 0.06)
-0.06 + 0.10
0.56
(-0.25, 0.14)
-0.01 + 0.02
0.70
(-0.04, 0.02)
0.02 + 0.02
0.22
(-0.01, 0.06)
Peer-Related Stressful Life Events B
P-Value
95% CI
-0.002 + 0.03
0.93
(-0.06, 0.05)
0.01 + 0.02
0.64
(-0.03, 0.05)
-0.02 + 0.01
0.23
(-0.04, 0.01)
0.01 + 0.01
0.45
(-0.02, 0.04)
-0.02 + 0.08
0.78
(-0.19, 0.14)
-0.02 + 0.01
0.21
(-0.04, 0.01)
0.03 + 0.01
0.08
(-0.003, 0.05)

More Related Content

Similar to Hong_Vennis_Poster

McKay_APA 2013 presentation
McKay_APA 2013 presentationMcKay_APA 2013 presentation
McKay_APA 2013 presentationMichael McKay
 
Things that Go MUNCH In the Night - CME, Henderson, KY
Things that Go MUNCH In the Night - CME, Henderson, KYThings that Go MUNCH In the Night - CME, Henderson, KY
Things that Go MUNCH In the Night - CME, Henderson, KY
Louis Cady, MD
 
13. Construyendo capacidades locales para la Seguridad Alimentaria y Nutricional
13. Construyendo capacidades locales para la Seguridad Alimentaria y Nutricional13. Construyendo capacidades locales para la Seguridad Alimentaria y Nutricional
13. Construyendo capacidades locales para la Seguridad Alimentaria y Nutricional
Programa Mundial de Alimentos
 
Increasing energy density of unappetizing foods is associated with lower weig...
Increasing energy density of unappetizing foods is associated with lower weig...Increasing energy density of unappetizing foods is associated with lower weig...
Increasing energy density of unappetizing foods is associated with lower weig...
JenniferSadler9
 
The stress-buffering model of social support in glycaemic control in adolesce...
The stress-buffering model of social support in glycaemic control in adolesce...The stress-buffering model of social support in glycaemic control in adolesce...
The stress-buffering model of social support in glycaemic control in adolesce...
Emily Mattacola
 
Workshop on well being over the life course agenda layard
Workshop on well being over the life course agenda layardWorkshop on well being over the life course agenda layard
Workshop on well being over the life course agenda layard
StatsCommunications
 
Obesity obesity and mental health 11-may-2015
Obesity obesity and mental health 11-may-2015Obesity obesity and mental health 11-may-2015
Obesity obesity and mental health 11-may-2015
WALID SARHAN
 
Matthew_Frank_Final_CE_Poster
Matthew_Frank_Final_CE_PosterMatthew_Frank_Final_CE_Poster
Matthew_Frank_Final_CE_PosterMatthew Frank
 
Obesity and Physical Activity & SRH Poster
Obesity and Physical Activity & SRH PosterObesity and Physical Activity & SRH Poster
Obesity and Physical Activity & SRH PosterErin Flores, MPH
 
Israt ara hossain nst 17-18
Israt ara hossain nst 17-18Israt ara hossain nst 17-18
Israt ara hossain nst 17-18
Muhammad Tareque Hasan
 
Eating Disorders and Self Esteem in Adolescents, Teens, and .docx
Eating Disorders and Self Esteem in Adolescents, Teens, and .docxEating Disorders and Self Esteem in Adolescents, Teens, and .docx
Eating Disorders and Self Esteem in Adolescents, Teens, and .docx
jacksnathalie
 
glucosePosterWorking_SPSP 2016
glucosePosterWorking_SPSP 2016glucosePosterWorking_SPSP 2016
glucosePosterWorking_SPSP 2016Elizabeth McCrary
 
Eating Disorders Process Addiction
Eating Disorders Process AddictionEating Disorders Process Addiction
Eating Disorders Process Addiction
drleighholman
 
Hypertension and Cardiovascular Disease Clinical Nutrition Case Study
Hypertension and Cardiovascular Disease Clinical Nutrition Case StudyHypertension and Cardiovascular Disease Clinical Nutrition Case Study
Hypertension and Cardiovascular Disease Clinical Nutrition Case Study
DawnAnderson14
 
A clinical perspective - is obesity a disease?
A clinical perspective -  is obesity a disease?A clinical perspective -  is obesity a disease?
A clinical perspective - is obesity a disease?
Gary Wittert
 
Biological Aspects Of Obesity Related Eating Disorders111
Biological Aspects Of Obesity Related Eating Disorders111Biological Aspects Of Obesity Related Eating Disorders111
Biological Aspects Of Obesity Related Eating Disorders111VeoMed
 
Eating disorders and other childhood feeding disorder
Eating disorders and other childhood feeding disorderEating disorders and other childhood feeding disorder
Eating disorders and other childhood feeding disorder
Diptadhi Mukherjee
 

Similar to Hong_Vennis_Poster (20)

McKay_APA 2013 presentation
McKay_APA 2013 presentationMcKay_APA 2013 presentation
McKay_APA 2013 presentation
 
KECK STUDY
KECK STUDYKECK STUDY
KECK STUDY
 
Things that Go MUNCH In the Night - CME, Henderson, KY
Things that Go MUNCH In the Night - CME, Henderson, KYThings that Go MUNCH In the Night - CME, Henderson, KY
Things that Go MUNCH In the Night - CME, Henderson, KY
 
13. Construyendo capacidades locales para la Seguridad Alimentaria y Nutricional
13. Construyendo capacidades locales para la Seguridad Alimentaria y Nutricional13. Construyendo capacidades locales para la Seguridad Alimentaria y Nutricional
13. Construyendo capacidades locales para la Seguridad Alimentaria y Nutricional
 
Increasing energy density of unappetizing foods is associated with lower weig...
Increasing energy density of unappetizing foods is associated with lower weig...Increasing energy density of unappetizing foods is associated with lower weig...
Increasing energy density of unappetizing foods is associated with lower weig...
 
The stress-buffering model of social support in glycaemic control in adolesce...
The stress-buffering model of social support in glycaemic control in adolesce...The stress-buffering model of social support in glycaemic control in adolesce...
The stress-buffering model of social support in glycaemic control in adolesce...
 
Workshop on well being over the life course agenda layard
Workshop on well being over the life course agenda layardWorkshop on well being over the life course agenda layard
Workshop on well being over the life course agenda layard
 
Obesity obesity and mental health 11-may-2015
Obesity obesity and mental health 11-may-2015Obesity obesity and mental health 11-may-2015
Obesity obesity and mental health 11-may-2015
 
Matthew_Frank_Final_CE_Poster
Matthew_Frank_Final_CE_PosterMatthew_Frank_Final_CE_Poster
Matthew_Frank_Final_CE_Poster
 
Obesity and Physical Activity & SRH Poster
Obesity and Physical Activity & SRH PosterObesity and Physical Activity & SRH Poster
Obesity and Physical Activity & SRH Poster
 
Israt ara hossain nst 17-18
Israt ara hossain nst 17-18Israt ara hossain nst 17-18
Israt ara hossain nst 17-18
 
Eating Disorders and Self Esteem in Adolescents, Teens, and .docx
Eating Disorders and Self Esteem in Adolescents, Teens, and .docxEating Disorders and Self Esteem in Adolescents, Teens, and .docx
Eating Disorders and Self Esteem in Adolescents, Teens, and .docx
 
glucosePosterWorking_SPSP 2016
glucosePosterWorking_SPSP 2016glucosePosterWorking_SPSP 2016
glucosePosterWorking_SPSP 2016
 
Eating Disorders Process Addiction
Eating Disorders Process AddictionEating Disorders Process Addiction
Eating Disorders Process Addiction
 
Zehra Sasal POSTER
Zehra Sasal POSTERZehra Sasal POSTER
Zehra Sasal POSTER
 
Obesity p pp
Obesity p ppObesity p pp
Obesity p pp
 
Hypertension and Cardiovascular Disease Clinical Nutrition Case Study
Hypertension and Cardiovascular Disease Clinical Nutrition Case StudyHypertension and Cardiovascular Disease Clinical Nutrition Case Study
Hypertension and Cardiovascular Disease Clinical Nutrition Case Study
 
A clinical perspective - is obesity a disease?
A clinical perspective -  is obesity a disease?A clinical perspective -  is obesity a disease?
A clinical perspective - is obesity a disease?
 
Biological Aspects Of Obesity Related Eating Disorders111
Biological Aspects Of Obesity Related Eating Disorders111Biological Aspects Of Obesity Related Eating Disorders111
Biological Aspects Of Obesity Related Eating Disorders111
 
Eating disorders and other childhood feeding disorder
Eating disorders and other childhood feeding disorderEating disorders and other childhood feeding disorder
Eating disorders and other childhood feeding disorder
 

Hong_Vennis_Poster

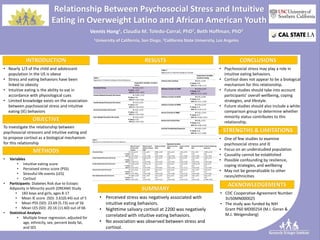
  • 1. Relationship Between Psychosocial Stress and Intuitive Eating in Overweight Latino and African American Youth Vennis Hong1, Claudia M. Toledo-Corral, PhD2, Beth Hoffman, PhD2 1University of California, San Diego, 2California State University, Los Angeles INTRODUCTION OBJECTIVE METHODS ACKNOWLEDGEMENTS STRENGTHS & LIMITATIONS CONCLUSIONS SUMMARY RESULTS • Nearly 1/3 of the child and adolescent population in the US is obese • Stress and eating behaviors have been linked to obesity • Intuitive eating is the ability to eat in accordance with physiological cues • Limited knowledge exists on the association between psychosocial stress and intuitive eating (IE) behaviors To investigate the relationship between psychosocial stressors and intuitive eating and to propose cortisol as a biological mechanism for this relationship • Variables • Intuitive eating score • Perceived stress score (PSS) • Stressful life events (LES) • Cortisol • Participants: Diabetes Risk due to Ectopic Adiposity in Minority youth (DREAM) Study • 183 boys and girls, ages 8-17 • Mean IE score (SD): 3.61(0.44) out of 5 • Mean PSS (SD): 23.69 (5.73) out of 56 • Mean LES (SD): 20.16 (11.60) out of 66 • Statistical Analysis • Multiple linear regression, adjusted for age, ethnicity, sex, percent body fat, and SES • Perceived stress was negatively associated with intuitive eating behaviors. • Nighttime salivary cortisol at 2200 was negatively correlated with intuitive eating behaviors. • No association was observed between stress and cortisol. • Psychosocial stress may play a role in intuitive eating behaviors. • Cortisol does not appear to be a biological mechanism for this relationship. • Future studies should take into account participants’ overall wellbeing, coping strategies, and lifestyle. • Future studies should also include a white comparison group to determine whether minority status contributes to this relationship. . • One of few studies to examine psychosocial stress and IE • Focus on an understudied population • Causality cannot be established • Possible confounding by resilience, coping strategies, and wellbeing • May not be generalizable to other races/ethnicities • CDC Cooperative Agreement Number 3U50MN000025 • The study was funded by NIH Grant P60 MD00254 (M.I. Goran & M.J. Weigensberg) Table 1 Regression of Intuitive Eating on Stress Measures Dependent Variable: Intuitive Eating Perceived Stress B P-value 95% CI -0.02 + 0.01 < 0.01 (-0.03, -0.01) School-Related Stressful Life Events B P-Value 95% CI -0.001 + 0.01 0.95 (-0.02, 0.02) Family-Related Stressful Life Events B P-value 95% CI -0.01 + 0.01 0.20 (-0.03, 0.01) Personal Stressful Life Events B P-value 95% CI -0.01 + 0.01 0.46 (-0.03, 0.02) Peer-Related Stressful Life Events B P-Value 95% CI -0.01 + 0.01 0.223 (-0.03, 0.01) Table 2 Regression of Intuitive Eating on Cortisol Dependent Variable: Intuitive Eating Urinary Free Cortisol B P-Value 95% CI 0.02 + 0.04 0.56 (-0.06, 0.11) Salivary Cortisol at 2200 B P-Value 95% CI -0.08 + 0.03 0.04 (-0.15, -0.01) Salivary Cortisol at 0530 B P-Value 95% CI 0.04 + 0.08 0.64 (-0.11, 0.18) Salivary Cortisol at 0600 B P-Value 95% CI -0.02 + 0.07 0.73 (-0.16, 0.11) Serum Cortisol at 0800 B P-Value 95% CI -0.01 + 0.01 0.27 (-0.031, 0.01) Nocturnal Cortisol Rise B P-Value 95% CI 0.08 + 0.07 0.26 (-0.06, 0.23) Cortisol Awakening Response B P-Value 95% CI -0.04 + 0.07 0.54 (-0.17, 0.09) Table 3 Regression of Cortisol Measures on Stress Measures Dependent Variables Natural Log of Urinary Free Cortisol Natural Log of Salivary Cortisol 2200 Salivary Cortisol 0530 Salivary Cortisol 0600 Serum Cortisol 0800 Nocturnal Cortisol Rise Cortisol Awakening Response Perceived Stress B P-Value 95% CI -0.03 + 0.02 0.107 (-0.07, 0.01) 0.01 + 0.01 0.34 (-0.01, 0.04) 0.004 + 0.01 0.56 (-0.01, 0.02) -0.01 + 0.01 0.87 (-0.02, 0.02) -0.05 + 0.05 0.35 (-0.15, 0.06) 0.01 + 0.01 0.56 (-0.01, 0.02) -0.002 + 0.01 0.84 (-0.02, 0.02) School-Related Stressful Life Events B P-Value 95% CI 0.02 + 0.50 0.64 (-0.08, 0.12) 0.004 + 0.02 0.83 (-0.03, 0.04) -0.01 + 0.01 0.55 (-0.02, 0.01) -0.003 + 0.01 0.73 (-0.02, 0.02) 0.07 + 0.06 0.26 (-0.05, 0.20) -0.01 + 0.01 0.49 (-0.03, 0.01) 0.004 + 0.01 0.73 (-0.02, 0.03) Family-Related Stressful Life Events B P-Value 95% CI -0.002 + 0.02 0.95 (-0.05, 0.05) -0.001 + 0.02 0.95 (-0.04, 0.04) -0.01 + 0.01 0.70 (-0.03 0.02) 0.02 + 0.01 0.21 (-0.01, 0.04) -0.05 + 0.08 0.55 (-0.21, 0.11) -0.003 + 0.01 0.83 (-0.03, 0.02) 0.02 + 0.02 0.29 (-0.01, 0.04) Personal Stressful Life Events B P-Value 95% CI -0.01 + 0.03 0.71 (-0.07, 0.05) 0.03 + 0.03 0.34 (-0.03, 0.08) 0.00 + 0.02 0.99 (-0.03, 0.03) 0.02 + 0.02 0.16 (-0.01, 0.06) -0.06 + 0.10 0.56 (-0.25, 0.14) -0.01 + 0.02 0.70 (-0.04, 0.02) 0.02 + 0.02 0.22 (-0.01, 0.06) Peer-Related Stressful Life Events B P-Value 95% CI -0.002 + 0.03 0.93 (-0.06, 0.05) 0.01 + 0.02 0.64 (-0.03, 0.05) -0.02 + 0.01 0.23 (-0.04, 0.01) 0.01 + 0.01 0.45 (-0.02, 0.04) -0.02 + 0.08 0.78 (-0.19, 0.14) -0.02 + 0.01 0.21 (-0.04, 0.01) 0.03 + 0.01 0.08 (-0.003, 0.05)