
Recommended
Recommended
More Related Content
Similar to Wef gci4 2019_profile_vnm_vietnam
Similar to Wef gci4 2019_profile_vnm_vietnam (19)
More from TunAnh346
More from TunAnh346 (11)
Recently uploaded
Recently uploaded (20)
Wef gci4 2019_profile_vnm_vietnam
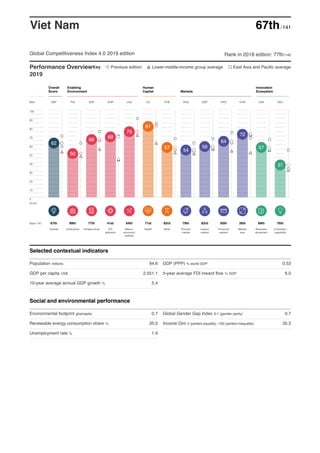
- 1. Key Previous edition Lower-middle-income group average East Asia and Pacific averagePerformance Overview 2019 Best Rank /141 Score 0 10 20 30 40 50 60 70 80 90 100 Overall Score Enabling Environment Human Capital Markets Innovation Ecosystem SGP FIN SGP KOR (33) (4) CHE HKG SGP HKG CHN USA DEU 67th 89th 77th 41st 64th 71st 93rd 79th 83rd 60th 26th 89th 76th Overall Institutions Infrastructure ICT adoption Macro- economic stability Health Skills Product market Labour market Financial system Market size Business dynamism Innovation capability 62 50 66 69 75 81 57 54 58 64 72 57 37 Viet Nam 67th/141 Global Competitiveness Index 4.0 2019 edition Rank in 2018 edition: 77th/140 Selected contextual indicators Social and environmental performance Population millions GDP per capita US$ 10-year average annual GDP growth % GDP (PPP) % world GDP 5-year average FDI inward flow % GDP Environmental footprint gha/capita Renewable energy consumption share % Unemployment rate % Global Gender Gap Index 0-1 (gender parity) Income Gini 0 (perfect equality) -100 (perfect inequality) 94.6 2,551.1 5.4 0.53 6.0 0.7 35.0 1.9 0.7 35.3
- 2. Viet Nam 67th/141 Index Component Value Score * Rank/141 Best Performer 0–100 - 49.8 89 Finland 1st pillar: Institutions Security 0–100 - 77.2 61 Finland 1.01 Organized crime 1–7 (best) 4.6 59.2 76 Finland 1.02 Homicide rate per 100,000 pop. 1.5 96.6 51 Multiple (14) 1.03 Terrorism incidence 0 (very high) -100 (no incidence) 100.0 100.0 = 1 Multiple (25) 1.04 Reliability of police services 1–7 (best) 4.2 53.0 79 Finland Social capital 0–100 - 48.0 90 New Zealand 1.05 Social capital 0–100 (best) 48.0 48.0 82 New Zealand Checks and balances 0–100 - 31.0 135 Finland 1.06 Budget transparency 0–100 (best) 15 15.0 84 Multiple (2) 1.07 Judicial independence 1–7 (best) 3.5 40.9 85 Finland 1.08 Efficiency of legal framework in challenging regulations 1–7 (best) 3.6 42.9 59 Finland 1.09 Freedom of the press 0–100 (worst) 74.9 25.1 139 Norway Public-sector performance 0–100 - 50.7 73 Singapore 1.10 Burden of government regulation 1–7 (best) 3.4 39.8 79 Singapore 1.11 Efficiency of legal framework in settling disputes 1–7 (best) 3.6 43.0 76 Singapore 1.12 E-Participation 0–1 (best) 0.69 69.1 = 69 Multiple (3) Transparency 0–100 - 33.0 101 Denmark 1.13 Incidence of corruption 0–100 (best) 33.0 33.0 101 Denmark Property rights 0–100 - 46.9 92 Finland 1.14 Property rights 1–7 (best) 4.0 49.8 98 Finland 1.15 Intellectual property protection 1–7 (best) 3.7 44.4 105 Finland 1.16 Quality of land administration 0–30 (best) 14.0 46.7 = 80 Multiple (5) Corporate governance 0–100 - 51.1 104 New Zealand 1.17 Strength of auditing and accounting standards 1–7 (best) 3.6 43.2 128 Finland 1.18 Conflict of interest regulation 0–10 (best) 4.3 43.0 = 112 Kenya 1.19 Shareholder governance 0–10 (best) 6.7 67.0 = 37 Kazakhstan Future orientation of government 0–100 - 60.8 40 Luxembourg 1.20 Government ensuring policy stability 1–7 (best) 4.0 50.3 67 Switzerland 1.21 Government's responsiveness to change 1–7 (best) 4.0 49.4 53 Singapore 1.22 Legal framework's adaptability to digital business models 1–7 (best) 3.6 43.1 71 United States 1.23 Government long-term vision 1–7 (best) 4.2 52.5 58 Singapore 1.24 Energy efficiency regulation 0–100 (best) 72.0 72.0 26 Italy 1.25 Renewable energy regulation 0–100 (best) 66.7 66.7 35 Germany 1.26 Environment-related treaties in force count (out of 29) 23 79.3 56 Multiple (6) 0–100 - 65.9 77 Singapore 2nd pillar: Infrastructure Transport infrastructure 0–100 - 52.2 66 Singapore 2.01 Road connectivity 0–100 (best) 63.3 63.3 104 Multiple (3) 2.02 Quality of road infrastructure 1–7 (best) 3.4 40.1 103 Singapore 2.03 Railroad density km/1,000 km[[2 7.6 19.1 58 Multiple (24) 2.04 Efficiency of train services 1–7 (best) 3.6 43.3 54 Japan 2.05 Airport connectivity score 364,184.2 86.0 = 22 Multiple (8) 2.06 Efficiency of air transport services 1–7 (best) 4.0 49.7 103 Singapore 2.07 Liner shipping connectivity 0–100 (best) 68.8 68.8 19 Multiple (5) 2.08 Efficiency of seaport services 1–7 (best) 3.8 47.3 83 Singapore Utility infrastructure 0–100 - 79.6 87 Iceland 2.09 Electricity access % of population 98.8 98.8 84 Multiple (67) 2.10 Electricity supply quality % of output 10.2 93.5 62 Multiple (10) 2.11 Exposure to unsafe drinking water % of population 34.3 67.0 95 Multiple (28) 2.12 Reliability of water supply 1–7 (best) 4.6 59.2 81 Iceland
- 3. Viet Nam 67th/141 Index Component Value Score * Rank/141 Best Performer 0–100 - 69.0 41 Korea, Rep. 3rd pillar: ICT adoption 3.01 Mobile-cellular telephone subscriptions per 100 pop. 147.2 100.0 = 14 Multiple (63) 3.02 Mobile-broadband subscriptions per 100 pop. 71.9 N/Appl. 76 United Arab Emirates 3.03 Fixed-broadband Internet subscriptions per 100 pop. 13.6 27.2 63 Switzerland 3.04 Fibre internet subscriptions per 100 pop. 9.9 N/Appl. 26 Korea, Rep. 3.05 Internet users % of adult population 70.3 70.3 66 Qatar 0–100 - 75.0 = 64 Multiple (33) 4th pillar: Macroeconomic stability 4.01 Inflation % 3.5 100.0 = 1 Multiple (88) 4.02 Debt dynamics 0–100 (best) 50.0 50.0 = 64 Multiple (34) 0–100 - 80.5 71 Multiple (4) 5th pillar: Health 5.01 Healthy life expectancy years 65.8 80.5 70 Multiple (4) 0–100 - 57.0 93 Switzerland 6th pillar: Skills Current workforce 0–100 - 48.3 100 Switzerland 6.01 Mean years of schooling years 7.6 50.7 = 97 Germany Skills of current workforce 0–100 - 46.0 103 Switzerland 6.02 Extent of staff training 1–7 (best) 4.0 49.4 73 Switzerland 6.03 Quality of vocational training 1–7 (best) 3.6 44.0 102 Switzerland 6.04 Skillset of graduates 1–7 (best) 3.5 41.2 116 Switzerland 6.05 Digital skills among active population 1–7 (best) 3.8 46.1 97 Finland 6.06 Ease of finding skilled employees 1–7 (best) 4.0 49.3 96 United States Future workforce 0–100 - 65.6 83 Denmark 6.07 School life expectancy years n/a 76.8 n/a Multiple (11) Skills of future workforce 0–100 - 54.4 82 Denmark 6.08 Critical thinking in teaching 1–7 (best) 3.0 32.9 106 Finland 6.09 Pupil-to-teacher ratio in primary education ratio 19.6 75.9 75 Multiple (5) 0–100 - 54.0 79 Hong Kong SAR 7th pillar: Product market Domestic competition 0–100 - 53.7 64 Hong Kong SAR 7.01 Distortive effect of taxes and subsidies on competition 1–7 (best) 3.7 45.3 72 Singapore 7.02 Extent of market dominance 1–7 (best) 4.0 50.3 47 Switzerland 7.03 Competition in services 1–7 (best) 4.9 65.4 72 Hong Kong SAR Trade openness 0–100 - 54.3 91 Singapore 7.04 Prevalence of non-tariff barriers 1–7 (best) 3.9 48.8 121 Singapore 7.05 Trade tariffs % 8.40 44.0 96 Hong Kong SAR 7.06 Complexity of tariffs 1–7 (best) 5.5 75.7 72 Hong Kong SAR 7.07 Border clearance efficiency 1–5 (best) 3.0 48.8 = 42 Germany 0–100 - 58.2 83 Singapore 8th pillar: Labour market Flexibility 0–100 - 56.5 82 Singapore 8.01 Redundancy costs weeks of salary 24.6 57.1 110 Multiple (8) 8.02 Hiring and firing practices 1–7 (best) 4.3 54.6 36 Hong Kong SAR 8.03 Cooperation in labour-employer relations 1–7 (best) 4.3 55.6 82 Singapore 8.04 Flexibility of wage determination 1–7 (best) 4.9 65.3 74 Estonia 8.05 Active labour market policies 1–7 (best) 3.2 36.0 79 Switzerland 8.06 Workers' rights 0-100 (best) 64.0 64.0 93 Multiple (2) 8.07 Ease of hiring foreign labour 1–7 (best) 4.1 52.1 73 Albania 8.08 Internal labour mobility 1–7 (best) 5.0 67.0 22 United States Meritocracy and incentivization 0–100 - 60.0 82 Denmark 8.09 Reliance on professional management 1–7 (best) 3.6 44.1 118 Finland 8.10 Pay and productivity 1–7 (best) 4.2 53.1 56 Hong Kong SAR 8.11 Ratio of wage and salaried female workers to male workers % 0.73 65.9 69 Multiple (4) 8.12 Labour tax rate % 24.5 77.1 105 Multiple (24)
- 4. Viet Nam 67th/141 Index Component Value Score * Rank/141 Best Performer * Scores are on a 0 to 100 scale, where 100 represents the optimal situation or 'frontier'. Arrows indicate the direction of the change in score from the previous edition, if available. Note: For detailed methodology, definitions, sources, and periods, visit http://gcr.weforum.org/ 0–100 - 63.9 60 Hong Kong SAR 9th pillar: Financial system Depth 0–100 - 48.2 52 United States 9.01 Domestic credit to private sector % GDP 122.2 100.0 = 20 Multiple (30) 9.02 Financing of SMEs 1–7 (best) 3.6 43.7 97 Finland 9.03 Venture capital availability 1–7 (best) 3.3 37.8 61 United States 9.04 Market capitalization % GDP 36.9 36.9 54 Multiple (15) 9.05 Insurance premium volume to GDP 1.4 22.8 81 Multiple (17) Stability 0–100 - 83.4 101 Finland 9.06 Soundness of banks 1–7 (best) 4.0 49.3 114 Finland 9.07 Non-performing loans % of gross total loans 1.8 97.3 27 Multiple (3) 9.08 Credit gap % 3.2 96.9 113 Multiple (98) 9.09 Banks’ regulatory capital ratio % of total risk-weighted assets 12.5 90.1 133 Multiple (74) 0–100 - 71.8 26 China 10th pillar: Market size 10.01 Gross domestic product PPP $ billions 631 N/Appl. 34 China 10.02 Imports of goods and services % GDP 108.7 N/Appl. 6 Hong Kong SAR 0–100 - 56.5 89 United States 11th pillar: Business dynamism Administrative requirements 0–100 - 62.6 96 United States 11.01 Cost of starting a business % of GNI per capita 5.9 97.0 66 Multiple (2) 11.02 Time to start a business days 17.0 83.4 96 New Zealand 11.03 Insolvency recovery rate cents to the dollar 21.3 22.9 112 Japan 11.04 Insolvency regulatory framework 0–16 (best) 7.5 46.9 = 98 Multiple (6) Entrepreneurial culture 0–100 - 50.4 68 Israel 11.05 Attitudes towards entrepreneurial risk 1–7 (best) 3.9 48.5 77 Israel 11.06 Willingness to delegate authority 1–7 (best) 4.1 51.5 97 Denmark 11.07 Growth of innovative companies 1–7 (best) 4.1 51.5 68 Israel 11.08 Companies embracing disruptive ideas 1–7 (best) 4.0 50.3 39 Israel 0–100 - 36.8 76 Germany 12th pillar: Innovation capability Interaction and diversity 0–100 - 39.1 79 Singapore 12.01 Diversity of workforce 1–7 (best) 4.4 56.5 75 Singapore 12.02 State of cluster development 1–7 (best) 4.2 52.6 44 Italy 12.03 International co-inventions per million pop. 0.12 3.4 82 Multiple (5) 12.04 Multi-stakeholder collaboration 1–7 (best) 3.6 43.9 80 Israel Research and development 0–100 - 24.9 72 Japan 12.05 Scientific publications score 182.7 77.2 59 Multiple (9) 12.06 Patent applications per million pop. 0.21 3.4 91 Multiple (8) 12.07 R&D expenditures % GDP 0.4 14.7 70 Multiple (7) 12.08 Research institutions prominence 0–100 (best) 0.02 4.2 58 Multiple (7) Commercialization 0–100 - 55.9 69 Luxembourg 12.09 Buyer sophistication 1–7 (best) 3.9 47.8 44 Korea, Rep. 12.10 Trademark applications per million pop. 385.36 64.1 80 Multiple (7)