Powering resources at different growth rates for long term results

The rate of growth and the duration of growth decides on where any individual or organization would be after certain periods . The presentation shows the value achieved vis a vis the static level for periodic growths of 5% ,6% ,7% , 8%, 9% and 10% . These could be used as reference points for deciding on the proportion of resources to be deployed . When all resources grow at same time, the value is taken at 100 . Different resources may grow at different rate and can referenced with the associated graph e.g. 20 % growing at 10% would require referring to the 10% growth graph and 30 % growing at 7% would require the reference at the 7 % graph . These graphs can be looked in relative fashion also wherein a base level could be taken for all related calculations. Google sheets has been used for the data and graph.

Recommended
Recommended
More Related Content
More from Sudhanshu Singh MBA,PMP
More from Sudhanshu Singh MBA,PMP (20)
Recently uploaded
Recently uploaded (20)
Powering resources at different growth rates for long term results
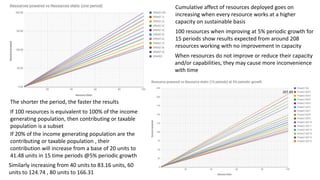
- 1. Cumulative affect of resources deployed goes on increasing when every resource works at a higher capacity on sustainable basis 100 resources when improving at 5% periodic growth for 15 periods show results expected from around 208 resources working with no improvement in capacity The shorter the period, the faster the results If 20% of the income generating population are the contributing or taxable population , their contribution will increase from a base of 20 units to 41.48 units in 15 time periods @5% periodic growth If 100 resources is equivalent to 100% of the income generating population, then contributing or taxable population is a subset Similarly increasing from 40 units to 83.16 units, 60 units to 124.74 , 80 units to 166.31 When resources do not improve or reduce their capacity and/or capabilities, they may cause more inconvenience with time 207.89
- 3. 275.9
- 4. 317.22
- 5. 364.15
- 6. 417.72