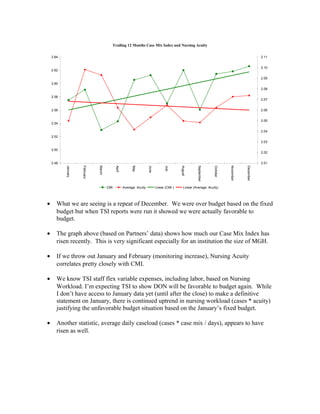
1. Trailing 12 Months Case Mix Index and Nursing Acuity
2.48
2.50
2.52
2.54
2.56
2.58
2.60
2.62
2.64
January
February
March
April
May
June
July
August
September
October
November
December
2.01
2.02
2.03
2.04
2.05
2.06
2.07
2.08
2.09
2.10
2.11
CMI Average Acuity Linear (CMI ) Linear (Average Acuity)
• What we are seeing is a repeat of December. We were over budget based on the fixed
budget but when TSI reports were run it showed we were actually favorable to
budget.
• The graph above (based on Partners’ data) shows how much our Case Mix Index has
risen recently. This is very significant especially for an institution the size of MGH.
• If we throw out January and February (monitoring increase), Nursing Acuity
correlates pretty closely with CMI.
• We know TSI staff flex variable expenses, including labor, based on Nursing
Workload. I’m expecting TSI to show DON will be favorable to budget again. While
I don’t have access to January data yet (until after the close) to make a definitive
statement on January, there is continued uptrend in nursing workload (cases * acuity)
justifying the unfavorable budget situation based on the January’s fixed budget.
• Another statistic, average daily caseload (cases * case mix / days), appears to have
risen as well.