
Recommended
Recommended
More Related Content
What's hot
What's hot (20)
Similar to Highly parallel measurements of interaction kinetic constants with a microfabricated optomechanical device
Similar to Highly parallel measurements of interaction kinetic constants with a microfabricated optomechanical device (20)
Highly parallel measurements of interaction kinetic constants with a microfabricated optomechanical device
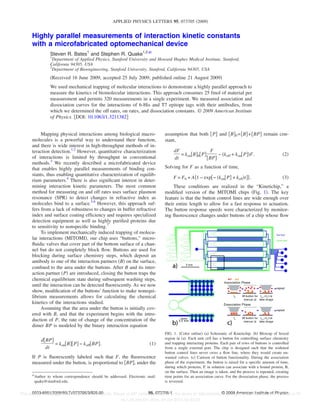
- 1. Highly parallel measurements of interaction kinetic constants with a microfabricated optomechanical device Steven R. Bates1 and Stephen R. Quake1,2,a͒ 1 Department of Applied Physics, Stanford University and Howard Hughes Medical Institute, Stanford, California 94305, USA 2 Department of Bioengineering, Stanford University, Stanford, California 94305, USA ͑Received 16 June 2009; accepted 25 July 2009; published online 21 August 2009͒ We used mechanical trapping of molecular interactions to demonstrate a highly parallel approach to measure the kinetics of biomolecular interactions. This approach consumes 25 fmol of material per measurement and permits 320 measurements in a single experiment. We measured association and dissociation curves for the interactions of 6-His and T7 epitope tags with their antibodies, from which we determined the off rates, on rates, and dissociation constants. © 2009 American Institute of Physics. ͓DOI: 10.1063/1.3211382͔ Mapping physical interactions among biological macro- molecules is a powerful way to understand their function, and there is wide interest in high-throughput methods of in- teraction detection.1,2 However, quantitative characterization of interactions is limited by throughput in conventional methods.3 We recently described a microfabricated device that enables highly parallel measurements of binding con- stants, thus enabling quantitative characterization of equilib- rium parameters.4 There is also significant interest in deter- mining interaction kinetic parameters. The most common method for measuring on and off rates uses surface plasmon resonance ͑SPR͒ to detect changes in refractive index as molecules bind to a surface.5,6 However, this approach suf- fers from a lack of robustness to changes in buffer refractive index and surface coating efficiency and requires specialized detection equipment as well as highly purified proteins due to sensitivity to nonspecific binding.7 To implement mechanically induced trapping of molecu- lar interactions ͑MITOMI͒, our chip uses “buttons,” micro- fluidic valves that cover part of the bottom surface of a chan- nel but do not completely block flow. Buttons are used for blocking during surface chemistry steps, which deposit an antibody to one of the interaction partners ͑B͒ on the surface, confined to the area under the buttons. After B and its inter- action partner ͑P͒ are introduced, closing the button traps the chemical equilibrium state during subsequent washing steps, until the interaction can be detected fluorescently. As we now show, modification of the buttons’ function to make nonequi- librium measurements allows for calculating the chemical kinetics of the interactions studied. Assuming that the area under the button is initially cov- ered with B, and that the experiment begins with the intro- duction of P, the rate of change of the concentration of the dimer BP is modeled by the binary interaction equation d͓BP͔ dt = kon͓B͔͓P͔ − koff͓BP͔. ͑1͒ If P is fluorescently labeled such that F, the fluorescence measured under the button, is proportional to ͓BP͔, under the assumption that both ͓P͔ and ͓B͔0=͓B͔+͓BP͔ remain con- stant, dF dt = kon͓B͔0͓P͔ F ͓BP͔ − ͑koff + kon͓P͔͒F. ͑2͒ Solving for F as a function of time, F = F0 + A͕1 − exp͓− ͑kon͓P͔ + koff͒t͔͖. ͑3͒ These conditions are realized in the “Kinetichip,” a modified version of the MITOMI chips ͑Fig. 1͒. The key feature is that the button control lines are wide enough over their entire length to allow for a fast response to actuation. The button response speeds were characterized by monitor- ing fluorescence changes under buttons of a chip whose flow a͒ Author to whom correspondence should be addressed. Electronic mail: quake@stanford.edu. FIG. 1. ͑Color online͒ ͑a͒ Schematic of Kinetichip. ͑b͒ Blowup of boxed region in ͑a͒. Each unit cell has a button for controlling surface chemistry and trapping interacting proteins. Each pair of rows of buttons is controlled from a single external port. The chip is designed such that the widened button control lines never cross a flow line, where they would create un- wanted valves. ͑c͒ Cartoon of button functionality. During the association phase of the experiment, the button is raised for a specific amount of time, during which proteins, P, in solution can associate with a bound protein, B, on the surface. Then an image is taken, and the process is repeated, creating time points for an association curve. For the dissociation phase, the process is reversed. APPLIED PHYSICS LETTERS 95, 073705 ͑2009͒ 0003-6951/2009/95͑7͒/073705/3/$25.00 © 2009 American Institute of Physics95, 073705-1This article is copyrighted as indicated in the article. Reuse of AIP content is subject to the terms at: http://scitation.aip.org/termsconditions. Downloaded to IP: 18.7.29.240 On: Wed, 29 Jan 2014 02:42:33
- 2. lines were loaded with fluorescein, which was displaced by button closure. The sum of the rise time and fall time for a single cycle of button opening and closing averaged 0.14 s. Therefore, the total opening and closing time is negligible if the button is opened for an interval of more than a few seconds. As a proof of principle, we studied the interactions of penta-His epitope antibody ͑Qiagen 34440͒ with a 6-His epitope tag, and T7 epitope antibody ͑Novagen 69968͒ with its epitope tag ͑MASMTGGQQMG͒. We used eGFP made by an in vitro transcription/translation ͑ITT͒ kit ͑Roche 3335461001͒ with the appropriate tag at the C terminus, and concentration determined by fluorescence. A Kinetichip was prepared with the appropriate antibody playing the role of B immobilized under the button with a biotin-neutravidin inter- action. With buttons closed, unpurified eGFP ITT reaction diluted with phosphate buffered saline ͑PBS͒ was introduced, and the buttons were raised for a predetermined time inter- val. The chip was then imaged using an Arrayworx scanner ͑Applied Precision͒ with 480 nm excitation filter, 530 nm emission filter, or a TECAN LS Reloaded scanner with 488 nm excitation laser, 535 nm emission filter. During the scan, fresh eGFP was introduced to maintain a constant ͓P͔. The process was repeated to generate time points for an associa- tion curve ͓Figs. 1͑c͒ and 2͔. Then, with the spot under each button loaded with eGFP, the eGFP solution was washed out with PBS. To generate time points for a dissociation curve, the buttons were raised, an image was taken with PBS flow- ing during the scan to wash out dissociated eGFP and main- tain ͓P͔=0, and the process was repeated. The images were analyzed with GenePixPro 3.0, finding the median fluorescence signal in a selected area in each spot for each time point. The association time points were fit to Eq. ͑3͒ using SigmaPlot 10.0 or OriginPro 7.5. For the dis- sociation phase, with ͓P͔=0, Eq. ͑2͒ reduces to a simple exponential decay. With koff determined by fitting to the dis- sociation curves, and ͓P͔ known, kon and Kd=koff/kon are calculated from the association fits. In all experiments, during both the association and dis- sociation phases, one of the button valves remained closed. This provided a control to demonstrate that P is excluded from binding while the button remains closed ͑during asso- ciation͒, and that decay in signal from photobleaching and escape of protein from under the closed button is negligible ͑during dissociation͒. Signal from these control spots was flat during both phases ͑Fig. 2͒. To validate results, the kinetic constants were also mea- sured by SPR ͑Biacore͒ with HBS-EP ͑0.01M HEPES, pH 7.4, 0.15M NaCl, 3 mM EDTA͒ as running buffer, and the ITT-expressed eGFP dialyzed into the running buffer ͑Table I͒. The dialysis was necessary to eliminate nonspecific inter- actions, which caused a bulk resonance shift that dominated the specific interaction signals in an experiment with unpu- rified ITT reaction. We suspected that differences between the Biacore and Kinetichip results could be due to differ- FIG. 2. ͑Color online͒ Sample data from T7 epitope tag experiments. These data are from four different spots during a single experiment. With multiple independently controlled buttons, the time resolution can be tuned to best capture the exponential decay, as in the association phase of the experiment ͑left panel͒. The horizontal axis represents the cumulative time the button is raised, except for the control data points, which are arbitrarily plotted on the same time axis as for Sample 1, to demonstrate the lack of change in signal. The dissociation curves in the right panel are from the same spots as the association curves. TABLE I. Summary of results and comparison to Biacore results. Kinetichip on rates and dissociation constants were calculated spot by spot and then averaged. Biacore kinetic constants were calculated by a global fit to a concentration series of association and dissociation curves, with dissociation constants determined simply by dividing off rate by on rate. This method did not generate standard deviations, but analysis of the curve-by-curve variation when fitting to the curves individually suggests standard deviations on the order of 10−4 s−1 , 104 M−1 s−1 , and 5 nM for the His results, and 2ϫ10−3 s−1 , 5ϫ104 M−1 s−1 , and 30 nM for the T7 results. koffϮSD ͑s−1 ͒ konϮSD ͑M−1 s−1 ͒ Kd ϮSD ͑nM͒ n His Kinetichip 3.3ϫ10−4 Ϯ2.8ϫ10−5 4.4ϫ104 Ϯ6.5ϫ103 7.5Ϯ0.73 240 His Biacore 3.0ϫ10−4 9.8ϫ104 3.1 T7 Kinetichip 1.9ϫ10−3 Ϯ6.6ϫ10−4 4.4ϫ104 Ϯ1.0ϫ104 45Ϯ14 492 T7 Biacore 8.1ϫ10−3 1.1ϫ105 72 T7 Kinetichip ͑HBS-EP buffer͒ 5.7ϫ10−3 Ϯ8.5ϫ10−4 4.3ϫ104 Ϯ8.6ϫ103 130Ϯ33 120 073705-2 S. R. Bates and S. R. Quake Appl. Phys. Lett. 95, 073705 ͑2009͒ This article is copyrighted as indicated in the article. Reuse of AIP content is subject to the terms at: http://scitation.aip.org/termsconditions. Downloaded to IP: 18.7.29.240 On: Wed, 29 Jan 2014 02:42:33
- 3. ences in buffer conditions, which can significantly affect the on and off rates.8 To test this, a Kinetichip experiment was run on the T7 interaction, with the eGFP diluted in HBS-EP buffer, and with the same buffer used as the wash buffer when continuing from the association to the dissociation phase. Although the on-rate was not substantially affected, this change moved the off rate much closer to agreement, suggesting that the buffer conditions were an important, al- though not the sole, factor. Although not explored in as much depth as with the 6-His and T7 epitope interactions, the interaction between the c-Myc epitope tag ͑EQKLISEEDL͒ and its antibody ͑Sigma B7554͒ was also characterized by Kinetichip, yield- ing koff=2.7ϫ10−3 Ϯ2.5ϫ10−4 s−1 , kon=1.4ϫ104 Ϯ2.9 ϫ103 M−1 s−1 , and Kd=195Ϯ49 nM. The Kinetichip has several advantages over SPR meth- ods, including the ability to use unpurified protein. The Bia- core experiment consumed about 200 l of 4 M protein for a single measurement, while a typical Kinetichip experi- ment used 20 l of 0.4 M protein to perform 320 mea- surements, representing four orders of magnitude reduction in the amount of protein per experiment. Another advantage is that the images were taken with microarray scanners in- stead of a device dedicated specifically to SPR detection, though with recent development of microfluidic SPR devices,9 a hybrid approach incorporating buttons may also be useful. Additionally, the Kinetichip is compatible with MITOMI protein-protein interaction platforms in which the proteins are expressed in situ during the experiment.10 Each unit cell of the chip has a DNA chamber connected by a neck to the interaction chamber ͓Fig. 1͑b͔͒. DNA templates can be arrayed on a microarray slide, and the chip aligned over them and annealed so that each DNA chamber contains a unique template for an on-chip ITT reaction. In this way, an array of proteins bound under the buttons can be created for kinetic interrogation by a protein introduced from off chip. A Kineti- chip of the size used here can measure the interaction kinet- ics of one protein against as many as 320 partners. The com- bination of high throughput, low amount of material used, and ability to accommodate unpurified protein makes this method an attractive tool for proteomics. The authors would like to thank Michael Eckart for as- sistance with Biacore experiments, the Stanford Microfluid- ics Foundry for chip fabrication, and Sebastian Maerkl, Doron Gerber and Thomas Snyder for valuable discussions. This work was supported by the NSF NanoCEMMS center ͑2007-06015-03͒ and the NIH Director’s Pioneer award ͑0D000251͒. 1 M. Arifuzzaman, M. Maeda, A. Itoh, K. Nishikata, C. Takita, R. Saito, T. Ara, K. Nakahigashi, H. C. Huang, A. Hirai, K. Tsuzuki, S. Nakamura, M. Altaf-Ul-Amin, T. Oshima, T. Baba, N. Yamamoto, T. Kawamura, T. Ioka- Nakamichi, M. Kitagawa, M. Tomita, S. Kanaya, C. Wada, and H. Mori, Genome Res. 16, 686 ͑2006͒. 2 J. R. Parrish, K. D. Gulyas, and R. L. Finley, Jr., Curr. Opin. Biotechnol. 17, 387 ͑2006͒. 3 R. B. Jones, A. Gordus, J. A. Krall, and G. MacBeath, Nature ͑London͒ 439, 168 ͑2006͒. 4 S. J. Maerkl and S. R. Quake, Science 315, 233 ͑2007͒. 5 T. A. Morton and D. G. Myszka, Methods Enzymol. 295, 268 ͑1998͒. 6 C. T. Campbell and G. Kim, Biomaterials 28, 2380 ͑2007͒. 7 R. Karlsson, J. Mol. Recognit. 17, 151 ͑2004͒. 8 K. Andersson, D. Areskoug, and E. Hardenborg, J. Mol. Recognit. 12, 310 ͑1999͒. 9 Y. Luo, F. Yu, and R. N. Zare, Lab Chip 8, 694 ͑2008͒. 10 D. Gerber, S. J. Maerkl, and S. R. Quake, Nat. Methods 6, 71 ͑2009͒. 073705-3 S. R. Bates and S. R. Quake Appl. Phys. Lett. 95, 073705 ͑2009͒ This article is copyrighted as indicated in the article. Reuse of AIP content is subject to the terms at: http://scitation.aip.org/termsconditions. Downloaded to IP: 18.7.29.240 On: Wed, 29 Jan 2014 02:42:33