
Recommended
Recommended
More Related Content
Similar to Financial Modeling, Terminal Value and Financial Ratios analysis- Willowglen MSC Berhad (Linkedin)
Similar to Financial Modeling, Terminal Value and Financial Ratios analysis- Willowglen MSC Berhad (Linkedin) (20)
Financial Modeling, Terminal Value and Financial Ratios analysis- Willowglen MSC Berhad (Linkedin)
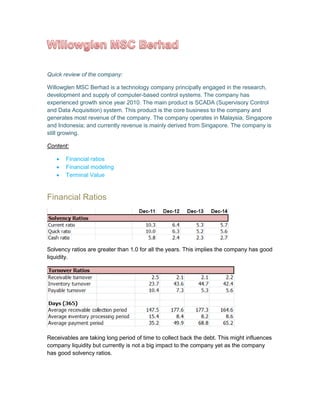
- 1. Quick review of the company: Willowglen MSC Berhad is a technology company principally engaged in the research, development and supply of computer-based control systems. The company has experienced growth since year 2010. The main product is SCADA (Supervisory Control and Data Acquisition) system. This product is the core business to the company and generates most revenue of the company. The company operates in Malaysia, Singapore and Indonesia; and currently revenue is mainly derived from Singapore. The company is still growing. Content: Financial ratios Financial modeling Terminal Value Financial Ratios Solvency ratios are greater than 1.0 for all the years. This implies the company has good liquidity. Receivables are taking long period of time to collect back the debt. This might influences company liquidity but currently is not a big impact to the company yet as the company has good solvency ratios.
- 2. The company has high inventory ratio implies that it has lower risk of obsolete stock or ineffective in purchasing that requires to meet the demand. This requires further investigation. Payable ratio is falling from period to period but slightly increases on year 2014. This indicates company taking longer time to pay off the creditor. It might because the company is getting tight in cash due to heavy investment in capital expenditure as refers to cash flows statement. ROE of the company is within the range of (14% to 22%), it is necessary to compare to industry average to see whether the ratio is moving within the reasonable range. Financial Modeling In this financial modeling demonstration, I am using a simple method for quick review purpose. The latest annual report available in the company official website is financial year ended 31 December 2014. Project the Income Statement A) Revenue Projections
- 3. Revenue assumptions are based on sale growth approach and awarded projects which will contribute to relevant future years. On 2 March 2015, Willowglen has announced they are awarded RM9.9 million contract from Singapore which will contribute to the group’s earnings for the financial year 2015 to 2017. Therefore, the RM9.9 million is spread across these 3 years. The source shows as below:
- 4. Source: TheStarOnline http://www.thestar.com.my/business/business-news/2015/03/02/willowglen-msc-bhd- gets-rm9mil-job/ On 8 December 2015, Willowglen has announced they are awarded a Singapore project worth RM6.938 million which will contribute to income of the financial year 2016 and 2017. The amount will be spread across these 2 years. Source: TheStarOnline http://www.thestar.com.my/business/business-news/2015/12/08/willowglen-to-take- part-in-singapore-transmission-tunnel-project/ B) Cost Projection Cost projection is using the simplest method which is based on percentage of revenue for demonstration purpose. Depreciation and amortization expenses will be presented in different schedule. The forecast percentage of the cost is falls within the range of historical data. E.g. the range of administrative expenses is from 14% to 24% for past 4 years. Thus 21% is
- 5. used for forecast the future administrative expenses where the percentage is increasing from past 4 years and assume it may remain over 20% for next 4 years. Tax will be computed using effective tax rate. Working Capital Schedule The items of working capital are forecasted based on ratio and assumption as below: After the changes of cash flows in individual items are in line with changes in cash flows of working capital, the amount will be link to cash flows statement. Depreciation and Capex Schedule A) Capex
- 6. Willowglen has announced that they plan to expand their business globally on 30 April 2015 (source: http://www.thesundaily.my/news/1400224) but the they did not provide further information thus Capex is just calculated based on percentage of net sales. The breakdown of projected capex is based on asset weight of year 2014, assuming the asset weight is remain constant for next 4 years. Thus, the projected individual PPE is ready for computing the depreciation. B) Depreciation The depreciation rate adopted from annual report as below: The depreciation rate is either using middle of the range or; the closest of upper or lower rate within the range. E.g. the depreciation rate of renovation is using 10% for calculating its depreciation due to its depreciation rate for year 2014 is close to 10% (166/1,770=9.3%).
- 8. Amortization Schedule Assuming no additional intangible asset in next 4 years, the amortization amount is remains no change. Shareholders’ equity Assuming Willowglen will not repurchase shares or issue new share and dividend payout is remain the same as 2014, the shareholders’ equity is computed as below: Other assets and other liabilities Deferred tax asset, accrued tax liability, tax recoverable and other non-current liabilities are remain the same.
- 9. Complete the Income Statement, Balance Sheet and Cash flows Statement
- 11. Terminal Value Free cash flow is computed starting with EBIT: EBIT x (1-tax rate) + Non-Cash Charges + Changes in Working capital – Capital Expenditure. Due to basically presentation of the calculation, the WACC is using the discount rate given in the annual report which is 8%. Growth rate is estimated at 7% and perpetuity growth method is used for computing the free cash flows after year 2018 onward. The result shows that the company has intrinsic value of RM1.48. It is a buy sign where investor should hold the shares or buy more.