Sinusoidal Model Development for the Study of Diurnal Variation of Surface Ai...
FrederickSymposiumPoster
1. Results & Observations
References
D’Arrigo, R., Wilson, R., Wiles, G., Anchukaitis, K. J., Solomina, O., Davi, N.,
Deser, C., Matskovsky, V., Dolgova, E., in review, Distinct circulation features
of western North Pacific climate over four centuries: Journal of Climate.
Wiles, G.C., Solomina, O., D’Arrigo, R., Anchukaitis, K.J., Gensiarovsky, Y.V., and
Wiesenberg, N., 2014, Reconstructed summer temperatures over the last 400
years based on Larix gmelinii ring widths: Sakhalin Island, Russian Far East:
Climate Dynamics.
Solomina, O., Wiles, G., Shiraiwa, T., D’Arrigo, R., 2007, Multiproxy records of
climate variability for Kamchatka for the past 400 years: Climate of the Past, v.
3, p. 119-128.
Stokes, M.A., and Smiley, T.L., 1996, An introduction to tree-ring dating: Tucson,
Arizona, The University of Arizona Press, 73 p.
Field Sites
The Far East of Russia.
Collection sites (yellow)
are each labeled with the
site code.
Some controls on oceanic
(blue) and atmospheric
(black) circulation are
also shown.
These combined with a
variety of other factors,
including Amur River
input, form a complex
climate system.
The Utility of Tree-Rings
Tree-rings are valuable for paleoclimatology:
• Annual growth rings allow for absolute dating.
• Growth is influenced by the local climate conditions.
• A tree’s unique pattern of growth rings may be used as high-
resolution proxy data to reconstruct past fluxes in climate
variable(s) that the tree’s growth is sensitive to.
Acknowledgments
Support for this research was provided by the National
Science Foundation Paleoclimatology Program, Grants
AGS-1159430 and 1202218. We thank Nick Wiesenberg,
Javi Martin Fernandez, and College of Wooster students,
Zach Downes, Willy Nelson, and Kaitlin Starr, for their
assistance in processing data used in this study.
The above figure illustrates crossdating, the
technique of matching rings between trees.
500 km
North Pacific
Bering Sea
Sea of Okhotsk
Sea of Japan
144E
52N
Kamchatka
Sakhalin
Island
Vladivostok
Yuhzno-
Sakhalinsk
Petropavlovsk
Esso
Hokkaido
Kuril Islands
Alaskan Current
East Kamchatka
Current
East-Sakhalin
Current
East Asia Monsoon
(summer)
Siberian High
(winter)
50
74 70
80
106
GD
CV
NRA,B,C,D
SV
BD
TBT, LTB, MTB
162
KH
CR
VK, UVK, LVK
ES
WP, MWP
KG
PK
VV
UG
PP
MK
BP
URKED
UP
KP
SR
GK
SN
SG
K01
K02
K03
K04
K05
K06
K09
K10
K11
MV
SP
MONOG/SON
RN
CHAM
NAM
Significance
Reconstructions of Amur River
discharge beyond the existing
observational record provides another
dimension from which to understand
past conditions of the river basin and
Sea of Okhotsk system.
Such reconstructions may allow for
better river planning and management
practices as warming climate brings an
increased risk of drought and flooding
to the region.
The Amur River
• One of the largest rivers of the world with a basin area of ~1,8600,000 km2.
• Discharges into the Sea of Okhotsk, and is a large control on both the formation of
seasonal sea ice and biological productivity in the Northwest Pacific.
• Two discharge peaks:
1. May: reflects spring snow melt
2. Autumn: result of monsoonal rains
FREDERICK, Sarah1, WILES, Greg1, SOLOMINA, Olga2, D’ARRIGO, Rosanne3, ANCHUKAITIS, Kevin3, DOLGOVA, Ekaterina4, MATSKOVSKY, Vladimir4, KUDERINA, Tatiana5, GRABENKO, Evgenii6, and DAVI, Nicole7
1) Department of Geology, The College of Wooster, 2) Institute of Geography, Moscow State University, Russian Academy of Sciences, 3) Lamont Doherty Earth Observatory, Columbia University, 4) Department of Geography, Moscow State University,
5) Department of Physical Geography and Natural Management Problems, Moscow State University, 6) Kavkazskii State Biosphere Reserve, Kavkazskii, 7) Environmental Science, William Paterson University
Methods
1. Living larch, spruce, oak, and pine
trees were cored across the Far East.
2. These cores were prepared using
standard dendrochronological
methodologies, dated and measured
(Stokes and Smiley, 1996).
3. COFECHA and ARSTAN were used to
develop chronologies that were then
compared to meteorological data and
statistically analyzed for climate
signals.
Images from fieldwork in
Kamchatka, Russia.
Figure 1
Figure 2
Figure 3
….Figure 4
Dendroclimatology in the Far East of Russia:
Two-century tree-ring reconstructions of Amur River flow
Conclusions
1. Growth of these trees tends to be
highly sensitive to summer
temperatures and precipitation.
2. Growth exhibits a strong
correlation with the observational
record of Amur River discharge.
3. Tree ring-width functions as a
strong proxy for discharge of the
Amur River, particularly for
autumn and winter months, and
can be used to produce statistically
significant reconstructions of Amur
River flow beyond the existing
observational record.
4. Amur River discharge is highly
variable through time, however,
some flux may be explained by
changes in just a few variables.
Declines in flow correlate with
cooler periods in the temperature
reconstruction (Figure 3) and, less
consistently, with decreased solar
irradiance (Figure 4).
Objectives
1. Develop tree-ring chronologies, which provide an extensive
record of climate, particularly temperature, precipitation,
and larger-scale indices, in the Far East.
2. Reconstruct Amur River discharge beyond the observational
record using dendroclimatology and dendrohydrology.
3. Better understand the climatic role of the Amur River as a
driver and/or responder to regional conditions.
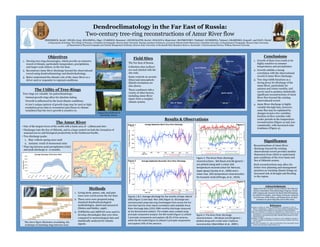
Figures
1
&
2.
Average
discharge
for
the
months
of
Sept.-‐March
(SM)
(Figure
1)
and
Sept.-‐Nov.
(SN)
(Figure
2).
Discharge
was
reconstructed
using
tree-‐ring
chronologies
from
across
the
Far
East
that
had
the
most
robust
correlaDon
with
available
Amur
River
discharge
data
(1933-‐1984
monthly
discharge
measured
at
the
Komsomolsk
staDon).
The
models
were
created
using
principle
component
analysis:
the
SM
model
(Figure
1)
uDlized
3
principle
components
and
explains
38.2%
of
the
variance,
while
the
SN
model
(Figure
2)
uDlized
2
principle
components
and
explains
43%
of
the
variance.
Figure
3.
The
Amur
River
discharge
reconstrucDons
-‐
SM
(blue)
and
SN
(green)
–
are
ploTed
along
with
a
mean
JJAS
temperature
reconstrucDon
for
Nemuro,
Japan
(gray)
(Jacoby
et
al.,
2004)
and
a
mean
max.
JJAS
temperature
reconstrucDon
for
Kunashir
(red)
(D’Arrigo,
et
al.,
2014).
Figure
4.
The
Amur
River
discharge
reconstrucDons
–
SM
(blue)
and
SN
(green)
–
ploTed
along
with
a
total
solar
irradiance
reconstrucDon
(Steinhilber
et
al.,
2009
).
• Time lag between peak precipitation (July)
and peak discharge is ~2 months.