1. UNICEF, WHO, The World Bank. Levels and trends in child malnutrition: Key findings of the 2020 Edition of the Joint Child Malnutrition Estimates – UNICEF | for every child
2. UNICEF, WHO, The World Bank. Levels and trends in child malnutrition: Key findings of the 2020 Edition of the Joint Child Malnutrition Estimates – UNICEF | for every child
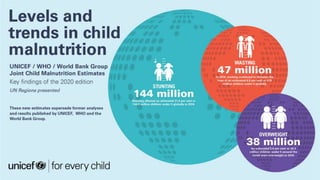
GLOBAL OVERVIEW
Prevalence and Numbers affected
Source: UNICEF, WHO, World Bank Group Joint Child Malnutrition Estimates, 2020 edition.
See Notes on the Data section on why only one time point is presented for wasting on the graphs
above.
Number (millions) of stunted, wasted and
overweight children under 5, global, 2000–2019
Percentage of stunted, wasted and
overweight children under 5, global, 2000–
2019
Malnutrition rates
remain alarming:
stunting is
declining too
slowly while
wasting still
impacts the lives
of far too many
young children
3. UNICEF, WHO, The World Bank. Levels and trends in child malnutrition: Key findings of the 2020 Edition of the Joint Child Malnutrition Estimates – UNICEF | for every child
In 2019, more than half of
all stunted children under
5 lived in Asia and two out
of five lived in Africa.
.
In 2019, more than two thirds
of all wasted children under 5
lived in Asia and more than
one quarter lived in Africa.
In 2019, almost half of all
overweight children under
5 lived in Asia and one
quarter lived in Africa.
GLOBAL OVERVIEW
Africa and Asia bear the greatest share of all forms of
malnutrition
4. UNICEF, WHO, The World Bank. Levels and trends in child malnutrition: Key findings of the 2020 Edition of the Joint Child Malnutrition Estimates – UNICEF | for every child
GLOBAL OVERVIEW
Income Classification
Percentage of stunted, overweight and wasted children under 5, by country income classification, 2000 – 2019
Source: UNICEF, WHO, World Bank Group Joint Child Malnutrition Estimates, 2020 edition. Note: *High-income countries: low (<50 per cent) population coverage in all time
periods for overweight and wasting, and consecutive low population coverage in 2000 for stunting; interpret with caution.
5. UNICEF, WHO, The World Bank. Levels and trends in child malnutrition: Key findings of the 2020 Edition of the Joint Child Malnutrition Estimates – UNICEF | for every child
Stunting refers to a child
who is too short for his or
her age. These children can
suffer severe irreversible
physical and cognitive
damage that accompanies
stunted growth. The
devastating effects of
stunting can last a lifetime
and even affect the next
generation.
6. UNICEF, WHO, The World Bank. Levels and trends in child malnutrition: Key findings of the 2020 Edition of the Joint Child Malnutrition Estimates – UNICEF | for every child
Percentage of stunted children under
5, by UN sub-region
UNICEF, WHO, World Bank Group joint
malnutrition estimates, 2020 edition.
Note: *Eastern Asia excluding Japan;
**Oceania excluding Australia and New
Zealand; ***Northern America sub-
regional estimate based on United
States data. There is no estimate
available for the sub-regions of Europe
or Australia and New Zealand due to
insufficient population coverage.
These maps are stylized and not to
scale and do not reflect a position by
UNICEF, WHO or World Bank Group on
the legal status of any country or
territory or the delimitation of any
frontiers.
STUNTING
Prevalence, UN sub-regions, 2019
7. UNICEF, WHO, The World Bank. Levels and trends in child malnutrition: Key findings of the 2020 Edition of the Joint Child Malnutrition Estimates – UNICEF | for every child
Trends in the percentage of stunted
children under 5, by UNICEF region, 2000
and 2019
Source: UNICEF, WHO, World Bank Group
joint malnutrition estimates, 2020 edition.
Note: *Asia and Eastern Asia excluding
Japan; **Oceania excluding Australia and
New Zealand; ***Northern America sub-
regional estimates based on United States
data. There is no estimate available for the
More Developed Region or for sub-regions of
Europe or Australia and New Zealand due to
insufficient population coverage.
?represents regions/sub-regions where the
change has been statistically significant; see
page 12 for the 95% confidence intervals for
graphed estimates.
STUNTING
Trends: Prevalence, 2000 & 2019, by UN sub-region
8. UNICEF, WHO, The World Bank. Levels and trends in child malnutrition: Key findings of the 2020 Edition of the Joint Child Malnutrition Estimates – UNICEF | for every child
Number (millions) of stunted
children under 5, by UN sub-region,
2019
Source: UNICEF, WHO, World Bank
Group joint malnutrition estimates,
2020 edition. Note: *Eastern Asia
excluding Japan; **Oceania excluding
Australia and New Zealand; ***The
Northern America sub-regional
estimate based on United States
data. There is no estimate available
for the More Developed Region or for
sub-regions of Europe or Australia and
New Zealand due to insufficient
population coverage. Aggregates may
not add up due to rounding and/or
lack of estimates for the More
Developed Region.
STUNTING
Numbers affected, by UN sub-region, 2019
9. UNICEF, WHO, The World Bank. Levels and trends in child malnutrition: Key findings of the 2020 Edition of the Joint Child Malnutrition Estimates – UNICEF | for every child
Trends in the number of stunted children
under 5, by United Nations region/sub-
region, 2000 and 2019
Source: UNICEF, WHO, World Bank
Group Joint Child Malnutrition Estimates,
2019 edition. Note: *Asia and Eastern
Asia excluding Japan. **Oceania
excluding Australia and New Zealand.
***Northern America sub-regional
average based on United States data
only. There is no estimate available for
the More Developed Region or for sub-
regions of Europe or Australia and New
Zealand. †represents regions/sub-regions
where the change has been statistically
significant; see page 13 for the 95%
confidence intervals for graphed
estimates.
STUNTING
Numbers affected, by UN sub-region, 2000 & 2019
10. UNICEF, WHO, The World Bank. Levels and trends in child malnutrition: Key findings of the 2020 Edition of the Joint Child Malnutrition Estimates – UNICEF | for every child
While only about
half of all children
under 5 live in
lower-middle
incomes,
two-thirds of all
stunted children
and three-quarters
of all wasted
children live there
*Share is relative to the total number affected across the 4 country-income groups; this varies from the global totals reported elsewhere in this
brochure because the official JME global total is based on a model of United Nations regions. The differences are as follows: Stunting official
global estimate 144.0 million; sum of 4 country-income groups = 145.8 million. Wasting official global estimate 47.0 million; sum of country-
income groups = 45.3 million. Overweight official global estimate 38.3 million; sum of 4 country-income groups = 39.1 million).
COUNTRY INCOME CLASSIFICATION
Share by region
11. UNICEF, WHO, The World Bank. Levels and trends in child malnutrition: Key findings of the 2020 Edition of the Joint Child Malnutrition Estimates – UNICEF | for every child
Number (millions) of children under 5
who are stunted, by World Bank Income
Classification, 2000 and 2019
Source: UNICEF, WHO, World Bank Group
joint malnutrition estimates, 2020
edition. Note: *High-income countries:
consecutive low (<50 per cent) population
coverage in 2000 and 2019 for overweight
and in 2000 for stunting; interpret with
caution. Based on FY2020 World Bank
income classification. The values for
“percentage change since 2000” are
based on calculations using unrounded
estimates and therefore might not match
values calculated using the rounded
estimates presented in this brochure.
STUNTING: COUNTRY INCOME CLASSIFICATION
Trends, Numbers affected, 2000 and 2019, World
Bank
12. UNICEF, WHO, The World Bank. Levels and trends in child malnutrition: Key findings of the 2020 Edition of the Joint Child Malnutrition Estimates – UNICEF | for every child
Wasting refers to a child who
is too thin for his or her height.
Wasting is the result of recent
rapid weight loss or the failure
to gain weight. A child who is
moderately or severely wasted
has an increased risk of death,
but treatment is possible.
13. UNICEF, WHO, The World Bank. Levels and trends in child malnutrition: Key findings of the 2020 Edition of the Joint Child Malnutrition Estimates – UNICEF | for every child
Percentage of wasted children under 5,
by UN sub-region
Source: UNICEF, WHO, World Bank Group
joint malnutrition estimates, 2020
edition. Note: *Eastern Asia excluding
Japan; **Oceania excluding Australia and
New Zealand; ***Northern America sub-
regional estimate based on United States
data. There is no estimate available for
the sub-regions of Europe or Australia and
New Zealand due to insufficient
population coverage. These maps are
stylized and not to scale and do not
reflect a position by UNICEF, WHO or
World Bank Group on the legal status of
any country or territory or the
delimitation of any frontiers. The legend
contains a category for ≥15 per cent
(pink) but there is no sub-region with a
prevalence this high.
WASTING
Prevalence, UN sub-regions, 2019
14. UNICEF, WHO, The World Bank. Levels and trends in child malnutrition: Key findings of the 2020 Edition of the Joint Child Malnutrition Estimates – UNICEF | for every child
Number (millions) of wasted children
under 5, by UN sub-region
Source: UNICEF, WHO, World Bank Group
joint malnutrition estimates, 2020 edition.
Note: *Eastern Asia excluding Japan;
**Oceania excluding Australia and New
Zealand; ***The Northern America sub-
regional estimate based on United States
data. There is no estimate available for the
More Developed Region or for sub-regions of
Europe or Australia and New Zealand due to
insufficient population coverage.
Aggregates may not add up due to rounding
and/or lack of estimates for the More
Developed Region.
WASTING
Numbers affected, by UN sub-region, 2019
15. UNICEF, WHO, The World Bank. Levels and trends in child malnutrition: Key findings of the 2020 Edition of the Joint Child Malnutrition Estimates – UNICEF | for every child
Percentage of wasted children
under 5, by UN region
Source: UNICEF, WHO, World Bank
Group joint malnutrition estimates,
2020 edition. Includes 95% confidence
interval. Note: *Asia excluding Japan;
**Oceania excluding Australia and
New Zealand. There is no estimate
available for the More Developed
Region due to insufficient population
coverage.
WASTING
Prevalence, UN sub-regions, 2019
16. UNICEF, WHO, The World Bank. Levels and trends in child malnutrition: Key findings of the 2020 Edition of the Joint Child Malnutrition Estimates – UNICEF | for every child
Number (millions) of wasted and
severely wasted children under 5, by
UN region
Source: UNICEF, WHO, World Bank
Group joint malnutrition estimates,
2020 edition. Note: *Asia excluding
Japan; **Oceania excluding Australia
and New Zealand. There is no estimate
available for the More Developed
Region due to insufficient population
coverage. Aggregates may not add up
due to rounding and/or lack of
estimates for the More Developed
Region.
WASTING
Numbers affected, wasted and severely wasted, by UN
region, 2019
17. UNICEF, WHO, The World Bank. Levels and trends in child malnutrition: Key findings of the 2020 Edition of the Joint Child Malnutrition Estimates – UNICEF | for every child
While only about
half of all children
under 5 live in
lower-middle
incomes,
three-quarters of
all wasted children
live there
*Share is relative to the total number affected across the 4 country-income groups; this varies from the global totals reported elsewhere in
this brochure because the official JME global total is based on a model of United Nations regions. The differences are as follows: Stunting
official global estimate 144.0 million; sum of 4 country-income groups = 145.8 million. Wasting official global estimate 47.0 million; sum of
country-income groups = 45.3 million. Overweight official global estimate 38.3 million; sum of 4 country-income groups = 39.1 million).
COUNTRY INCOME CLASSIFICATION
Share by region
18. UNICEF, WHO, The World Bank. Levels and trends in child malnutrition: Key findings of the 2020 Edition of the Joint Child Malnutrition Estimates – UNICEF | for every child
Overweight refers to a child
who is too heavy for his or her
height. This form of malnutrition
results from energy intakes from
food and beverages that exceed
children’s energy requirements.
Overweight increases the risk of
diet-related non-communicable
diseases later in life.
19. UNICEF, WHO, The World Bank. Levels and trends in child malnutrition: Key findings of the 2020 Edition of the Joint Child Malnutrition Estimates – UNICEF | for every child
Percentage of overweight children
under 5, by UN sub-region
Source: UNICEF, WHO, World Bank
Group joint malnutrition estimates,
2020 edition. Note: *Eastern Asia
excluding Japan; **Oceania excluding
Australia and New Zealand, ***The
Australia and New Zealand sub-
regional estimate is based only on
Australia data. There is no estimate
available for the sub-region of Europe
due to insufficient population
coverage. These maps are stylized and
not to scale and do not reflect a
position by UNICEF, WHO or World
Bank Group on the legal status of any
country or territory or the delimitation
of any frontiers.
OVERWEIGHT
Prevalence, UN sub-regions, 2019
20. UNICEF, WHO, The World Bank. Levels and trends in child malnutrition: Key findings of the 2020 Edition of the Joint Child Malnutrition Estimates – UNICEF | for every child
Trends in the percentage of overweight
children under 5, by United Nations
region/sub-region, 2000 and 2019
Source: UNICEF, WHO, World Bank Group
joint malnutrition estimates, 2020
edition. Note:*Asia and Eastern Asia
excluding Japan; **Oceania excluding
Australia and New Zealand. ***The
Australia and New Zealand sub-regional
estimates are based only on Australia
data. There is no estimate available for
the More Developed Region or for the
sub-region of Europe due to insufficient
population coverage. ?represents sub-
regions where the change has been
statistically significant; see page 12 for
the 95% confidence intervals for graphed
estimates.
STUNTING
Trends: Prevalence, 2000 & 2019, by UN sub-region
21. UNICEF, WHO, The World Bank. Levels and trends in child malnutrition: Key findings of the 2020 Edition of the Joint Child Malnutrition Estimates – UNICEF | for every child
Number (millions) of overweight
children under 5, by UN sub-region
Source: UNICEF, WHO, World Bank
Group joint malnutrition estimates,
2020 edition. Note:*Eastern Asia
excluding Japan; **Oceania excluding
Australia and New Zealand. ***The
Australia and New Zealand sub-
regional estimate is based only on
Australia data. There is no estimate
available for the More Developed
Region or for the sub-region of Europe
due to insufficient population
coverage. Aggregates may not add up
due to rounding and/or lack of
estimates for the More Developed
Region.
OVERWEIGHT
Numbers affected, by UN sub-region, 2019
22. UNICEF, WHO, The World Bank. Levels and trends in child malnutrition: Key findings of the 2020 Edition of the Joint Child Malnutrition Estimates – UNICEF | for every child
Trends in the number of overweight
children under 5, by United Nations
region/sub-region, 2000 – 2019
Source: UNICEF, WHO, World Bank Group
joint malnutrition estimates, 2020 edition.
Note: *Asia and Eastern Asia excluding
Japan; **Oceania excluding Australia and
New Zealand. ***The Australia and New
Zealand sub-regional estimates are based
only on Australia data. There is no estimate
available for the More Developed Region or
for the sub-region of Europe due to
insufficient population coverage.
?represents sub-regions where the change
has been statistically significant; see page
13 for the 95% confidence intervals for
graphed estimates.
OVERWEIGHT
Numbers affected, by UN sub-region, 2000 & 2019
23. UNICEF, WHO, The World Bank. Levels and trends in child malnutrition: Key findings of the 2020 Edition of the Joint Child Malnutrition Estimates – UNICEF | for every child
Middle income
countries account
for over three
quarters of all
overweight
children
*Share is relative to the total number affected across the 4 country-income groups; this varies from the global totals reported elsewhere in this
brochure because the official JME global total is based on a model of United Nations regions. The differences are as follows: Stunting official
global estimate 144.0 million; sum of 4 country-income groups = 145.8 million. Wasting official global estimate 47.0 million; sum of country-
income groups = 45.3 million. Overweight official global estimate 38.3 million; sum of 4 country-income groups = 39.1 million).
COUNTRY INCOME CLASSIFICATION
Share by region
24. UNICEF, WHO, The World Bank. Levels and trends in child malnutrition: Key findings of the 2020 Edition of the Joint Child Malnutrition Estimates – UNICEF | for every child
Number (millions) of children under 5
who are overweight, by World Bank
Income Classification, 2000 and 2019
Source: UNICEF, WHO, World Bank Group
joint malnutrition estimates, 2020 edition.
Note: *High-income countries: consecutive
low (<50 per cent) population coverage in
2000 and 2019 for overweight and in 2000
for stunting; interpret with caution. Based
on FY2020 World Bank income
classification. The values for “percentage
change since 2000” are based on
calculations using unrounded estimates
and therefore might not match values
calculated using the rounded estimates
presented in this brochure.
OVERWEIGHT: COUNTRY INCOME CLASSIFICATION
Trends, Numbers affected, 2000 and 2019, World
Bank
25. UNICEF, WHO, The World Bank. Levels and trends in child malnutrition: Key findings of the 2020 Edition of the Joint Child Malnutrition Estimates – UNICEF | for every child
NOTES ON THE DATA
AND METHODOLOGY
26. Prevalence estimates for stunting and overweight are relatively
stable over the course of a calendar year. It is therefore possible
to track global and regional changes in these two conditions
over time. Wasting and severe wasting are acute conditions that
can change frequently and rapidly over the course of a calendar
year. This makes it difficult to generate reliable trends over
time with the input data available, and as such, this report
provides only most recent global and regional estimates.
The joint global and regional estimates that make up the
UNICEF/ WHO/World Bank Group Joint Child Malnutrition
Estimates have been generated using a country-level dataset
which is mainly comprised of estimates from nationally
representative household surveys. These data are collected
infrequently (every 3 to 5 years in most countries) and measure
malnutrition at one point in time (e.g. during one or several
months of field work), making it difficult to capture the rapid
fluctuations in wasting that can occur over the course of a given
year. Incidence data (i.e. the number of new cases that occur
during the calendar year) would allow for better tracking of
changes over time; however, these data currently do not exist.
Strengths and weaknesses of malnutrition data
27. The analysis methods and presentation have remained unchanged from the 2012 report1, except for minor
refinements detailed below:
1 United Nations Children’s Fund, World Health Organization, The World Bank. UNICEF-WHO-World Bank Joint Child
Malnutrition Estimates. (UNICEF, New York; WHO, Geneva; The World Bank, Washington, DC; 2012).
1. Year assigned to each
survey
When data collection begins in
one calendar year and
continues into the next, the
survey year assigned is the one
in which most of the fieldwork
took place. For example, if a
survey was conducted between
1 September 2009 and 28
February 2010, the year 2009
would be assigned, since the
majority of data collection took
place in that year (i.e., four
months in 2009 versus two
months in 2010). This method
has been used since the 2013
edition (prior to that, the latter
year was used by default – e.g.,
2010 in the example above).
2. Final reports only
As of the 2014 edition, the
country-level dataset used
to generate the global and
regional joint malnutrition
estimates is based only on
final survey results.
Preliminary survey results
are no longer included in
the
dataset since the data are
sometimes retracted or
change significantly
when the final version is
released.
3. Updated data sources
i. The updated joint dataset includes:
• 854 nationally representative surveys;
• data from 152 countries and
territories, representing more than 90
per cent of all children under 5 globally
(population coverage varies by regions
and periods). The majority of data
available are from low- and middle-
income countries – more efforts are
needed to generate data from high-
income countries.
ii. The under 5 population estimates
were based on The United Nations
World Population Prospects, 2017
Revision. These were used as weighting
factors for each country survey to
derive the regional and global
prevalence estimates and calculate the
numbers affected.
iii. Regional and country income
classifications were based on FY19
World Bank income classification.
4. Footnotes on population
coverage
As started in the 2014 edition, a
separate exercise was
conducted to assess population
coverage. This was important in
order to alert the reader, via
footnotes, to instances where
the data should be interpreted
with caution due to low
population coverage (defined as
less than 50 per cent). A
conservative method was
applied looking at available data
within mutually exclusive five-
year periods around the
projected years.
28. 5. Prevalence thresholds for wasting, overweight
and
stunting in children under 5 years
New thresholds, presented in the table on the right,
right, were established through the WHO-UNICEF
Technical Advisory Group on Nutrition Monitoring
(TEAM)2 and have been used for development of
prevalence-based maps in this brochure. The
thresholds were developed in relation to standard
deviations (SD) of the normative WHO Child Growth
Growth Standards. The international definition of
‘normal’ (two SD from the WHO standards median)
median) defines the first threshold, which includes
includes 2.3% of the area under the normalized
distribution. Multipliers of this “very low” level
(rounded to 2.5%) set the basis to establish
subsequent thresholds.
The analysis methods and presentation have remained unchanged from the 2012 report1, except for minor
refinements detailed below:
1 United Nations Children’s Fund, World Health Organization, The World Bank. UNICEF-WHO-World Bank Joint Child Malnutrition Estimates. (UNICEF, New
York; WHO, Geneva; The World Bank, Washington, DC; 2012).
2 de Onis, M., et al. (2018). Prevalence thresholds for wasting, overweight and stunting in children under 5 years. Public health nutrition, 22(1), 175–179.
Labels
Prevalence thresholds (%)
Stunting Overweight
and Wasting
Very Low <2.5 <2.5
Low 2.5 – < 10 2.5 – < 5
Medium 10 – < 20 5 – < 10
High 20 – < 30 10 – < 15
Very high ≥ 30 ≥ 15
29. UNICEF, WHO, The World Bank. Levels and trends in child malnutrition: Key findings of the 2020 Edition of the Joint Child Malnutrition Estimates – UNICEF | for every child
ONLINE
MATERIALS
30. UNICEF, WHO, The World Bank. Levels and trends in child malnutrition: Key findings of the 2020 Edition of the Joint Child Malnutrition Estimates – UNICEF | for every child
ONLINE MATERIALS
Key Findings Report
This key findings report of the 2020 Edition of the Joint Child
Malnutrition Estimates summarizes the new regional and
global numbers and main messages for official United
Nations data on child malnutrition.
Available at: https://data.unicef.org/resources/jme-report-
2020/
31. UNICEF, WHO, The World Bank. Levels and trends in child malnutrition: Key findings of the 2020 Edition of the Joint Child Malnutrition Estimates – UNICEF | for every child
There are joint malnutrition
global and regional
estimates database by
various regional groupings
(e.g. United Nations,
UNICEF, WHO, etc., regional
groupings) and for more
years than presented in the
report.
There are also expanded databases (national and
disaggregated) for the following indicators:
• Stunting
• Wasting
• Severe Wasting
• Overweight
• Overlapping Malnutrition
Available at:
https://data.unicef.org/resources/dataset/malnutrition-
data/
ONLINE MATERIALS
Databases
32. UNICEF, WHO, The World Bank. Levels and trends in child malnutrition: Key findings of the 2020 Edition of the Joint Child Malnutrition Estimates – UNICEF | for every child
Interactive dashboards, which allow users to visualize
and
export the global and regional estimates for a
number of
regional groupings.
Available at: https://data.unicef.org/resources/joint-
child-malnutrition-estimates-interactive-dashboard/
ONLINE MATERIALS
Interactive Dashboards
33. Prepared by:
Data and Analytics Section
Division of Data, Analytics, Planning & Monitoring
UNICEF Headquarters
3 UN Plaza, New York, NY, 10017
data.unicef.org
For more information contact:
data@unicef.org