Stanley's Growth Strategy and Financial Performance
1. Page 1 of 18
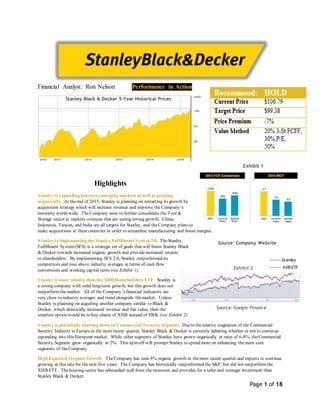
Financial Analyst: Ron Nelson Performance in Action
Highlights
Stanley is expanding into newemerging markets as well as growing
organically. At theend of 2015, Stanley is planning on restarting its growth by
acquisition strategy which will increase revenue and improve the Company’s
notoriety world-wide. TheCompany aims to further consolidate the Tool &
Storage sector in markets overseas that are seeing strong growth. China,
Indonesia, Taiwan, and India are all targets for Stanley, and theCompany plans to
make acquisitions in thesecountries in order to streamline manufacturing and boost margins.
Stanley is implementing the Stanley Fulfillment System 2.0. TheStanley
Fulfillment System (SFS) is a strategic set of goals that will boost Stanley Black
& Decker towards increased organic growth and provideincreased returns
to shareholders. By implementing SFS 2.0, Stanley outperformed its
competitors and rose above industry averages in terms of cash flow
conversions and working capital turns (see Exhibit 1).
Stanley is more volatile than the XHB Homebuilders ETF. Stanley is
a strong company with solid long-term growth, but this growth does not
outperformthe market. All of the Company’s financial indicators are
very close to industry averages and trend alongside themarket. Unless
Stanley is planning on acquiring another company similar to Black &
Decker, which drastically increased revenue and fair value, then the
smartest option would be to buy shares of XHB instead of SWK (see Exhibit 2).
Stanley is potentially shutting down its Commercial Security Segment. Dueto therelative stagnation of the Commercial
Security Industry in Europe in the most recent quarter, Stanley Black & Decker is currently debating whether or not to continue
expanding into this European market. While other segments of Stanley have grown organically at rates of 6-8%, theCommercial
Security Segment grew organically at 2%. This spin-off will prompt Stanley to spend more on enhancing themore core
segments of theCompany.
High Expected OrganicGrowth. TheCompany has seen 8% organic growth in themost recent quarter and expects to continue
growing at this rate for the next five years. The Company has historically outperformed the S&P, but did not outperformthe
XHB ETF. Thehousing sector has rebounded well from the recession and provides for a safer and stronger investment than
Stanley Black & Decker.
Exhibit 1
Source: Company Website
Stanley Black & Decker 5-Year Historical Prices
Exhibit 2
Source: Google Finance
Stanley
XHB ETF
2. Page 2 of 18
Investment Summary
Stanley’s acquisition of Jiangsu Guoqiang Tools Co (GQ) is expected to increase brand strength in emerging Asian
markets. China, Taiwan, The Philippines, and Japan are expanding dramatically and growing in the Infrastructureand CDIY
markets. Many Asian cities are erecting buildings at higher than normal rates and require a Company that provides professional
tools for professional jobs. Stanley Black & Decker’s CDIY sells 72% of its Tools & Storage to professional customers, and a
strong presence in China’s growing market will be beneficial for Stanley’s brand image.
Stanley is improving its EngineeredFastening Segment to capitalize on changing trends
in the industry. The automotive industry and other industrial industries are moving away
from the use of steel in manufacturing and moving more towards light-weight materials such
as carbon-fiber and compositematerials. Fasteners are required for these types of material
and Stanley is working towards innovative fastening solutions that will boost the Company into
the forefront of this growing trend. Stanley’s Fastener Technologies segment had 7% organic
growth and $700 million revenue growth in 2014.
Commercial Security may be spun off if industry does not increase to above average growth
and above average margins. The majority of Stanley’s European Commercial Security portfolio
segment was bought one year after the merge with Black & Decker. During this time, the
Commercial Security Industry was booming and provided a strong return for theCompany. For
the last two years, however, that business segment has dropped dramatically to below the
Company’s desired average growth rate. Although Stanley is #2 in the world for Commercial
Security, it only captures roughly 2% of market share due to theindustry’s fragmented nature. It
is incredibly competitiveand does not allow Stanley to achieve thestrong brand name recognition
that is so essential to the company in other segments of theCompany. The majority of Stanley’s
Security business is located in Europe, and theCompany will decide whether or not to sell this
segment of its portfolio in roughly a year or more (see Exhibit 3).
Stanley plans to resume a strong growth-by-acquisition strategy laterthis year. Stanley’s long standing strategy has been
growth by acquisition. TheCompany took a short break from this strategy to focus more on organic growth and
consolidation/optimization of existing business sectors. With theexception of the Commercial Security segment, Stanley has
completed many of its goals in business segment optimization. It has consolidated the CDIY and Automotive segments, it has
reduced wasteand increased margins in the fastening solutions segment, and is poised to take advantage of changing
technological trends in the hospitalservices segment, due to its acquisition of Aeroscout.
Business Description
Stanley Black & Decker is a world leader in producing tools and storage, commercial electronic security, and engineered
fastening systems. Additionally, thecompany constructs oil pipelines, provides innovative healthcare solutions, and assists
communities by providing services for building infrastructure.
History
The Stanley Works company was started in 1843 by Fredrick Stanley who sold bolts, hinges, and other wrought iron hardware to
the local population in his hometown of New Britain, Connecticut. Duncan Black and Alonzo Decker started Black & Decker in
1910 in Baltimore, and thetwo companies grew alongside each other for the next 100 years. In 2010, Stanley bought Black &
Decker for $4.5 billion, which was considered a beneficial merger for both parties. Stanley had a diversified portfolio of
industrial subsidiaries that sold hand held tools and construction equipment whereas Black & Decker sold mostly power tools.
The two companies complimented each other very well and created roughly $350 million in cost synergies. The acquisition of
Black & Decker was thelargest merger Stanley had ever experienced, but this is only one of numerous acquisitions that the
company has completed.
Exhibit 3
Comm. Security Revenue by Region
Source: Company Website
3. Page 3 of 18
Strategy
Stanley Black & Decker has long applied a growth-by-acquisition strategy. Stanley Black & Decker has
acquired numerous trademark companies in local markets, and several in foreign markets. This strategy
has yielded roughly $6.2 billion of acquisitions since 2002, not including theBlack & Decker
acquisition. TheCompany’s short-termgoal is focused on organic growth through vertical market
strategies. Due to theconsolidation and optimization of business processes, theCompany has
enjoyed a high organic growth in recent years and expects this growth to continue in the near
future. TheCompany does not expect this robust growth to continue in perpetuity. Thelong-term
goal is to increase presence in European countries, and emerging markets such as India and China,
where construction tools and many of Stanley Black & Decker’s other products will be in high
demand.
Stanley Fulfillment System
The Stanley Fulfillment System(SFS) is a unique operational improvement process that applies
many aspects of Kaizen and Lean Manufacturing to all of Stanley’s business processes. Quality
in manufacturing, maximizing customer fill rates, and effectively assimilating all acquired
companies are major parts of the business plan. The SFS is integrated, to different degrees depending on cohesion, into every
business that Stanley Black & Decker acquires. By doing this, all interconnected business operations are streamlined and made
as efficient as possibleto create a strongly competitive functional system. This strategy has been at the heart of Stanley for
roughly ten years and theCompany plans to improve on it every coming year. In thecoming year,
the Company is aiming to institute“SFS 2.0”. It will focus on core SFS, but will incorporate
strategies to improve commercial excellence, breakthrough innovation, digital excellence, and functional transformation (see
Exhibit 4).
Operations
There are approximately 50,400 employees that work for Stanley Black & Decker, of which about 13,131 are employed in the
United States. The Company has offices in 20 states and 16 foreign countries. It has 79 facilities that are larger than 100,000 sq.
ft. The Company imports a large portion of its finished goods, works in progress, and raw materials. A danger associated with
this is risk of tariffs or quotas enacted by the exporting nation. Stanley plans to continue its overseas operations and to have those
operations represent a substantial portion of the Company’s revenues. Stanley faces many uncontrollable risks by having such a
large portion of its business in other countries such as political relations, governmental controls, exposure to wage and price
controls, currency risk, and many others.
Products & Services
Stanley Black & Decker offers a wide variety of products and services that span many aspects of themarket place. Once a small
company in Connecticut, Stanley Black & Decker is the world-wide leader and manufacturer of tools and storage, and is a leader
in other industries including commercial security, hospitalservices, fastening solutions, infrastructure, and pipelineservices (see
Exhibit 5).
Tools & Storage
Stanley Black & Decker is the world-wide leader
and manufacturer of hand tools, power tools, and
storage solutions. Stanley’s tools are sold across
the globe for personal and professional use.
Stanley’s merger with Black & Decker in 2010
boosted the company’s value to $8.4 billion.
Black & Decker was thelargest acquisition the
company has ever experienced, but other companies such as
DeWalt, Bostitch, Vidmar, and many others have expanded Stanley’s business palette. DeWalt is Stanley’s largest producer of
hand tools and power tools. DeWalt has come out with a number of new products that have increased power and increased run-
time. Roughly 72% of Stanley’s sales in this industry go to professionals. Vidmar is the company’s largest producer of storage
solutions and provides storage equipment to themilitary, automotive, healthcare industry, aerospace, agricultural, and
educational industries. In 1958, Stanley created Stanley Vidmar, a subsidiary company that focused exclusively on innovative
storage products for various industries.
Exhibit 4
SFS 2.0 Strategy
Diagram
Source: Company Website
Exhibit 5:
Company Segments
Source: Company Website
4. Page 4 of 18
Commercial Security
Stanley has a number of subsidiaries that are leaders in their own market. Sargent & Greenleaf is the world leader in medium and
high security locks and locking systems for safes and vaults. The company offers thelargest selection of various kinds of locks
for personal and professional use. Stanley just recently acquired Niscayah for $1.2 billion by outbidding AB Securitas, an
industry competitor who bid $910 million for the company. Niscayah has boosted Stanley’s presence in surveillance and fire
alarm markets in Europedramatically. Additionally, Stanley bought ADT France in 2010 in accordance with thecompany’s
desire to expand into Europe’s security industry, as outlined in theannual report. Much of Stanley’s operations in the European
Commercial Security markets in theyears leading up to 2010 created the opportunity to buy out Black & Decker in 2010. The
2008 recession hurt Black & Decker more than Stanley due to its lack of diversity. Now that thehousing sector has rebounded to
normal levels, the Commercial Security Industry in Europe has idled and may present problems for Stanley in thefuture. The
Company is currently having discussions about whether or not to continue expansion in Europe. Stanley’s Management expects
to know the futureof this industry within 12-18 months.
HospitalServices
Stanley owns a number of healthcare related companies that are present in hospitals throughout thenation. Stanley acquired
Innerspace in 2007 which is a company that provides storage solutions to hospitals nationwide. Hugs Infant Protection is an
innovative Stanley Healthcare company that provides infant protection services to 1.5 million infants every year in 1,300
hospitals worldwide. It is the #1 infant protection service on themarket and protects infants from theft, misplacement, and
mishandling. Aeroscout is a market leader in RTLS (real-time location services) and RFID (radio-frequency identification)
Fasteners
Stanley Black & Decker has a strong presence in thefasteners and rivets industry. Stanley owns ten subsidiary companies
involved in the industry, thelargest one being Emhart Teknologies. Emhart’s main goal is innovation. It fills out orders for
existing customers, but much of thebudget is spent toward finding new methods and styles of fastening products and assemblies
together. This clientele ranges from mobile telecommunication companies to industrial construction companies with a strong
focus on automotive and aerospace fastening.
Infrastructure
Stanley is well-known for helping improve local communities by participatingin thedemolition and installation of infrastructure.
Stanley develops state-of-the-art concrete breakers, both hand-held and machine operated. LaBounty Mobile Demolition
Processors is Stanley’s largest subsidiary and helps the company get demolition contracts from cities, municipalities, and other
privateand governmental entities. LaBounty is a market leader in hydraulic attachments that are used to serve contractors, scrap
metal recyclers, and demolition crews. Dubuis is another of Stanley’s infrastructuresubsidiaries, headquartered in France. The
company focuses on precision mechanics and hydraulic tools used in the electricity industry.
Pipeline Services
Stanley has been involved with the oil and gas industry for over 80 years, is working in over 100 countries, and is providing
services and products to pipelines that extract oil from every ocean on the planet. CRC-Evans is a subsidiary of Stanley and has a
strong presence in every aspect of oil pipelineconstruction. Thecompany owns 129 patents and exhibits strong innovation with
its automatic welding machines and pipebending machines.
Management
John F Lundgren (Chairman and CEO): Lundgren has been Chairman and CEO of Stanley since 2004. He is 62 years old
and his annual compensation is $13.14 million. He began his management career at theGillette Corporation and has held
numerous management positions both at home and internationally. Since he joined Stanley, revenues and market cap have more
than quadrupled. He attended Dartmouth in New Hampshire and received his MBA from Stanford University in California. He
is on the BOD for Callaway Golf Company, and sits on a number of executive committees, some of which are the National
Association of Manufacturers, G100, and the Dartmouth Athletics Advisory Board. John Lundgren is an amiable character and is
a great representative for thecompany. He is positiveabout the Company and gives investors something to get excited about.
James M. Loree (President and COO): Loree has been President of Stanley since 2013 and COO since 2007. He is 56 years
old and his annual compensation is $9.75 million. He began working for theCompany in 2002 as the Executive Vice President
of Finance until he was promoted in 2009 into his current position. In Stanley, he specializes in investor relations, supplier
management. He worked at General Electric for 19 years as thecompany’s CFO. He received his BA in Economics from Union
5. Page 5 of 18
College and graduated Summa Cum Laude. Loree specializes in strategic planning for mergers and acquisitions and has been a
vital asset to the Company due to his help with numerous acquisitions since he signed on with Stanley.
DonaldAllan Jr. (CFO and SeniorVP): Allan has been CFO of Stanley since 2009 and Senior VP since 2010. He is 50 years
old and his annual compensation is $6.4 million. He began working for Stanley in 1999 as Director of Financial Reporting and
specialized in corporatefinancial planning and internal control policies. He has experience in thetool manufacturing industry;
prior to his employment at Stanley, he was a financial manager at Loctite Corporation. He received his bachelor’s degree in
accounting from the University of Hartford. Stanley hired him due to his extensive knowledge of thetool industry and since he
was promoted to CFO in 2009, theCompany has been remarkably profitable.
Jeffery D. Ansell (SeniorVP& Global Executive of Tools & Storage): Ansellhas been Senior VP of Stanley since 2010 and
has managed to Tools & Storage division since 2004. He is 46 years old and his annual compensation is $6.38 million. One of
his major contributions to theCompany was his advancement of a Strategic Business Unit-based culture that has improved
innovation throughout numerous facets of the business. He began working for Stanley in 1999 as VP of Consumer Sales in the
Americas. Prior to working for Stanley, he was Director of Sales and Marketing of the GenlyteCorporation, a company that
manufactured lighting fixtures and controls. He received his BA from Saint Vincent College and graduated Summa Cum Laude.
The Saint Vincent College of Business is in thetop 10% of most highly credited colleges and Ansell graduated with honors. This
shows determination and wit that works well with Stanley’s other key management.
Demographic Trends
Stanley Black & Decker has numerous subsidiaries in multiple facets of the marketplace. Thecompany is poised to take
advantage of current trends in business and has the ability to adapt or reduce parts of its business in areas where demographic
trends would be detrimental to business. The company’s numerous subsidiaries can be tailored to fit the needs of today’s
marketplace.
The Population is Getting Older
Much of Stanley Black & Decker’s business relies upon the Construction and Do-It-Yourself (CDIY) portion of the Company,
which generates roughly 50% of the Company’s revenues. TheCDIY industry consists mostly of young to middle-aged men.
The industry thrives off of young men because it inherently needs workers who are physically able to carry out laborious tasks.
The rise in the mean age of theUS population may have an adverse effect on theworkforce.
Most of theother industry segments that Stanley Black & Decker participates in would be negatively impacted by an aging
population. With the exception of thehealthcare and fastening technology segments, the Company relies heavily on a young and
able work force.
The Country is Becoming More Diverse
The construction industry employs apredominantly white workforce. Although Stanley is an equal-opportunity employer, the
majority of companies that SWK sells to lack ethnic diversity. Thechanging racial demographics of the United States could have
either negative or positiveeffects on the Company’s revenues.
Labor unions and construction workers have been pushing to increase the minimum wage to $15 which would provide good
opportunities for low income minority households. This could create a new and untapped poolof workers that could strengthen
the CDIY industry and thus strengthen Stanley’s revenues.
Adversely, the rapid change in racial demographics could cause the CDIY industry to weaken if the industry is unable to attract
the new and rising demographic. If the CDIY industry is weakened, then Stanley’s revenues will be adversely affected.
Trends in Construction
Single-Design Models are becoming more the norm in theconstruction market. Contractors are being pushed towards having a
systemwhere everything is built in-house by one company. Stanley Black & Decker offers many services that comply with this
growing trend. Thecompany offers on-site training for all its equipment and streamlines different aspects of the construction
process due to themany subsidiary companies that it has acquired under one name and general management system.
Energy efficiency is another growing trend in construction. Energy Recovery Technology is expanding and many companies are
applyingthis technique to building. Thermal Wheels are a new technology that are used in the industrial process to recapture
heat and exhaust from construction equipment. It has yet to become a standard in business practice, but it would be a worthy
investment for Stanley Black & Decker to research.
6. Page 6 of 18
Recently, in September 2013, Stanley Black & Decker achieved a position in the CPD (Carbon Disclosure Project) S&P 500
Climate Performance Leadership Index (CPLI). This annual index recognizes companies that exhibit strategies that are geared
toward reducing carbon footprints and improving the environment through sustainable business processes. Theever growing
trend of environmental sustainability has caused businesses to adopt cleaner methods of manufacturing, and Stanley Black &
Decker is poised to lead in this category. The Company’s efforts to reduce environmental impacts have resulted in measurable
improvements in the manufacturing process. Reduction of wastein thebusiness cycle and reduction of the amount of water used
in production have improved Stanley’s profit margins by lowering expenses.
Trends in Clean andRenewable Energy
It’s involvement in the construction of oil pipelines has provided a healthy revenue stream over the last decade. Theemerging
clean energy trend may impact that business over the coming years due to rising disapprovalof burning fossil fuels. Theworld
will most likely always need oil to some extent, and Stanley will most likely keep the oil pipelineconstruction segment of the
company for some time. Stanley Black & Decker has researched into clean energy extensively in its fasteners and rivets industry.
The company’s lead subsidiary in this division, Emhart Teknologies, is working on innovations that will move them towards
more renewable energy processes.
Trends in Physical Storage
Physical storage may see a decline in the coming years due to business processes becoming more electronic. In 2008, only 38%
of office based physicians in hospitals had switched to keeping e-records. By 2013, that percentage rose to 78% and continues to
rise. Stanley’s production of healthcare-related storage is a hefty part of their healthcare division. The movement toward “digital
tools” is another advancement that would reduce the need for physicalstorage. Healthcare providers have replaced many
physicaltools with universal tools that can operateon different settings to complete multiple tasks.
Trends in Healthcare Technologies
The Healthcare industry has seen dramatic innovations in medicine, but it has lagged behind in technological innovations. Many
hospitals are using instruments that have been around for many years and although they work to fix health problems, they are not
effective enough to prevent health problems. This industry has long been considered a very reactive market rather than a
proactive market. There have been recent technologic advances that may impact the Healthcare industry that companies such as
Stanley Black & Decker could take advantage of.
Automated equipment and robotics are expected to have more of a presence in hospitals in thecoming years. Theserobots could
be capable of anything from automated surgery to distribution and organization of medical materials.
3-D printing is an expanding trend that will greatly impact various industries in thecoming years. Hospitals are expected to 3-D
print tools, organs, and other simple and complex medical products. A company such as Stanley could acquire an up and coming
3-D printing firm that would poise Stanley to take advantage of this growing trend.
Tele Health is another trend in Healthcare Technology. Hospitalvisits for mundane check-ups are expected to reduce in the
coming years. Doctor visits through telecommunication with interactive interfaces will become more common and will reduce
hospitals costs and reduce flow of patients in order to make more room for priority patients.
Industry Overview and Competition
Stanley Black & Decker is involved six main industries: (1) Construction and do-it-yourself (CDIY) and storage, (2) fasteners,
(3) commercial security, (4) healthcare, (5) infrastructure solutions, and (6) oil pipeline services. The barriers to entry for all of
these industries are very high. A new firm that joins any of theseindustries would require a large amount of initial capital in
order to competewith existing firms. All of these industries require heavy machinery and advanced equipment in order to mass
produce thevarious parts and products. An essential part of Stanley’s strategic framework is that the Company is selective about
the markets into which it enters. Stanley only operates in markets where their brand is meaningful and where thevalue of
business is clearly defined and sustainable through the implication of Stanley’s business process.
CDIY and Storage
Stanley is the world-leader in tools and storage; the power tools industry forecast is strong and steady. Theindustry overall is
expected to growth at 4.8% per year through 2018. Growth will be more robust in emerging markets such as India, China, and
Taiwan. Although growth will be more robust, so will industry competition. Stanley’s most fervent competition come from
Chinese companies whose labor prices and dedicated work forces create low-cost, highly efficient competitors. Sales in the US
are projected to increase due to theeconomic recovery from the recession. US housing and construction markets will require
7. Page 7 of 18
tools to facilitate expansion. In 2013, the US was the world’s largest consumer of power tools and theworld’s second largest
producer. Most power tool sales are to professional construction rather than to personal consumption. Some strong competitors
include:
(as of 5/7/15) Trades On Ticker Sales Share Price Mkt Cap EPS P/E TTM
Techtronic Ind. HKEx TTNDY 4,753 17.31 N/A 0.82 21.24
Snap-On Inc NYSE SNA 3,492 153.85 8,970 7.39 20.82
Makita Corp OTC MKTAY 3,593 51.6 7,578 2.72 18.94
Caterpillar Inc NYSE CAT 55,184 86.43 52,180 6.25 13.84
Fastening Solutions
Stanley is second in theworld in fastening solutions and has strong competition from a number of different companies. Last
year, Stanley had revenues of $1.5 billion from fastening operations. The company has a strong foothold in emerging markets
and plans to continue integration with emerging markets around the world. Over a three-year period, Stanley has had a 20%
CAGR in revenues. Some strong competitors include:
(as of 5/7/15) Trades On Ticker Sales Share
Price
Mkt Cap EPS P/E TTM
Anixter International NYSE AXE 6,446 70.5 2,320 5.84 12.07
Nifco OTC NIFCY 185,167 38.22 2,050 1.88 20.37
Piolax Inc. Tokyo SE 5988 457 43.84 6,480 0.23 10.6
TRW NYSE TRW 17,539 105.34 12,110 2.54 41.44
Commercial Security
The commercial security industry is a highly competitivemarket. There are many large corporations in the industry that make
competition very strong. For the past several years, theUnited States has led this industry in both production and consumption.
The industry is mainly driven by growth in the housing and construction markets. Additionally, it is driven by continued high-
perceived risk of crime. The US is notorious for having a higher than average perceived risk of crime, even though crime rates
have fallen in recent years. While housing markets are on the rise, they will eventually normalize and thecommercial security
industry may stagnate. That being said, technological innovations are dramatically changing theindustry. Moresystems are
integrating the security systems with hand-held devices. Consumers can now access their security networks on tablets and
phones, giving them streamlined access to thesystemand readily available knowledge that their properties are safe. In 2011,
Stanley acquired Niscayah, one of the largest global security firms in Europe, for $1.2 billion. This increased the Company’s
global market share. Therisk of stagnation and the potentialfor growth in domestic and foreign markets make for unclear future
growth rates. Theacquisition of Niscayah will most likely proveto be beneficial for Stanley’s growth in the industry. Some
strong competitors include:
(as of 5/7/15) Trades On Ticker Sales Share Price Mkt Cap EPS P/E TTM
Bosch N/A N/A 55,039 N/A N/A N/A N/A
ADT Corp NYSE ADT 3,408 37.12 6,350 1.68 22.06
Makita Corp OTC MKTAY 3,593 51.6 7,578 2.72 18.94
Danaher NYSE DHR 19,913 83.19 58,820 3.61 23.02
Healthcare
The Global Healthcare IT market was valued at $36.15 billion in 2012. The industry is expected to grow at a steady compound
growth rate of around 14% through 2020. Hospitals around the world are moving towards more electronic technology that
streamlines operations. Stanley Healthcare recently acquired AeroScout in 2012 which brought Stanley to the forefront of the
RTLS and RFID technology market. Thesetechnologies are monumental in streamlining hospitaloperations and allow for staff
8. Page 8 of 18
and patients to be monitored effectively. Although AeroScout has launched Stanley into a favorable position in this specific
market, the Company still faces strong competition from rival firms. Some strong competitors include:
(as of 5/7/15) Trades On Ticker Sales Share
Price
Mkt Cap EPS P/E TTM
ZimmerHoldings NYSE ZMH 4,673 111.04 18,880 4.29 26.5
Steris Corp NYSE STE 1,622 67.27 4,010 2.21 30.44
Danaher NYSE DHR 19,913 83.19 58,820 3.61 23.02
United Tech. Corp NYSE UTX 65,100 116.04 10,5420 6.82 16.38
Infrastructure Solutions
The infrastructureindustry has very high barriers to entry. A large amount of capital is required to enter into this industry.
Infrastructureis growing throughout the United States at different rates. Certain cities are undergoing more expansion than
others. However, there are projected to be a sufficient amount of building and rebuilding required in the US to keep the domestic
industry strongand competitive. Emerging markets require infrastructuresolutions at a much higher level. In countries such as
China, India, and Taiwan, infrastructureconstruction is booming and shows no sign of subsiding in the near future. The 2008
stimulus package in China is a major opportunity for companies involved in the industry. India’s infrastructure growth dropped
to 4.8% in 2013 due to years of underinvestment and the country is struggling to handle all its trade operations. Some strong
competitors include:
(as of 5/7/15) Trades On Ticker Sales Share Price Mkt Cap EPS P/E TTM
Cummins Inc NYSE CMI 19,221 139.91 25,370 9.02 15.51
MYR Group NasdaqGS MYRG 944 29.3 609 1.69 17.34
AECOM NYSE ACM 8,357 31.6 4,910 0.64 49.76
Chicago Bridge & Iron Co NYSE CBI 12,975 49.55 5,380 5.37 9.23
Oil PipelineServices
In the most recent decade, the Oil Pipeline industry has seen a large upswing in regulatory restrictions due to recent high-profile
oil spills resulting from faulty pipelines. Theglobal demand for oil pipelines is expected to grow at roughly 5% through 2017.
This modest growth is a sign that more and more countries are moving away from burning fossil fuels and are moving closer to
sustainable energy. CRC-Evans, Stanley’s only subsidiary in the industry, focuses primarily on oil pipeline construction,
inspection, and maintenance. With the industry in a period of expected stagnation, it might prove beneficial to reduce resources
allocated to this industry. Some strong competitors include:
(as of 5/7/15) Trades On Ticker Sales Share Price Mkt Cap EPS P/E TTM
Darby Equipment Co N/A N/A N/A N/A N/A N/A N/A
Cypress Energy Ptnrs NYSE CELP 404 16.03 190 -1.72 N/A
Valuation
Stanley Black & Decker is very closely correlated with theXHB Housing Market ETF. Stock prices fell as low as $26.76 in
February 2009, but recovered alongside the housing market index and have reached highs of $104.05. I calculated a target price
of $91.10 which is a weighted average of three different valuation models: 30% 3-Stage FCFE, 30% P/E, and 40% Constant
Dividend Model. The price target for the stock is roughly $11 below thecurrent price which indicates that this is not a good
stock to buy. I chose this weighting because Stanley is planning to start up again with its acquisition strategy at theend of 2015.
This increase in spending on acquisitions will boost equity values at an assumed rate of roughly 3.8% per year in perpetuity. I
used the P/E multiple because it reflects a very close representation of the actual market price. I used the Constant Dividend
9. Page 9 of 18
Modelbecause the Company has a very strong history of dividend payments and I assume these payments to continue (see
Appendix 7 for further description of time periods and growth rates).
I chose a risk-free rate of 4.5% which is standard for the industries Stanley is a part of and I calculated a return on themarket of
8.7 which gives me an MRP of 4.2% which in turn gives me a Ke of 8.49%. Stanley Black & Decker has a beta of .95 according
to Morningstar, but Value Line calculated a beta of 1.1. I used thebeta of .95 because I see theCompany as being less volatile
than themarket due to its largely diversified business strategy. Using a beta of 1.1 causes my valuation models to estimate a
stock price far below the actual current price. If an analyst believes the Company’s betato be higher than the market, then they
would conclude that Stanley was highly overpriced and would give a strong SELL recommendation. I calculated a WACC of
7.04% which is slightly below comparable firm averages or around 8%. An increase of weight on equity causes an increase in
the WACC. An increase of only .3% in the WACC reduces thevaluation estimate by $10 in the FCFF Model (see Appendix 8 for
further discussion of Ke and WACC calculations).
Dividend Valuation Model
Stanley Black & Decker has paid a dividend every year for the last 138 years and has increased its dividends for thelast 47
consecutive years. The Dividend Valuation Modeluses thecost of equity capital to discount futuredividend payments. I chose a
constant growth rate of 5% due to Stanley’s strong history of dividend payments. ValueLine predicts a 4.5% dividend growth in
the coming years, but due to expected acquisitions, I expect dividends to grow at a higher rate. I chose not to use theValue Line
rate because although the Company has had steady dividend payments, thedividend payout ratio is 32%, which is lower than the
S&P average. Stanley is more focused on reliable dividends than large dividends which causes theprice calculations to be lower
than what I assume to be correct.
Free Cash-Flow to the Firm Model
This method uses the weighted average cost of capital to discount future cash flows that grow at an expected rate. I chose growth
rates that reflected thegrowth that I assume theCompany will see due to acquisitions in the future. Thenext six years will be
important for Stanley because it expects to resume its acquisition strategies in 2016. Operating Income grew dramatically from
$734 million to $1,507 million from 2013 to 2014 respectively (see Appendix 1). I chose a FCFF1 of $800 million because it is a
conservative guess of FCFF1. I could not use any solid mathematical metric to estimate FCFF1 because all previous years are too
inconsistent for any mathematical forecast. I chose an N of six because I think that the Company will grow due to acquisitions
over the next six years. I predict Stanley Black & Decker to grow at a rate of 4.5% for those six years, and then later grow at a
more normal rate of 3.1%. This is a conservative growth rate, and still values the company strongly above its market value.
Free Cash-Flow to Equity Model
This method uses the cost of equity capital to discount future cash flows that grow at an expected rate. I chose the same growth
rate for both Free Cash-Flow models because I assume growth to be roughly the same. I make this assumption because other
than 2010 and 2014, FCFF and FCFE grew at similar rates. Thestark differences in 2010 and 2014 were caused by one-time
dramatic increases in Total Debt and Operating Income respectively. I chose a FCFE1 of $957, which is one year of growth from
2014 using the constant growth rate of 3.2%.
Multiples Analysis
P/E Ratio: According to Morningstar, Stanley’s Price to Earnings ratio is 19.3 in 2014 and has a 4-year average P/E of 21.68
which is slightly higher than theindustry average. Caterpillar, Danaher, Makita, and Cummins have 5-year P/E ratio averages of
18.2, 19.2. 17.1, and 16.1 respectively. I calculated a forward P/E of 17.1 which is similar to industry averages. By choosing the
current P/E ratio of 19.3 and thecurrent EPS of $6.05, I calculate a fair value of $116.77, which is a 12.6% premium.
EV/EBITDA: Due to an uncommonly strong year, operating income jumped dramatically from 2013 to 2014. I do not expect
this trend to continue, so I forecasted an EBITDA decrease of 20% down to $1,565. I then took an average of the previous five
years of EV/EBITDA numbers and calculated a forward EV/EBITDA of 13. This equates to a fair value of $101.55, which is
very close to the current market price of the stock.
Valuation Summary
The Dividend Valuation Modelestimates a stock price that is lower than the current stock price. This is because of how Stanley
issues its dividends; the Company is more concerned about constant dividends as opposed to high dividends. Many firms pay
dividends much higher than Stanley, but few pay dividends as consistently. I used a 40% weighting of this method to calculate
my target price because it reflects theconsistency of the Company’s business practices.
10. Page 10 of 18
The FCFF Valuation Modelestimates a stock price that is higher than the current stock price. This model is solely based on a
conservative FCFF1 guess on my part. Thehistorical data of FCFF is so inconsistent that any attempt to forecast thenext years
FCFF would be subject to numerous market and business conditions. I did not incorporate this valuation method because of this
reason.
The FCFEValuation Modelestimates a stock price that is very similar to the current stock price. This method is more stable than
the FCFF Model but still exhibits somewhat volatile historical data. Theunpredictable changes in Net Borrowings (see Two-
Pager) are the main cause of this Models inconsistencies. That being said, all other aspects of this model are somewhat constant,
providing for a reasonably reliable metric by which to estimate future stock prices. I chose a 30% weighting of this method
because it reflects many aspects of the Company’s financial statements and shows, with relative consistency, how much cash the
company has to spend after capital expenditures and debt obligations.
The P/E Ratio Multipleestimates a stock price that is slightly above the current stock price. This method values the stock using
forward EPS which I predicted to be 6.05. Due to Stanley’s plan to resume with its growth by acquisition strategy, I expect EPS
to grow as much as thegrowth from 2010 to 2011. This is the year after Stanley acquired Black & Decker and I expect next
year’s EPS growth to mimic that growth. I chose a 30% weighting of this method for this reason.
The EV/EBITDA Multipleestimates a stock price that is very similar to thecurrent stock price. This method estimated the
closest price to the current price because it used a metric which is themost consistent aspect of theCompany’s financials.
Although this would seem to be a good reason to use this method, I believe that the P/E Multiplebetter estimates a stock price
because it incorporates the likelihood of high growth in sales due to acquisitions that are expected to begin at the end of this year
(2015).
The 40% Constant Dividend Model, 30% FCFE Model, 30% P/E Multipleweighted average estimates a target price of $91.10.
This is only roughly an 11% discount to the actual current price. I would change theweighting to favor the higher P/E Multiple
Modelif Stanley were to indeed spin off its Commercial Security segment. This is because the spin-off would generate higher
cash flows that would very quickly be used to acquire more companies that associate more closely with Stanley’s core (I.E.
Global Tools & Storage or Fastening Solutions), and thus increase EPS.
Financial Analysis
Earnings
Net sales jumped by more than 100% after the acquisition of Black & Decker in 2010 and caused net income to rise dramatically
as well. Thefollowing year saw a decrease in net income due to increased expenses and fell slightly the year after. Stanley
Black & Decker finished theyear with an 8% increase in earnings which is roughly thesame as the average of the last five years
of earnings. This, however, was lower than anticipated by theCompany;expected earnings were forecasted to grow more, but
the strength of the US dollar negatively impacted exchange rates and created a less-than-ideal environment for foreign business
activities. Recent acquisitions of Niscayah, Aeroscout, Juangsu Guoqiang Tools Co, and Infastech have increased the
Company’s market share and puts it in a position to realize a strong growth in earnings, assuming there is no contraction in
Stanley’s industry sectors.
Cash Flow
Operating Cash Flows increased $428 million and Free Cash Flows increased by $477 to roughly $1 billion between 2013 and
2014. This increase was driven by an increase in earnings along with a decrease in working capital of about 56%. By
implementing SFS (Stanley Fulfilment System), theCompany was able to improve cycle times, reduce production complexity,
and increase working capital turns to 9.2. Stanley’s long-term goal is to increase working capital turns to 10
This growth will facilitate Stanley’s plan to repurchase up to $1 billion in outstanding common stock over the next two years.
Additionally, this increase in Cash Flows will be used to increase dividends paid out to investors in thecoming years. Stanley
has a dedicated strategy of increasing shareholder wealth. Over thelast decade, Stanley has returned roughly 50% of Free Cash
Flows to its shareholders. Theother 50% has mostly been put towards acquisitions.
Stanley Black & Decker’s long-term financial goals include having Free Cash flows greater than or equal to Net Income and
Cash Flow ROI to be 12-15%. To accomplish this, the Company may spin off the Commercial Security segment and expects
strong operating synergies from the recent combination of its CDIY and IAR (Industrial & AutomotiveRepair) segments, now
called Stanley Global Tools & Storage.
11. Page 11 of 18
Balance Sheet & Financing
Totalassets has remained relatively constant over thelast five years at roughly $16 billion since the acquisition of Black &
Decker. Totalliabilities has grown by roughly $1 billion over the last five years to $9.5 billion and totalequity has decreased by
roughly $500 million over the last five years. This lack of growth paired with the increase in cash flows is an indication that the
Company is implementing new strategies and working towards a different debt structureand a different equity structure.
Liquidity Ratios
At the end of 2014, Stanley Black & Decker had a Current Ratio of 1.4 and a Quick Ratio of .84 in 2014. This shows that the
Company has a large amount in inventories. At theend of theyear, according to Company filings, the Stanley had $888 million
backlog of sales orders. Management stated that they were not worried and that this was considered normal. The Company is
known for getting large influxes of orders and filling them in approximately 28 days.
Asset Management Ratios
Stanley Black & Decker had receivables last year of $1.39 billion. The Company had an Inventory Turnover Ratio 2.24 which is
very similar to CDIY averages. Days in Inventory were 163, which indicates that it takes roughly half a year for thecompany to
turnover its entire inventory. Due to thefact that Stanley Black & Decker has such large inventories, it is normal that it would
take this long. Days of sales are roughly $31 million.
Investment Risks
Stanley Black & Decker is a well-diversified company with revenue coming from different and
unrelated industries, but theCompany is still subject to certain risks that could negatively affect
shareholder returns.
Foreign Risk (moderate)
As Stanley moves more into European, Chinese, and Japanese markets, theCompany is susceptibleto
changes in foreign exchange rates, both transaction and translation exposure. 47% of Stanley’s
revenues come from operations outside theUnited States (See Exhibit 6 for Company-wide Revenue by
Region). European markets are currently quite volatile due to changing political structure, increasing
income disparity, and debt issues faced by the EU. European currencies could weaken which would
weaken Stanley’s earnings in those markets. Stanley’s presence in European markets is relatively
new, and a downturn in thosemarkets could force Stanley to remove itself from those markets, greatly
increasing debt ratios. In thelast year however, the strength of the USD has grown in relation to most
foreign currencies. I predict that the USD will fall to more normal levels over the coming years,
providing Stanley with an opportunity to grow overseas. (See Appendix 5 for Currency Trends vs
USD, 2014-2015).
Housing SectorRisk (high)
SWK’s growth is strongly tied with the Homebuilder ETF Index (XHB) (see Exhibit 7). 49% of
Stanley’s revenues comes from the CDIY segment of the company, which is why the two are so
strongly correlated. Stanley is more volatile than theindex, but provides for very similar
growth opportunities. If an investor wanted Stanley’s returns without as much of the risk, the
investor would buy shares of theXHB. Although the housing markets in the US have recovered
from the 2008 recession, growth in this sector is uncertain. Markets have rebounded back to
normal levels and are not expected to have future growth that out-performs theS&P.
Interest Rate Sensitivity Risk (low)
According to company filings, Stanley Black & Decker is not very sensitive to changes in
interest rates. A hypothetical10% increase in interest rates is suspected to have very little effect
on the Company’s financial strength. Stanley does not have a large amount of current debt
outstanding, only about $4 billion which gives the Company a debt/asset ratio of 0.28 while its
industry peer, Caterpillar, has a ratio of 0.46. Having a lower debt/asset ratio gives Stanley a
strong foothold in a volatile rate market. Much of Stanley’s debt obligations are fixed-rate long-
term bonds which gives the Company a steady long-term security from fluctuating interest rates.
Source: Company Website
Exhibit 6
Exhibit 7
XHB 5-Year
SWK 5-Year
12. Page 12 of 18
Sensitivity Analysis
I conducted a sensitivity analysis to determine how my valuation techniques would change
depending on if growth rates increased or decreased by 1%, or if the Div1, FCFF1, or FCFE1 increased or decreased by 10% in
each of the single and multi-staged models. For all the possiblechanges in the models, the largest difference can be seen in
changing the growth rates by 1% in either direction. This indicates that thecorrect valuation is more dependent on accurately
forecasted growth rates as opposed to accurately forecasted base numbers (see Appendix 6 for all following descriptions).
Dividend Valuation Model: Thelowest price indicated was $47.25 which resulted from droppingthe Constant Modelgrowth
rate by 1%. The highest price this model in was $113.89 which resulted from increasing both 2-Stage Modelgrowth rates by 1%.
These prices indicate that the median price for this model along with my forecasted growth rates is $80.57 which is 21.33%
discount price to the current market price.
FCFF Model: Thelowest price indicated was $86.58 which resulted from droppingthe Constant Modelgrowth rate by 1%. The
highest price was $192.17 which resulted from increasing both 2-Stage Model growth rates by 1%. These prices indicate that the
median price for this model along with my forecasted growth rates is $139.38 which is a 36% premium price to the current
market price. This model provides for the largest price difference from theactual market price. This is an indication that it is the
most untrustworthy modelto use for valuing the company.
FCFE Model: The lowest price indicated was $83.22 which resulted from droppingthe Constant Model growth rate by 1%. The
highest price was $131.58 which resulted from increasing the Constant Modelgrowth rate by 1%. These prices indicate that the
median price for this model alongside my forecasted growth rates is $107.4 which is just less than a 5% premium price to the
current market price. This model provides for the closest median price to the actual market price and is the least volatile model in
terms of highest and lowest possibleprices from changing model parameters.
Appendix 1
Source: Morningstar
13. Page 13 of 18
Appendix 2
Appendix 3
SWK Income Statement
USD in Millions
Growth 23% -2% 8% 3%
2010 2011 2012 2013 2014
Revenue 8,410 10,376 10,190 11,001 11,339
Cost of revenue 5,461 6,583 6,486 7,068 7,236
Gross profit 2,949 3,793 3,704 3,933 4,103
Operating expenses
Sales, General and administrative 2,157 2,536 2,509 2,701 2,575
Restructuring, merger and acquisition 243 71 175 176
Other operating expenses 212 266 313 322 21
Totaloperating expenses 2,612 2,873 2,997 3,199 2,596
Operating income 337 920 707 734 1,507
Interest Expense 110 140 144 160 177
Other income (expense) 9 (35) 13 (245)
Income before taxes 236 780 528 587 1,085
Provision for income taxes 39 89 79 69 227
Net income from continuing operations 197 691 449 518 858
Net income from discontinuing ops (16) 434 (28) (96)
Other - 1 1 -
Net income 197 675 883 490 762
Earnings per share
Basic 1 4 5 3 5
Diluted 1 4 5 3 5
Weighted average shares outstanding
Basic 147 166 163 155 156
Diluted 150 170 167 159 160
EBITDA 696 1,330 1,117 1,188 1,712
SWK Income Statement Forecast
USD in Millions assumptions
14. Page 14 of 18
SWK Historical Balance Sheet
Year 2010 2011 2012 2013 2014
Assets
Total cash 1745 907 716 496 497
Receivables 1412 1453 1412 1340 1144
Inventories 1272 1439 1317 1485 1563
Prepaid expenses 224 209 200 171 180
Other current assets 163 315 454 476 565
Total current assets 4816 4323 4098 3969 3949
Non-current assets
Gross property, plant and equipment 2187 2450 2696 3035 3081
Accumulated Depreciation $ (1,020) $ (1,199) $ (1,363) $ (1,550) $ (1,627)
Net property, plant and equipment 1166 1251 1334 1485 1454
Goodwill 5942 6920 7021 7565 7276
Intangible assets 2872 3117 2935 3068 2752
Other long-term assets 343 338 456 448 419
Total non-current assets 10324 11626 11746 12566 11900
Total assets 15139 15949 15844 16535 15849
Liabilities
Current liabilities
Short-term debt 418 527 12 403 8
Accounts payable 999 1313 1350 1576 1579
Taxes payable 220 88 139
Accrued liabilities 1326 1429 587 634 832
Deferred revenues 156 159 156
Other current liabilities 749 362 118
Total current liabilities 2742 3268 3073 3221 2832
Non-current liabilities
Long-term debt 3018 2926 3526 3799 3840
Deferred taxes liabilities 901 905 947 914 993
Pensions and other benefits 643 724 816 744 750
Minority interest 53 63 60 81 83
Other long-term liabilities 766 1059 754 976 923
Total non-current liabilities 5380 5677 6104 6515 6588
Total liabilities 8122 8945 9177 9736 9420
Stockholders' equity
Common stock 441 441 442 442 442
Other Equity -74 -68 -63 -53 -44
Additional paid-in capital 4886 4581 4474 4879 4727
Retained earnings 2302 2707 3300 3485 3926
Treasury stock -420 -308 -1097 -1454 -1353
Accumulated other comprehensive income -116 -349 -388 -499 -1270
Total stockholders'equity 7017 7004 6667 6799 6429
Total liabilities andstockholders'equity 15139 15949 15844 16535 15849
Growth 3% 15% 10%
Year 2014 2015 2016
Revenue 11,339 13,040 14,344
Cost of revenue 7,236 8,348 9,183 % of sales
Gross profit 4,103 4,692 5,161
Operating expenses
Sales, General and administrative 2,575 3,181 3,499 % of sales
Restructuring, merger and acquisition 230 214 forecast
Other operating expenses 21 294 323 % of sales
Total operating expenses 2,596 3,705 4,036
Operating income 1,507 987 1,125
Interest Expense 177 185 203 % of sales
Other income (expense) (245) 13 13 % of sales
Income before taxes 1,085 815 934
Provision for income taxes 227 261 287 % of sales
Net income from continuing operations 858 554 647
Net income from discontinuing ops (96)
Other - - -
Net income 762 554 647
Share Data
Earnings per share
Basic 5
Diluted 5
Basic 156
Diluted 160
EBITDA 1,712
15. Page 15 of 18
Appendix 4
Appendix 5
Appendix 6
Dividend Growth Model
Original Up 1% Down 1% Div Up 10% Div Down 10%
Constant Model 61.38 86.84 47.25 67.51 55.24
2-Stage Model 71.47 101.79 54.68 78.62 64.32
3-stage Model 69.79 98.35 53.97 76.77 62.81
FCFF Growth Model
16. Page 16 of 18
Original G Up 1% Down 1% FCFF Up 10% FCFF Down 10%
SWK Balance Sheet Forecast
USD in Millions 2014 2015 2016
Assets
Current assets
Cash
Total cash 497 572 686 days of sales
Asset Plug - - -
Receivables 1,144 1,090 1,083 days of sales
Inventories 1,563 1,804 2,132 days of sales
Prepaid expenses 180 228 251 1.8% of sales
Other current assets 565 589 726 7% force trend
Total current assets 3,949 4,282 4,878
Non-current assets
Gross property, plant and equipment 3,081 3,358 3,661 9% of sales
Accumulated Depreciation (1,627) (1,679) (1,830) 50% of PPE
Net property, plant and equipment 1,454 1,679 1,830
Goodwill 7,276 8,867 9,754 68% of sales
Intangible assets 2,752 2,998 3,414 70% of TCA
Other long-term assets 419 428 488 10% of TCA
Total non-current assets 11,901 13,972 15,486
Total assets 15,850 18,255 20,364
Liabilities and stockholders' equity
Liabilities
Current liabilities
Short-term debt 8 300 47 WAG Forecast
Liability Plug 1 (411) 239
Accounts payable 1,579 1,695 1,865 13% of sales
Taxes payable 139 139 60 WAG Forecast
Accrued liabilities 832 1,000 780 WAG Forecast
Deferred revenues 156 156 156 Constant
Other current liabilities 118 115 140 WAG Forecast
Total current liabilities 2,833 2,994 3,286
Non-current liabilities
Long-term debt 3,840 4,564 5,020 35% of sales
Deferred taxes liabilities 993 1,174 1,291 9% of sales
Pensions and other benefits 750 880 968 75% of DTL
Minority interest 83 83 83 Constant
Other long-term liabilities 923 1,043 1,148 8% of sales
Total non-current liabilities 6,589 7,744 8,510
Total liabilities 9,422 10,738 11,796
Stockholders' equity
Common stock 442 442 442 Constant
Other Equity (44) (39) (34) -12% Growth Trend
Additional paid-in capital 4,727 5,369 5,898 50% of TotalLiab
Retained earnings 3,926 4,397 4,925 12% Growth Trend
Treasury stock (1,353) (1,353) (1,353) Constant
Accumulated other comprehensive income (1,270) (1,300) (1,310) WAG Forecast
Total stockholders'equity 6,428 7,516 8,568
Total liabilities andstockholders'equity 15,850 18,255 20,364
17. Page 17 of 18
Constant Model 104.37 150.25 77.44 117.4 91.33
2-Stage Model 121.59 171.06 92.1 136.35 106.83
3-stage Model 126.73 177 96.68 142.01 111.46
FCFE Growth Model
Original G Up 1% Down 1% FCFE Up 10% FCFE Down 10%
Constant Model 102.02 131.58 83.22 111.9 92.13
2-Stage Model 102.79 130.64 84.9 112.75 92.83
3-stage Model 105.06 124.67 91.82 107.3 102.82
Appendix 7
Description of N’s and g’s
Dividend Valuation Model
Constant Model: I chose a growth rate of 5% because I expect Stanley to have a relatively stronger dividend in thefuture. Value
Line forecasted a dividend growth rate of 4.5%, but due to thecompany’s stagnation, I believe the Company will increase its
dividend to attract more shareholders.
2-Stage Model: I chose an N of 8 years because I expect Stanley to have a slightly stronger than average growth trend in that
time period due to its growth-by-acquisition strategy and the implementation of SFS 2.0. I chose a growth rate1 of 6.3% because
the company is going to try to attract investors in thecoming years, and I chose a growth rate2 equal to the constant growth
model.
3-Stage Model: I chose an N1 and an N2 of 4 years and 3 years respectively. I chose a g1, g2, and g3 of 6.4%, 5.1%, and 5%
re4spectively. I chose these because I expect Stanley to grow its dividend at a higher than normal rate for a short time, and then
level it off slowly over a period of three years down to a perpetualrate of 5%.
FCFF Model
Constant Model: I chose a FCFF1 of $800 because it is a conservative estimate compared to historical FCFFs. The fluctuation
from year to year is too irregular to forecast a FCFF using any mathematical metric. I chose a growth rate of 3.2% because I
expect the Company’s cash flows to thefirm to grow at conservative rate. The Company plans to acquire some companies in the
future and it will need to allocate some of its cash flow to acquisition costs.
2-Stage Model: I chose an N of 6 years. I chose a small N because it is too difficult to see long-term how this company might
grow. A relatively small g1 and g2 of 4.5% and 3.1% respectively predicts this uncertainty with conservative estimates.
3-Stage Model: I chose an N1 and N2 of 6 years and 2 years respectively. I chose these N’s for the same reason I chose the N’s
for the 2-Stage Model. TheCompany’s historical FCFF is extremely volatile and must be forecasted only a short time into the
future because any longer estimate could not be considered with any validity. I chose a g1, g2, and g3 of 4.5%, 3.5%, and 3.2%
respectively. These growth rates are similar to the2-Stage Model, but theg2 indicates that there will be a gradual return to the
perpetualgrowth rate over a period of two years.
FCFE Model
Constant Model: I chose a constant growth rate of 4% because I expect FCFE to grow slightly more than the FCFF. I expect this
because the Company’s expected futureacquisition costs will affect FCFF more than FCFE, thus causing FCFE to grow slightly
stronger. The FCFE also exhibits slightly more normaJl historical data compared to FCFF. That being said, the FCFEis still
very volatile relatively speaking and any long-term estimate would be subject to gross inaccuracy.
18. Page 18 of 18
2-Stage Model: I chose an N of 6 years and a g1 and g2 of 4.5% and 3.9% respectively. I chose a small N because of reasons
mentioned above regarding volatility of historical data. I chose a g1 of 4.5% because I expect the company to grow more strongly
in the short-termand to gradually move towards a normal rate of 3.9%, slightly below the constant rate mentioned above.
3-Stage Model: I chose an N1 and N2 of 6 and 2 years respectively because I
expect the short-termgrowth period to be similar to the 2-Stage Model. I
chose a g1, g2, and g3 of 4.5%, 3.7%, and 3.5% respectively because I expect
short-termgrowth to be similar to the 2-Stage Modelalong with a gradual
drop to a constant growth rate that is slightly below the constant rate
mentioned above.
Appendix 8
WACC Calculation
Debt Component
Debt + Equity 10,359.4
LT Debt 3,444.09
ST Debt 600.4
TotalDebt 4,044.49
Weight on debt 22%
Pre-tax cost of TotalDebt 2.40%
Effective Tax Rate 18.89%
After tax Cost of Debt 0.43%
Equity Component
Weight on equity 78%
Market Cap 16,358.66
Risk Free Rate 5%
Beta 0.95
Beta adjusted 0.97
MRP 0.42
Cost of Equity 8.49%
WACC 7.04%