4. Contents
Summary
Preface
1 The 1999 winter storms
1.1 Meteorological sequence of events
1.2 1999 loss figures – comparison with the 1990 winter storm series
1.3 Details of the 1999 loss figures
2 Data used as the basis for the analysis of the 1999 windstorm losses
2.1 Meteorological data: wind fields
2.2 Underwriting data
3 Analysis of portfolio and loss data relating to the 1999 winter storms
3.1 Evaluation method
3.2 Loss profiles
4 New findings on the correlation between various loss parameters
and wind speed
5 Windstorm loss potentials in Europe – accumulation aspects
5.1 Preliminary considerations
5.2 Occurrence probability of windstorm market losses
5.3 Methods of estimating market loss potentials
5.4 Windstorm scenarios – examples of wind fields
with a loss return period of 100 years
Special topic 1: The frequency of windstorms in Europe
Special topic 2: Climate change – Is the windstorm risk changing too?
Terminology, abbreviations
Bibliography, sources
Munich Re publications
Page 2
Page 3
Page 4
Page 18
Page 26
Page 33
Page 53
Page 66
Page 68
Page 70
Page 71
Page 72
5. 2
Munich Re Winter storms in Europe (II)
Summary
Summary
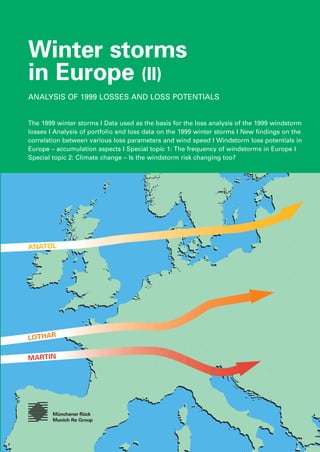
The losses from the gales Anatol, Lothar, and Martin in December 1999 supply
valuable new findings on the windstorm risk in Europe. A comparison with the
loss experience from the winter storm series in 1990 has led to a new assess-
ment of important loss parameters in France and Germany. For the first time
ever, detailed windstorm data for Denmark was available in a form that could be
used in a scientific study.
The crucial findings on vulnerability to windstorm losses in the countries most
severely affected are as follows:
• Denmark
The loss ratios for residential and commercial risks are in some cases much
higher than in the other European countries we analysed in 1990 and 1999.
The increase in the loss ratios is roughly equivalent to the 4th to 5th power of
wind speed. The loss parameters of loss frequency and average loss per
affected policy are comparable with the corresponding data on other countries
in this study.
• Germany
At high wind speeds, the increase in losses (loss ratios) is steeper than that
extrapolated on the basis of the 1990 data. The 1999 loss frequencies for resi-
dential buildings are comparable with the 1990 loss experience but are below
those for household and commercial risks in 1990. The average losses in all
the classes examined are mostly much higher than in 1990 but still within the
expected range (i.e. in line with the development of the average sums insured
of the affected risks).
• France
Since there are no data on sums insured in the primary insurance market, it is
only marginally possible to compare the loss ratios from Lothar and Martin
with the 1990 data. Nevertheless, we can say that the 1999 events tend to con-
firm the loss experience of the earlier event, although the losses at higher
wind speeds were in some cases larger in 1999. At moderate wind speeds the
loss frequency in 1999 is comparable with 1990 but the increase in the loss
frequency at higher windstorm intensities is in part steeper. The average
losses are much higher than in 1990; they follow the (assumed) development
of the insured values.
In conjunction with an analysis of the windstorm hazard in Europe and on the
basis of exposure distributions, these new findings may be used to derive
updated occurrence probabilities of extreme market losses. For the market
losses from Lothar, for instance, (€5.9bn) a return period of around 15 years
may be estimated (for Europe as a whole). Detailed results from our examin-
ation of loss occurrence probabilities may be found in the final section of this
publication.
6. 3
Munich Re Winter storms in Europe (II)
Preface
Preface
“Windstorms in Europe – (still) an underestimated risk?”
This was one of the central questions posed by numerous insurers and rein-
surers once it was established that the total insured loss from the gales Anatol,
Lothar, and Martin in December 1999 would exceed €10bn. And yet in 1990, not
even ten years earlier, a series of gales in western Europe – Daria, Vivian,
Wiebke, and five others – had presented insurers with a bill approaching €9bn
(1990 values).
Munich Re responded to the losses from the catastrophic events in 1999 – as it
had after the 1990 series of gales – by carrying out an in-depth examination of
the windstorm risk in Europe. To this extent, then, the current publication repre-
sents an update of our exposé “Winter Storms in Europe: Analysis of 1990
Losses and Future Loss Potentials” supplemented with the loss experience from
Anatol, Lothar, and Martin.
The main objective of the study was to estimate the loss potentials from future
windstorm events in Europe. For this purpose, we analysed comprehensive
meteorological and underwriting data relating to the 1999 windstorms and
recalculated the correlation between wind speed and loss intensity. In Germany
and France, which were severely affected in 1990 and in 1999, the loss experi-
ence from the 1990 gales was compared with the 1999 data. This, in conjunction
with various hypothetical windstorm scenarios and on the basis of individual
exposure distributions, makes it possible to estimate potential future accumu-
lation losses for individual portfolios and even entire markets.
In our publication on the 1990 windstorms, the question of global climate
change and its impact on the insurance industry was considered in the outlook
at the end of the study. In this new publication, this aspect assumes a central
position, and we have endeavoured to consider and quantify this risk of change
in our estimate of occurrence probabilities.
We would like to thank our clients for supplying us with their exposure and loss
data on the December 1999 windstorms and thus making this new publication
possible.
7. 4
Munich Re Winter storms in Europe (II)The 1999 winter storms
1 The 1999 winter storms
In December 1999 Europe was hit by three severe windstorms which in the
most severely affected countries reached a wind force of 12 on the Beaufort
Wind Scale (“hurricane”, i.e. over 118 km/h) and attained peak wind speeds
locally of over 180 km/h.
This windstorm series was opened on 3rd December 1999 by Anatol, which pro-
duced a record loss in Denmark of almost €2bn (total insured loss) – thus reach-
ing a scale that many insurers had previously thought impossible. Together with
other losses in Great Britain, Germany, and Sweden, the overall burden to be
carried by the insurance industry from this event was €2.2bn.
A good three weeks later, on 26th December 1999, a further gale, Lothar, devel-
oped over the Atlantic off the northwest coast of France. Categorized as a me-
teorological “bomb” because of its almost explosive generation, this gale like-
wise caused new and unexpected record losses. The French insurance industry
had to pay claims totalling approx. €4.4bn. The loss generated in France by
Lothar was therefore about seven times as high as the previous record set in
1990 by the winter storm Herta with a loss of €600m (1990 values). The overall
loss in Europe as a whole came to €6bn, making Lothar the largest loss ever to
be carried by the insurance industry following a European windstorm event. For
the sake of comparison, the previous record for Europe as a whole had been set
by Daria in 1990, with insured losses equivalent to almost €4.4bn, with Great
Britain bearing the largest share: €2.6bn.
One day later, on 27th December 1999, Martin, a second low-pressure vortex on
the edge of a low-pressure system over the northern Atlantic, developed in a
way very similar to Lothar. Martin followed a track somewhat further south and
mainly hit southern France but also affected northern Spain and western parts
of Switzerland. The French insurance industry again had to bear the brunt of the
loss, €2.4bn of the €2.5bn recorded in Europe as a whole.
Like the 1990 series, the two gale events that hit western Europe in rapid suc-
cession in December 1999, inflicting damage on some areas twice in less than
48 hours, constituted what is called a “cluster” of intensive low-pressure vor-
tices, a phenomenon not untypical of extratropical storms. In 1990 Vivian
(25th–27th February 1990) and Wiebke (28th February–1st March 1990) were
mainly responsible for two windstorm catastrophes in short succession and
marked the conclusion of an exceptionally “gale-ridden” large-scale meteoro-
logical situation subsequent to 25th January 1990 (Daria). The formation of clus-
ters is not to be ignored in any consideration of accumulation aspects on the
basis of annual aggregate losses or in the design of reinsurance and retroces-
sion agreements for windstorm cover in Europe.
8. 5
Munich Re Winter storms in Europe (II)
Track of Anatol
2nd–4th December 1999
The bullets mark the centre of the low-
pressure system at three-hour inter-
vals (the figures: central pressure
in hPa).
Source: Deutscher Wetterdienst, 2000.
1.1 Meteorological sequence
of events
Meteorological sequence of events
1999 was on the whole a very warm year throughout the world. Together with
1990, it was the third warmest year of the century in central Europe (after 1994
and 1934). In Germany the average temperature for the year was 1.3°C above
the average for the so-called climatic normal period of 1961–1990. In December
the temperatures on the European mainland were also much higher than the
long-term average – with the exception of the week before Christmas. The large-
scale meteorological situation which led to the development of Anatol, Lothar,
and Martin was therefore quite similar to the one at the beginning of the series
in 1990.
Hamburg
Berlin
Copenhagen
Wroclaw
Krakow
Budapest
Vienna
Laibach
Zagreb
Milan
Marseilles
Berne
Paris
London
Dublin
Brussels
Amsterdam
Cologne
Luxembourg
Munich
Riga
Madrid
Lisbon
Barcelona
Bordeaux
Rome
Tirana
Skopje
Belgrad
Sarajevo
Bratislava
Warsaw
Prague
Kaliningrad
Vilna
Reval
Oslo Stockholm
1000 hPa
02.12.99
21:00 UTC
993 985 976
968 960 958 952 952 953 956
960
963
04.12.99
09:00 UTC
The development of Anatol began over the North Atlantic northwest of Ireland
in the early morning of 3rd December. On its way over Scotland and the North
Sea the central pressure of the low-pressure vortex dropped by more than
40 hPa in the space of only twelve hours, reaching its minimum of 952 hPa
directly over Denmark. This made Anatol the strongest gale to hit Denmark in
the whole of the 20th century. The highest wind speeds were recorded south of
the low-pressure system over German Bight in the central North Sea and in
southern Denmark. With gusts of 180–185 km/h record levels were registered in
the long-term wind time series at some meteorological stations. On the island
of Sylt (Germany) the maximum wind speed of 184 km/h was 10% above the
previous record set in 1976. As no recordings could be taken for several hours
after that because of problems with the electricity supply, the occurrence of
even stronger gusts during that time cannot be ruled out. The situation was
rather similar in terms of peak wind speeds in Denmark, where a record speed
(Political boundaries should not be regarded as having official significance.)
9. 6
Munich Re Winter storms in Europe (II)Meteorological sequence of events
Denmark
Germany
Rømø
Copenhagen
Sylt
Cape Arcona (Rügen)
185 km/h
155 km/h
184 km/h
166 km/h
Selected maximum wind speeds of Anatol
of 185 km/h was recorded on the North Sea island of Rømø. In the early hours
of 4th December Anatol was still blowing gusts of 130 km/h in Gdansk (Poland)
and 126 km/h in Kaliningrad (Russia).
The gale initially came from the west-southwest, then changed to west and
in the early evening on 3rd December to west-northwest, generating heavy
storm surges on the North Sea coasts of Denmark and Schleswig-Holstein in
Germany. In Hamburg the water rose to 5.86 m above NN, the fourth highest
storm-surge level in recent decades. Fortunately, the dykes stood up to the
deluge, and there was no major damage.
Source: Deutscher Wetterdienst, 2000.
10. 7
Munich Re Winter storms in Europe (II)
Track of Lothar
26th December 1999
The bullets mark the centre of the
low-pressure system at three-hour
intervals (the figures: central pressure
in hPa).
Source: Deutscher Wetterdienst, 2000.
Meteorological sequence of events
On 25th December 1999 a disturbance built up over the northeastern Atlantic on
a sharp air mass boundary (frontal zone) between cold air in the north and
warm air in the south belonging to a mighty central low (given the name Kurt)
and developed into a series of intense low-pressure systems. Around noon, one
of these systems, the secondary low named Lothar, had a central pressure of
995 hPa, which meant that it was still a rather inconspicuous bad weather front.
As in the case of Anatol, the development of the low-pressure system was
almost explosive, involving a large pressure drop within the space of a few
hours. The most noticeable change in pressure was observed at the Caen
station on the French coast, where a pressure drop of 28 hPa was recorded
between 3 and 6 o’clock CET followed by a similarly extreme increase of 29 hPa
between 6 and 9 o’clock CET after the passage of a low-pressure core. Such
dimensions had not been observed in Europe for at least thirty years.
The atmospheric pressure reached its minimum of 961 hPa over Normandy.
Anatol had a minimum central pressure of 952 hPa, making Lothar a much less
extreme event in meteorological terms. Although many weather stations regis-
tered record wind speeds, Lothar's maximum remained distinctly below the
levels reached by Anatol in Denmark and northern Germany.
Hamburg
Berlin
Copenhagen
Wroclaw
Krakow
Budapest
Vienna
Laibach
Zagreb
Milan
Marseilles
Berne
Paris
London
Dublin
Brussels
Amsterdam
Cologne
Luxembourg
Munich
Riga
Madrid
Lisbon
Barcelona
Bordeaux
Rome
Tirana
Skopje
Belgrad
Sarajevo
Bratislava
Warsaw
Prague
Kaliningrad
Vilna
Reval
Oslo Stockholm
985 hPa
26.12.99
00:00 UTC
975 965 970
975
977
980
26.12.99
18:00 UTC
(Political boundaries should not be regarded as having official significance.)
11. 8
Munich Re Winter storms in Europe (II)Meteorological sequence of events
France
Germany
Switzerland
Rennes
Alençon
Rouen
Orly
Metz
Colmar
Strasbourg
Saarbrücken
Karlsruhe
Stuttgart
Augsburg
Munich (airport)
Neuchâtel
Berne (Liebefeld)
Zurich (SMA)
St. Gall
126 km/h
166 km/h
140 km/h
173 km/h
155 km/h
165 km/h
144 km/h
130 km/h
151 km/h
144 km/h
130 km/h
122 km/h
115 km/h
134 km/h
158 km/h
131 km/h
Selected maximum wind speeds of Lothar
Sources: Deutscher Wetterdienst, 2000; Météo France, 2000; MeteoSwiss, 2000.
The above table only considers wind speeds recorded at weather stations with a
normal exposure. Much higher values were recorded in extreme places in the
Alps and the Black Forest:
– Säntis (Switzerland): 230 km/h
– Jungfraujoch (Switzerland): 249 km/h
– Feldberg (Germany): 212 km/h
– Wendelstein (Germany): 259 km/h
Lothar's wind field over France was very similar to Herta's in February 1990.
And Lothar struck a severe blow to Greater Paris on 26th December 1999, just as
Herta had done on 3rd February 1990. There were also strong similarities in
terms of the geographical extent of the two wind fields. The main difference
between these two windstorm systems was the wind speed. With peak gusts of
around 170 km/h in Paris, Lothar was in fact 30–40% more intense than Herta,
which reached about 120–130 km/h.
12. 9
Munich Re Winter storms in Europe (II)
Track of Martin
27th–28th December 1999
The bullets mark the centre of the
low-pressure system at three-hour
intervals (the figures: central pressure
in hPa).
Source: Deutscher Wetterdienst, 2000.
Meteorological sequence of events
By the evening of 26th December 1999 Lothar’s centre had shifted eastwards to
Poland. But then another secondary low, Martin, detached itself on the frontal
zone over the North Atlantic in almost the same way as Lothar. Its track was a
little further to the south so that the regions particularly affected in France were
around Bordeaux, Biarritz, and Toulouse. On 27th December 1999 Martin
brought gale-force winds to northern Spain, western parts of Switzerland, and
Upper Italy too.
Hamburg
Berlin
Copenhagen
Wroclaw
Krakow
Budapest
Vienna
Laibach
Zagreb
Milan
Marseilles
Berne
Paris
London
Dublin
Brussels
Amsterdam
Cologne
Luxembourg
Munich
Riga
Madrid
Lisbon
Barcelona
Bordeaux
Rome
Tirana
Skopje
Belgrad
Sarajevo
Bratislava
Warsaw
Prague
Kaliningrad
Vilna
Reval
Oslo Stockholm
970 hPa
27.12.99
12:00 UTC
967 964 967 970
973
976
28.12.99
06:00 UTC
The insurance industry, particularly in France, was thus confronted with catas-
trophic windstorm losses from two events in less than 48 hours. As already
demonstrated by the series of gales in January/February 1990, the development
of a windstorm series over the North Atlantic with a close succession of intense
low-pressure systems is not unusual given an appropriate large-scale meteoro-
logical situation.
France Île d’Yeu
La Rochelle
Cap Ferret
Bordeaux
Limoges
Clermont-Ferrand
162 km/h
151 km/h
173 km/h
144 km/h
148 km/h
159 km/h
Selected maximum wind speeds of Martin
Source: Météo France, 2000.
(Political boundaries should not be regarded as having official significance.)
13. 10
Munich Re Winter storms in Europe (II)1999 Loss figures – comparison with the 1990 windstorm series
1.2 1999 loss figures –
comparison with the 1990 winter
storm series
Insured losses
The table below shows the geographical distribution of the insured losses gen-
erated by the four most devastating gales in 1990 (original values converted
into € and rounded) and the gales Anatol, Lothar, and Martin in 1999.
Country/ Region
Austria
Belgium
Denmark
France
Germany
Great Britain
Luxembourg
Netherlands
Spain
Switzerland
Loss total*
Comparison of insured losses from the windstorm series in 1990 and 1999 (€m)
*For Europe as a whole, including countries not shown individually. All loss figures in original values and converted into €.
Source: Munich Re NatCatSERVICE.
Martin
27/28.12.1999
2,450
50
2,500
Lothar
26.12.1999
4,450
650
800
5,900
Anatol
3/4.12.1999
2,000
100
2,250
Wiebke
28.2/1.3.1990
70
50
100
520
280
50
30
50
1,180
Vivian
25–27.2.1990
70
170
30
90
520
700
50
90
50
1,820
Herta
3/4.2.1990
100
600
260
50
100
1,110
Daria
25/26.1.1990
220
50
260
520
2,600
50
700
4,400
In order to compare the 1990 and 1999 series of gales on a uniform exposure
basis, the 1990 losses must be adjusted to 1999 values. Taking the development
of insurance density and the average sum insured per policy/risk as a basis, the
total sum insured of all exposed (property) values in western Europe increased
by a factor of 1.8 to 2.0 between 1990 and 1999.
This results in the following observations:
– On the basis of the 1999 windstorm exposure, the “as if” overall insured loss
from the 1990 windstorm series comes to around €16bn, i.e. 50% more than
the loss carried by the insurance industry as a result of Anatol, Lothar, and
Martin. This means that the loss total in Europe as a whole from the 1999
gales was not a record for the insurance industry.
14. 11
Munich Re Winter storms in Europe (II) 1999 Loss figures – comparison with the 1990 windstorm series
– In Denmark and France, however, accumulation losses from individual wind-
storm events reached new highs:
• Denmark: At €2bn the loss generated by Anatol was about 20 times greater
than that generated by Daria in 1990 (“as if” 1999: €100m). The largest
insured windstorm loss in Denmark prior to 1999 occurred in 1981 and
amounted to about €120m (1981 values). Assuming a fourfold increase in
exposure in Denmark between 1981 and 1999, we estimate that, after ad-
justing for inflation, Anatol exceeded the hitherto largest windstorm loss
by a factor of more than 4.
• France: The loss caused by Lothar was also about four times as large as the
loss caused by Herta (“as if” 1999: €1.1bn).
– Germany: Lothar generated almost two-thirds of the loss caused by Daria or
Vivian (both “as if” 1999: €1.0bn). It constituted no more than a medium-size
loss for the German insurance market. Nevertheless, the losses were focussed
to an unusually large degree in the southwest region of Germany so that
insurers whose exposure was concentrated in this region were very badly hit.
15. 12
Munich Re Winter storms in Europe (II)Details of the 1999 loss figures
2
3
4
16. 13
Munich Re Winter storms in Europe (II)
1.3 Details of the 1999
loss figures
Details of the 1999 loss figures
Bodily injury and property damage
Anatol
– Countries/regions most severely affected: Denmark, Germany, Great Britain,
Sweden, Lithuania, Latvia, Russia, Poland
– > 20 fatalities
– Economic losses: €2.9bn
– 600,000 individual insured losses
– Average insured loss: €3,700 (all lines of business)
– Main damage: roofs, façades, vehicles, boats, scaffolding;
also: flooding due to heavy rain
– Infrastructure: 165,000 households without electricity due to major damage to
the overhead line network (Denmark, Sweden)
Lothar
– Countries most severely affected: France, Germany, Switzerland, Belgium,
Austria
– 110 fatalities
– Economic losses: €11.5bn
– 2.4 million individual insured losses
– Average insured loss: €2,500 (all lines of business)
– Main damage: roofs, façades, scaffolding, cranes, forests, overhead
line network
– Infrastructure: over four million households without electricity for several
weeks in many cases (France); Électricité de France suffered (uninsured)
losses amounting to several billion francs because of damage to the overhead
line network and power stations; public transport disrupted with stoppages
lasting for days (especially France and Greater Paris); airports in Paris tem-
porarily closed; telecommunications networks (fixed and mobile networks)
disrupted for days in some cases (interrupted power supplies, damage to
transmission facilities)
Martin
– Countries most severely affected: France, Spain, Switzerland
– 30 fatalities
– Economic losses: €4bn
– One million individual insured losses
– Average insured loss: €2,500 (all lines of business)
– Main damage (like Lothar): roofs, façades, scaffolding, cranes, forests,
overhead transmission lines, agriculture
– Numerous historical buildings damaged (castles, monasteries, etc.)
– Infrastructure: over one million households (in France) without electricity
17. 14
Munich Re Winter storms in Europe (II)Details of the 1999 loss figures
5
6
7
18. 15
Munich Re Winter storms in Europe (II) Details of the 1999 loss figures
8
9
10
19. 16
Munich Re Winter storms in Europe (II)Details of the 1999 loss figures
Forest damage
On account of their intensity and the regions they affected, all three of the
severe gales in December 1999 generated extreme losses in the forestry sector
in Denmark, France, Germany, and Switzerland.
The two tables below present a long-term comparison of timber losses in
Europe and are a vivid illustration of just how exceptional 1999 was:
Country/Region
France
Germany/Baden-Württemberg
Germany/Bayern
Switzerland
Timber loss
(million m3)
140.0
25.0
4.3
12.7
Relationship to average
annual usage (%)
300
250
40
280
Forest damage caused by Lothar
Source: WSL, 2001.
Country/Region
Denmark
Sweden
Timber loss
(million m3)
3.4
5.0
Relationship to average
annual usage (%)
100–150
<10
Forest damage caused by Anatol
Sources: Danish Forestry Association, 1999; Swedish Forest Industries Federation, 2001.
11
20. 17
Munich Re Winter storms in Europe (II) Details of the 1999 loss figures
As there are a number of factors which have an impact on the extent of loss in
terms of both forest damage and property damage, the following supplemen-
tary information will be useful for evaluating the losses:
Change in forest area since the 19th century:
– Switzerland: +35%
– Baden-Württemberg (Germany): +27%
– France: +70%
Change in wood volume per unit area in the 20th century (data for earlier
periods not available):
– Switzerland: +1% per annum
– Baden-Württemberg (Germany): +1% per annum
– France: +1% per annum
If we combine the increase in area and the change in wood volume per unit
area, we find that the standing wood volume in the three countries examined
has increased by a factor of between two and three in the last 100 years.
This explains at least in part the increase in forest damage in Europe since 1860
(see graph above). Comparisons of tree numbers in European forests in recent
decades have also shown that the proportion of tall – and hence more wind-
storm-prone – trees has increased too. Whether any other factors such as stress
caused by air pollution and climate change have led to a change in the vulner-
ability to windstorm has not yet been fully determined.
Timber losses from major windstorm events in Europe from 1860 to 1999
Timberlossinmillioncubicmetres
150
100
50
0
1860
1870
1880
1890
1900
1910
1920
1930
1940
1950
1960
1970
1980
1990
1999
197
The 1999 windstorm series caused a record timber loss of almost 200m m3, exceeding by more than 50% the previous record forest damage of 120m m3
caused by the 1990 gales.
Source: WSL, 2001.
21. 18
Munich Re Winter storms in Europe (II)Data used as the basis for the analysis of the 1999 windstorm losses
2 Data used as the basis for the
analysis of the 1999 windstorm
losses
2.1 Meteorological data:
wind fields
In this study we used wind speed data received from the following meteorological
services: Météo France, MeteoSwiss, and Deutscher Wetterdienst (for locations in
Germany and other countries).
With the aid of a spatial interpolation method (kriging, see box) the wind fields
of Anatol, Lothar, and Martin were estimated from the recorded data with a geo-
graphical resolution of 0.1 x 0.1 degrees.
Originally developed to optimize mining processes, the interpolation
method named after the South African engineer D. G. Krige is being used
increasingly by geoscientists in such procedures as groundwater modelling
and soil mapping. The advantage of this method is that it takes spatially
stochastic processes into account. It also allows the effects of persistence
to be considered as a function of distance and direction. Applied to the
generation of wind fields this advantage may be described as follows:
Determining the wind field of a windstorm event in a specific area does not
involve taking a snapshot at a particular point in time but making obser-
vations over a longer period of hours to days. Within this space of time the
dynamic low-pressure system determining the wind field moves across the
area, generally from west to east. The occurrence of peak gusts in time and
space will therefore be more or less consistent with the shifting of the low-
pressure system. If the maximum wind speed is to be determined at a par-
ticular place, the probability of similarly high wind speeds is greater paral-
lel to the track than perpendicular to it. This may be taken into account in
the kriging process by means of an anisotropic (i.e. direction-dependent)
interpolation.
“Kriging interpolation method”
22. 19
Munich Re Winter storms in Europe (II)
Wind field (peak gusts) of Anatol over
Europe (2nd–4th December 1999).
Detailed view of the wind field
of Anatol.
Meteorological data: wind fields
Source: Munich Re.
Source: Munich Re.
80 90 100 110 120 130 140 150 160 170 180 190 200
Wind speed (km/h)
23. Meteorological data: wind fields
20
Munich Re Winter storms in Europe (II)
Wind field (peak gusts) of Lothar over
Europe (26th December 1999).
Detailed view of the wind field
of Lothar.
Source: Munich Re.
Source: Munich Re.
80 90 100 110 120 130 140 150 160 170 180 190 200
Wind speed (km/h)
24. 21
Munich Re Winter storms in Europe (II)
Wind field (peak gusts) of Martin over
Europe (27th–28th December 1999).
Detailed view of the wind field
of Martin.
Meteorological data: wind fields
Source: Munich Re.
Source: Munich Re.
80 90 100 110 120 130 140 150 160 170 180 190 200
Wind speed (km/h)
25. 22
Munich Re Winter storms in Europe (II)Underwriting data
2.2 Underwriting data
Example of an exposure distribution
for residential risks in Denmark
(CRESTA data on the basis of postal
codes).
The data we received from clients that participated in this study were mainly in
the form of the following portfolio and loss information:
– number of policies/risks
– sums insured (in France: premiums and/or number of risks)
– number of losses
– loss amounts
This information was broken down into the various classes of insurance,
CRESTA zones (postal codes, in France: départements), size categories (loss
and/or exposure data), and windstorm events.
The first step involved allocating the primary insurance data, transmitted
originally on the basis of CRESTA, to a 0.1 x 0.1 degree grid identical to the
wind field.
< 500 500–1,000 1,000–2,000 2,000–5,000 > 5,000 Dkr m
Source: Munich Re.
26. 23
Munich Re Winter storms in Europe (II)
Using the example of Denmark, the two figures on pages 22 and 23 show the
geographical distribution of the sums insured for a portfolio of single-family
and multiple-family houses. Similar maps were produced for all relevant expos-
ure data (number of policies and/or risks; in France, premiums and/or number of
rooms instead of sums insured).
The same exposure distribution as in
the figure on page 22, but using a
0.1 x 0.1-degree grid.
Underwriting data
<200 200–500 500–1,000 1,000–5,000 > 5,000 Dkr m
Source: Munich Re.
27. 24
Munich Re Winter storms in Europe (II)Underwriting data
In the same way as the exposure data, the loss data (loss amount, number of
losses) in the corresponding portfolios were processed and distributed on an
identical 0.1-degree grid.
Three layers of information on a standardized grid with a size of about 7 x 11 km
thus formed the basis for analysing the windstorm vulnerability of individual
portfolios:
– insured values (broken down by class of insurance)
– insured losses (broken down by class of insurance and by event: Anatol,
Lothar, and Martin)
– interpolated wind fields for the 1999 windstorms
An example of a distribution of wind-
storm losses for residential risks from
Anatol in Denmark (on the basis of
postal codes).
<1 1–2 2–5 5–10 > 10 Dkr m
Source: Munich Re.
28. 25
Munich Re Winter storms in Europe (II)
The same exposure distribution as in
the figure on page 24, but using a
0.1 x 0.1-degree grid.
Underwriting data
<1 1–2 2–5 5–10 > 10 Dkr m
Source: Munich Re.
29. 26
Munich Re Winter storms in Europe (II)Analysis of portfolio and loss data
3 Analysis of portfolio and loss
data relating to the 1999 winter
storms
The main objective of this study was to estimate loss potentials from future
windstorm events in Europe on the basis of the experience from the 1999 wind-
storm series. As France and Germany were also severely affected during the
1990 winter storms, the 1999 loss data for these two countries were compared
with the corresponding data from 1990.
The following loss parameters were analysed in depth in this study:
– loss ratio (ratio between loss and sum insured, expressed in ‰)
– loss frequency (ratio between the number of loss-affected policies/risks and
the total number of policies/risks, expressed in %)
– average loss (ratio between the overall loss and the number of loss-affected
policies, expressed in €)
The calculations were carried out separately for each class of insurance with
windstorm cover.
The next step in the study involved analysing the distributions of loss amounts
(“loss profiles”), which provided us with an idea of the effect that deductibles in
windstorm insurance might have on the overall insured loss and the number of
individual claims that have to be settled.
France
In France, unlike the majority of insurance markets, the sums insured are
omitted in the insurance policies for simple risks business (risques sim-
ples) and frequently for commercial business (risques commerciaux) too.
Furthermore, the premium is not calculated on the basis of quantified val-
ues but on the basis of auxiliary parameters like the number of rooms, the
area of the building/apartment, or an (estimated) average sum insured per
policy/risk.
The problem is that modelling the windstorm risk (simulating historical
and/or hypothetical windstorms to calculate the accumulation PML and the
technical risk price) is performed in nearly all commercially available wind-
storm models and in the simulation programmes of major reinsurers on
the same basis: the vulnerability parameter “loss ratio” (loss/sum insured)
as a function of the wind speed of windstorms. In non-proportional (excess
of loss) reinsurance treaties too, priorities and liability limits are defined in
monetary units.
Sums insured in France and Denmark
30. Estimating the sums insured on the basis of information in the original
policies assumes corresponding conversion parameters. Owing to the lack
of a standardized procedure in the market for calculating exposure, the
range of estimates is very large and heavily dependent on personal assess-
ments. Consequently, the exposure estimates from various sources (com-
mercial modellers, reinsurers) for one and the same portfolio often deviate
from each other by a factor of two to three.
The loss ratios calculated in this study for France (graphs in Chapter 4) are
based on the following conversions:
Denmark
The sums insured are not always shown in insurance policies in Denmark
either. As a rule, however, insurance companies convert their own expo-
sure definitions into monetary units before reporting the CRESTA (accumu-
lation) data to their reinsurers.
In our analysis of the loss ratios for Denmark (graphs in Chapter 4) we have
taken over these conversion factors unchanged:
27
Munich Re Winter storms in Europe (II) Analysis of portfolio and loss data
Type of risk
simples
professionnels/commerciaux
entreprises
agricoles
Average SI/policy (€)
240,000
460,000
4,600,000
400,000
Premium rate
0.8 ‰
0.8‰
0.6‰
1.5‰
*buildings and contents
Source: Munich Re, Geo Risks Research Department.
Conversion parameters for estimating sums insured (on a replacement
value basis) in France*
Type of risk
residential
commercial/industrial
agricultural
Average SI/policy (€)
240,000
3,000,000
620,000
*buildings and contents
Source: Danish primary insurance companies.
Conversion parameters for estimating sums insured (on a replacement
value basis) in Denmark*
31. In the light of the meteorological observations in all the countries affected, we
must assume even higher wind speeds than those recorded in 1999 when esti-
mating future probable maximum losses. For this reason the loss parameters
analysed here (loss ratio, loss frequency, average loss) were extrapolated on the
basis of the available data to give the maximum expected wind speeds.
This extrapolation was based in essence on the assumption that if the wind
speed increases by a factor of x, the losses will rise by the same power of x as
was calculated from the increase in the loss curves using the actual data from
1999.
28
Munich Re Winter storms in Europe (II)Evaluation method
3.1 Evaluation method
The large-scale peak wind speeds reached by Anatol, Lothar, and Martin in
some regions were as high as 160 km/h, whereas the local peak values in
exposed locations – which say very little about the damaging effects and were
therefore not used in our study – were in some cases considerably higher (up to
almost 260 km/h).
Land
Maximum wind speed (kmph)
Switzerland
140
Germany
140
France
160
Denmark
160
Peak wind speeds observed over large areas during the 1999 windstorm series
Wind speed (km/h)
Loss ratio (‰)
160
1.20
140
0.75
120
0.40
100
0.20
80
0.08
Wind speed and loss ratio for a sample homeowners insurance portfolio in
Germany
32. 29
Munich Re Winter storms in Europe (II) Evaluation method
The average increase in the loss ratio is approx. the fourth to fifth power of the
increase in wind speed (cf. “New findings on the correlation between various
loss parameters and wind speed” beginning on page 33).
This means, for example, that given an increase in wind speed from 160 km/h to
190 km/h, the loss ratio is
i.e. more than twice as high,
with
LR(190) being the wanted loss ratio based on a wind speed of 190 km/h and
LR(160) being the average loss ratio in homeowners insurance based on a wind
speed of 160 km/h as derived from the analysis of Lothar in Germany.
This extrapolation method is applied to the three examined parameters: loss
ratio, loss frequency, and average loss. It assumes that the observed insurance
portfolios do not reveal any “discontinuities” in loss behaviour even at higher
wind speeds. In particular, it is assumed that up to the extrapolation limits, i.e.
the maximum wind speeds expected in the light of meteorological considera-
tions, there is no saturation of the loss parameters. This would be conceivable,
for instance, in the case of the loss frequency if, given the wind speeds
observed in 1999, nearly all the policies with windstorm cover had already been
subject to losses, i.e. the loss frequency had been close on 100%. The above
extrapolation would also be questionable if, given the high intensities of Anatol,
Lothar, and Martin, there had been any fundamental changes in the “loss pat-
tern” of European winter storms such as, for example, a significant increase in
structural damage to buildings, which would have led to the loss ratios and
average losses soaring. However, no such changes were observed.
The influence of other windstorm characteristics like duration, gustiness, or pre-
cipitation volume on the vulnerability of insurance portfolios was not examined
in this study, because it is not possible to draw sufficiently qualified conclusions
on this aspect using the meteorological data available.
LR(190) = LR(160)
190
160
= 1.2 ‰*
4
* 1.99 = 2.4 ‰ (rounded),
33. 30
Munich Re Winter storms in Europe (II)Loss profiles
3.2 Loss profiles
The analysis of loss profiles (distributions of loss amounts) makes it possible,
among other things, to estimate the effects of deductibles on the number of
individual losses that need to be adjusted and the overall insured loss. The fol-
lowing graphs show, by way of example, loss profiles for homeowners risks
resulting from Lothar in Germany as the average derived from a number of
portfolios. Any deductibles that may have been applied in isolated cases are
considered in the diagrams. For France and Denmark we mainly had aggregated
loss reports, whose representation as a loss profile is not worthwhile.
Typical loss profile of homeowners
insurance in Germany from Lothar.
Distribution of loss amounts by size ranges
Percentageofoverallloss
40
30
20
10
0
< 0.25 0.25–0.5 0.5–1 1–2.5 2.5–5 5–25 25–50
in € 000
in € 000
Distribution of loss numbers by size ranges
Percentageofoverallloss
40
30
20
10
0
< 0.25 0.25–0.5 0.5–1 1–2.5 2.5–5 5–25 25–50
34. 31
Munich Re Winter storms in Europe (II) Loss profiles
The decrease in the number of losses that insurers need to indemnify after a
windstorm catastrophe with deductibles of €500, €1,000, etc. may be clearly
seen in the graphs of loss profiles on the previous page.
To estimate the influence on the overall loss it is necessary to consider the loss
elimination effect of deductibles as well, which is also observed in the higher
loss amount brackets.
The formula for this is:
with
MED = minimizing effect of deductibles (as a percentage of the overall loss
not considering deductibles)
DA = deductible amount
A = average loss amount
P(DA) = proportion of losses ≤DA of the total amount of all losses
B(DA) = proportion of losses ≤DA of the total number of all losses
For the example of homeowners insurance in Germany (cf. the graphs on page
30), the following loss elimination effect on the overall loss is derived assuming
an average loss amount from Lothar of A =€1,300 for a deductible of €500:
DA = 500 (€)
A = 1,300 (€)
P(DA) = 0.12
B(DA) = 0.51
MED(DA) = P(DA)+ (1–B(DA))
DA
A
*
MED(DA) = 0.12+(1–0.51)
500
1,300
* = 31%
35. 32
Munich Re Winter storms in Europe (II)Loss profiles
On the basis of fixed deductibles of 1‰ and 2‰ of the SI, Graph a shows – again
for homeowners insurance in Germany – the calculated loss reduction as a func-
tion of the average loss ratio, i.e. the intensity of the windstorm. By analogy, it is
also possible to show the effect that deductibles of differing amounts have on a
certain loss ratio (Graph b).
Graph a:
Loss elimination by means of
deductibles.
The (theoretical/calculated) loss elim-
ination effect may be seen on the
y axis for windstorm events with aver-
age loss ratios of up to 10‰ of the SI
on the basis of deductibles of 1‰ and
2‰ of the SI.
Graph b:
Loss elimination by means of
deductibles.
In contrast to Graph a, the (theoretic-
al/calculated) loss elimination effect
may be seen directly on the y axis for
windstorm events with average loss
ratios of 1‰ and 2‰ of the SI on the
basis of deductibles of up to 10‰ of
the SI.
Loss elimination as a function of the deductible
(VGV-Storm, Germany)
Percentagelosselimination
70
60
50
40
30
20
10
0
0 2 4 6 8 10
Deductible as ‰ of SI
Loss elimination as a function of the average loss ratio
(VGV-Storm, Germany)
Percentagelosselimination
Average loss ratio as ‰ of SI
Average loss ratio of 1‰ Average loss ratio of 2‰
Deductible of 1‰ Deductible of 2‰
70
60
50
40
30
20
10
0
0 2 4 6 8 10
36. 33
Munich Re Winter storms in Europe (II) New findings
4 New findings on the
correlation between various
loss parameters and wind speed
In the following section we present the results of our analysis of three loss
parameters (loss ratio, loss frequency, and average loss) from the December
1999 gales and – wherever possible – compare them with our examination of
the losses from the 1990 winter storm series.
The method described in Chapter 3 (analysis of portfolio and loss data on the
1999 winter storms) was used to determine the correlation between loss param-
eters and wind speed by country and class of insurance.
The cross-hatched area of the curves shows the range in the results of the
analysed companies. In some cases, there are considerable differences in the
vulnerability of the portfolios (in identical classes); these are mainly due to the
following factors:
– Deductibles: The typical range of deductibles in European windstorm covers
goes from 0 (no deductible) to about 1‰ of the sum insured (and rarely
higher). Note: The deductible is often stated in monetary units, e.g. €300; it
may be converted into a permillage of the sum insured.
– Underwriting guidelines: Depending on the company's own underwriting cri-
teria, the overall composition of a portfolio in terms of the windstorm risk may
be altogether more positive or negative than the market average.
– Adjustment practices: Lothar and Martin alone generated over three million
individual losses. In order to cope with the flood of claims, some insurers
decided they would only make random checks of repair invoices below a cer-
tain amount. Conversely, other companies rigorously called for detailed evi-
dence as to the correctness of the losses reported.
To conclude this examination of the windstorm vulnerability of risks in Europe,
the loss parameters are shown even for the countries that were not or only
slightly affected by Anatol, Lothar, and Martin in 1999. These data are based on
Munich Re's analyses of the 1990 winter storm series (cf. our exposé “Winter
Storms in Europe: Analysis of 1990 Losses and Future Loss Potentials”).
37. 34
Munich Re Winter storms in Europe (II)New findings
Wind speed (km/h)
Austria
Loss parameters as a function of wind
speed.
Loss ratio Eigenheim-, Gebäudeversicherung
(≈ homeowners)
Loss frequency Eigenheim-, Gebäudeversicherung
(≈ homeowners)
Lossratio(‰)Lossfrequency(%)
Average loss/affected policy Eigenheim-, Gebäudeversicherung
(≈ homeowners)
Averageloss(€) 2
1
0
40
30
20
10
0
1,500
1,000
500
0
80 100 120 140 160 180 200
Wind speed (km/h)
80 100 120 140 160 180 200
Wind speed (km/h)
80 100 120 140 160 180 200
1990
1990
1990
38. 35
Munich Re Winter storms in Europe (II) New findings
Austria
Loss parameters as a function of wind
speed.
Loss ratio Haushalt
(≈ household)
Loss frequency Haushalt
(≈ household)
Lossratio(‰)Lossfrequency(%)
Average loss/affected policy Haushalt
(≈ household)
Averageloss(€)
1.5
1.0
0.5
0
40
30
20
10
0
1,500
1,000
500
0
80 100 120 140 160 180 200
Wind speed (km/h)
80 100 120 140 160 180 200
Wind speed (km/h)
80 100 120 140 160 180 200
Wind speed (km/h)
1990
1990
1990
39. 36
Munich Re Winter storms in Europe (II)New findings
Belgium
Loss parameters as a function of wind
speed.
Loss ratio Risques simples
(≈ homeowners)
Loss frequency Risques simples
(≈ homeowners)
Lossratio(‰)Lossfrequency(%)
Average loss/affected policy Risques simples
(≈ homeowners)
Averageloss(€) 10
8
6
4
2
0
60
40
20
0
2,000
1,500
1,000
500
0
80 100 120 140 160 180 200
Wind speed (km/h)
80 100 120 140 160 180 200
Wind speed (km/h)
80 100 120 140 160 180 200
Wind speed (km/h)
1990
1990
1990
40. 37
Munich Re Winter storms in Europe (II) New findings
Belgium
Loss parameters as a function of wind
speed.
Loss ratio Risques agricoles
(≈ agriculture)
Loss frequency Risques agricoles
(≈ agriculture)
Lossratio(‰)Lossfrequency(%)
Average loss/affected policy Risques agricoles
(≈ agriculture)
Averageloss(€)
10
8
6
4
2
0
60
40
20
0
2,000
1,500
1,000
500
0
80 100 120 140 160 180 200
Wind speed (km/h)
80 100 120 140 160 180 200
Wind speed (km/h)
80 100 120 140 160 180 200
Wind speed (km/h)
1990
1990
1990
41. 38
Munich Re Winter storms in Europe (II)New findings
Loss ratio Residential buildings
Loss frequency Residential buildings
Lossratio(‰)Lossfrequency(%)
Average loss/affected policy Residential buildings
Averageloss(€) 12
8
4
0
80
60
40
20
0
3,000
2,000
1,000
0
80 100 120 140 160 180 200
80 100 120 140 160 180 200
80 100 120 140 160 180 200
Wind speed (km/h)1999
Wind speed (km/h)1999
Wind speed (km/h)1999
Denmark
Loss parameters as a function of wind
speed.
42. 39
Munich Re Winter storms in Europe (II) New findings
Denmark
Loss parameters as a function of wind
speed.
Loss ratio Residential contents
Loss frequency Residential contents
Lossratio(‰)Lossfrequency(%)
Average loss/affected policy Residential contents
Averageloss(€)
1.0
0.8
0.6
0.4
0.2
0
12
9
6
3
0
3,000
2,000
1,000
0
80 100 120 140 160 180 200
80 100 120 140 160 180 200
80 100 120 140 160 180 200
Wind speed (km/h)1999
Wind speed (km/h)1999
Wind speed (km/h)1999
43. 40
Munich Re Winter storms in Europe (II)New findings
Denmark
Loss parameters as a function of wind
speed.
Loss ratio Commercial/industrial buildings/contents
Loss frequency Commercial/industrial buildings/contents
Lossratio(‰)Lossfrequency(%)
Average loss/affected policy Commercial/industrial buildings/contents
15
12
9
6
3
0
80
60
40
20
0
20,000
16,000
12,000
8,000
4,000
0
80 100 120 140 160 180 200
80 100 120 140 160 180 200
80 100 120 140 160 180 200
Wind speed (km/h)1999
Wind speed (km/h)1999
Wind speed (km/h)1999
Averageloss(€)
44. 41
Munich Re Winter storms in Europe (II) New findings
Denmark
Loss parameters as a function of wind
speed.
Loss ratio Agricultural buildings/contents
Loss frequency Agricultural buildings/contents
Lossratio(‰)Lossfrequency(%)
Average loss/affected policy Agricultural buildings/contents
Averageloss(€)
30
20
10
0
100
80
60
40
20
0
30,000
20,000
10,000
0
80 100 120 140 160 180 200
80 100 120 140 160 180 200
80 100 120 140 160 180 200
Wind speed (km/h)1999
Wind speed (km/h)1999
Wind speed (km/h)1999
45. 42
Munich Re Winter storms in Europe (II)New findings
France
Loss parameters as a function of wind
speed.
Loss ratio Risques simples
(≈ homeowners)
Loss frequency Risques simples
(≈ homeowners)
Lossratio(‰)Lossfrequency(%)
Average loss/affected policy Risques simples
(≈ homeowners)
Averageloss(€) 2.5
2.0
1.5
1.0
0.5
0
40
30
20
10
0
5,000
4,000
3,000
2,000
1,000
0
80 100 120 140 160 180 200
Wind speed (km/h)
80 100 120 140 160 180 200
Wind speed (km/h)
80 100 120 140 160 180 200
Wind speed (km/h)
1990
1999
1990
1999
1990
1999
46. 43
Munich Re Winter storms in Europe (II) New findings
France
Loss parameters as a function of wind
speed.
Loss ratio Risques commerciaux
(≈ commercial)
Loss frequency Risques commerciaux
(≈ commercial)
Lossratio(‰)Lossfrequency(%)
Average loss/affected policy Risques commerciaux
(≈ commercial)
Averageloss(€)
3
2
1
0
30
20
10
0
20,000
15,000
10,000
5,000
0
80 100 120 140 160 180 200
Wind speed (km/h)
80 100 120 140 160 180 200
Wind speed (km/h)
80 100 120 140 160 180 200
Wind speed (km/h)
1999
1999
1999
47. 44
Munich Re Winter storms in Europe (II)New findings
France
Loss parameters as a function of wind
speed.
Loss ratio Risques agricoles
(≈ agriculture)
Loss frequency Risques agricoles
(≈ agriculture)
Lossratio(‰)Lossfrequency(%)
Average loss/affected policy Risques agricoles
(≈ agriculture)
Averageloss(€) 12
8
4
0
80
60
40
20
0
15,000
10,000
5,000
0
80 100 120 140 160 180 200
Wind speed (km/h)
80 100 120 140 160 180 200
Wind speed (km/h)
80 100 120 140 160 180 200
Wind speed (km/h)
1990
1999
1990
1999
1990
1999
48. 45
Munich Re Winter storms in Europe (II) New findings
Germany
Loss parameters as a function of wind
speed.
Loss frequency Verbundene Wohngebäude-Versicherung
(≈ homeowners)
Average loss/affected policy Verbundene Wohngebäude-Versicherung
(≈ homeowners)
Lossfrequency(%)Averageloss(€)
Loss ratio Verbundene Wohngebäude-Versicherung
(≈ homeowners)
Lossratio(‰)
80
60
40
20
0
4,000
3,000
2,000
1,000
0
3
2
1
0
80 100 120 140 160 180 200
80 100 120 140 160 180 200
80 100 120 140 160 180 200
Wind speed (km/h)
1990
1999
Wind speed (km/h)
Wind speed (km/h)
1990
1999
1990
1999
49. 46
Munich Re Winter storms in Europe (II)New findings
Germany
Loss parameters as a function of wind
speed.
Loss frequency Verbundene Hausratversicherung
(≈ household)
Average loss/affected policy Verbundene Hausratversicherung
(≈ household)
Lossfrequency(%)Averageloss(€)
Loss ratio Verbundene Hausratversicherung
(≈ household)
Lossratio(‰)
10
8
6
4
2
0
2,000
1,500
1,000
500
0
1.0
0.8
0.6
0.4
0.2
0
80 100 120 140 160 180 200
80 100 120 140 160 180 200
80 100 120 140 160 180 200
Wind speed (km/h)
Wind speed (km/h)
Wind speed (km/h)
1990
1999
1990
1999
1990
1999
50. 47
Munich Re Winter storms in Europe (II) New findings
Germany
Loss parameters as a function of wind
speed.
Loss frequency Allgemeine Sturmbedingungen, Gewerbe
(≈ commercial)
Average loss/affected policy Allgemeine Sturmbedingungen, Gewerbe
(≈ commercial)
Lossfrequency(%)Averageloss(€)
Loss ratio Allgemeine Sturmbedingungen, Gewerbe
(≈ commercial)
Lossratio(‰)
60
40
20
0
15,000
10,000
5,000
0
6
4
2
0
80 100 120 140 160 180 200
80 100 120 140 160 180 200
80 100 120 140 160 180 200
Wind speed (km/h)
Wind speed (km/h)
Wind speed (km/h)
1990
1999
1990
1999
1990
1999
Risques commerciaux
(≈ commercial)
51. 48
Munich Re Winter storms in Europe (II)New findings
Great Britain
Loss parameters as a function of wind
speed.
Loss ratio Homeowners or household insurance
Loss frequency Homeowners or household insurance
Lossratio(‰)Lossfrequency(%)
Average loss/affected policy Homeowners or household insurance
Averageloss(€) 5
4
3
2
1
0
60
40
20
0
1,500
1,000
500
0
80 100 120 140 160 180 200
Wind speed (km/h)
80 100 120 140 160 180 200
Wind speed (km/h)
80 100 120 140 160 180 200
Wind speed (km/h)
1990
1990
1990
52. 49
Munich Re Winter storms in Europe (II) New findings
Netherlands
Loss parameters as a function of wind
speed.
Loss frequency Particulieren
(≈ homeowners)
Lossfrequency(%)
Average loss/affected policy Particulieren
(≈ homeowners)
Averageloss(€)
30
20
10
0
12,000
8,000
4,000
0
80 100 120 140 160 180 200
Wind speed (km/h)
80 100 120 140 160 180 200
Wind speed (km/h)
1990
1990
Loss ratio Particulieren
(≈ homeowners)
Lossratio(‰) 10
8
6
4
2
0
80 100 120 140 160 180 200
Wind speed (km/h)
1990
53. 50
Munich Re Winter storms in Europe (II)New findings
Netherlands
Loss parameters as a function of wind
speed.
Loss ratio Commerciele
(≈ commercial)
Loss frequency Commerciele
(≈ commercial)
Lossratio(‰)Lossfrequency(%)
Average loss/affected policy Commerciele
(≈ commercial)
Averageloss(€) 10
8
6
4
2
0
30
20
10
0
12,000
8,000
4,000
0
80 100 120 140 160 180 200
Wind speed (km/h)
80 100 120 140 160 180 200
Wind speed (km/h)
80 100 120 140 160 180 200
Wind speed (km/h)
1990
1990
1990
54. 51
Munich Re Winter storms in Europe (II) New findings
Netherlands
Loss parameters as a function of wind
speed.
Loss ratio Agrarisch
(≈ agriculture)
Loss frequency Agrarisch
(≈ agriculture)
Lossratio(‰)Lossfrequency(%)
Average loss/affected policy Agrarisch
(≈ agriculture)
Averageloss(€)
10
8
6
4
2
0
30
20
10
0
12,000
8,000
4,000
0
80 100 120 140 160 180 200
Wind speed (km/h)
80 100 120 140 160 180 200
Wind speed (km/h)
80 100 120 140 160 180 200
Wind speed (km/h)
1990
1990
1990
55. New findings on windstorm vulnerability in Europe
Windstorm vulnerability in Europe – comparison of 1999 data with experience in 1990
Loss ratio
Directly comparable data for 1990 only
partially available; 1999 loss ratios for
residential buildings and commercial
risks (in some cases much) higher than
in the other countries in the 1990 and
1999 analyses; increase in loss ratios
with the wind speed around the expo-
nent of 4 to 5.
The lack of direct information on sums
insured restricts the possibility of com-
paring 1999 and 1990; the 1990 loss
experience tends to be confirmed, but
higher loss ratios observed in 1999 at
high wind speeds.
Very good comparable data for 1990
losses available; main new finding
from Lothar: at high wind speeds loss
ratios rise more steeply than extrapo-
lated on the basis of 1990 data.
Loss frequency
In all risk classes comparable with the
1990 experience in other European
countries.
At average wind speeds comparable
with the 1990 loss experience; at high
wind speeds considerably higher loss
frequencies than extrapolated using
the 1990 data.
For homeowners comparable with the
1990 loss experience; for household
and commercial risks lower than 1990.
Average loss
Average losses within the expected
range.
Average losses considerably higher
than in 1990, but within the expected
range.
Average losses considerably higher
than in 1990, but within the expected
range.
Denmark
France
Germany
52
Munich Re Winter storms in Europe (II)New findings
56. 53
Munich Re Winter storms in Europe (II) Windstorm loss potentials in Europe – accumulation aspects
5 Windstorm loss potentials in
Europe – accumulation aspects
5.1 Preliminary considerations
Anatol, Lothar, and Martin provided (further) evidence that losses from winter
storms in Europe are capable of assuming the dimensions of major catas-
trophes for the insurance industry and that many market players were still too
optimistic in their assessment of the loss potential from such windstorms –
which is particularly remarkable given the fact that only a few years had passed
since the 1990 gales.
What data are required for a sound assessment of the windstorm risk in
Europe?
Generally speaking, risk analyses of natural hazards may always be traced to
the following point of reference:
“Risk” is defined as the (exceedance) probability of loss amounts.
The decisive factor for estimating loss probabilities (return periods) is an opti-
mum knowledge of the three parameters that determine the risk: hazard,
exposure, and vulnerability.
Hazard Exposure
Risk
Vulnerability
57. 54
Munich Re Winter storms in Europe (II)Preliminary considerations
Hazard
The windstorm hazard at any specific location may be described with the aid of
the probability of certain wind speeds. Using meteorological data from the past,
statistical methods are applied to estimate the return period of windstorm inten-
sities (wind speeds) at individual weather stations. In addition to the quality of
the historical recordings, the factors that are of major significance when deter-
mining the windstorm hazard are the chosen statistical extrapolation method
and the consideration of possible changes in the wind climate. The risk analysis
of geographically dispersed portfolios requires a wider definition of hazard. In
addition to estimating the wind speed probabilities at individual meteorological
stations, it is necessary to examine the spatial and temporal correlation of
higher wind speeds from the same event at several locations (determination of
wind fields).
Exposure
Since the hazard is usually a parameter of differing spatial dimensions and the
vulnerability depends on the type of risk involved (see below), a windstorm-risk
analysis requires exposures divided up geographically and by risk class (simpli-
fied: class of insurance). The CRESTA system provides a structure that is suit-
able for nearly all European countries (cf. http://www.CRESTA.org).
Vulnerability
Because of the predominantly massive construction of buildings in Europe,
structural damage is usually the exception even when wind speeds are high.
The main types of loss involve damage to the outside shell of the buildings,
i.e. roofs, façades, and windows. In recent years there has also been a more
pronounced trend towards buildings with outside attachments (pergolas,
awnings, satellite antennae), which are potentially more prone to being dam-
aged at high wind speeds than the buildings themselves.
The other main factors connected with windstorm losses are
– the design features and the state of repair of roofs,
– the design features of windows,
– the height, type, and health of trees in the vicinity of buildings,
– the early warning of the population and subsequent precautions (e.g. closing
of windows and doors), and,
– in the event of insured losses, the insurers' adjustment practice.
These factors show that windstorm vulnerability is a dynamic parameter which
can change in the course of time and therefore needs to be adjusted constantly
in accumulation studies (cf. “New findings on windstorm vulnerability in
Europe” on page 52 and the Munich Re exposé “Winter Storms in Europe:
Analysis of 1990 Losses and Future Loss Potentials”).
58. 55
Munich Re Winter storms in Europe (II) Occurrence probability of windstorm market losses
The significance of major historical windstorm events in Europe is demon-
strated vividly in the table on page 56.
For selected countries the historical windstorm losses of recent decades were
extrapolated to the price levels of 2001, and a loading was estimated for the
change in the wind climate expected as a result of the increasing effect of global
warming. On this basis it was possible to produce loss frequency statistics on a
country-by-country basis. These statistics formed the basis for the occurrence
probabilities shown in the table below.
The data on historical losses used as a basis for this table should in no way be
regarded as complete. The calculated occurrence probabilities must therefore
be interpreted as rough approximations which are ridden with uncertainties. It
should also be noted that a change in the underlying exposure distribution
would lead to different results.
5.2 Occurrence probability of
windstorm market losses
Europe*
<1
1
3–5
8–12
20–30
Netherlands*
8–12
15–20
50–80
>100
Great
Britain*
2–4
8–12
15–20
20–40
70–90
Germany*
3–6
8–12
20–40
70–90
Denmark*
8–12
20–40
80–100
France*
8–12
12–15
30–50
60–80
Belgium*
15–20
40–60
>150
Occurrence probabilities of market losses
*Return periods in years
Source: Munich Re, Geo Risks Research Department.
Windstorm
market loss in €bn
0.5
1.0
2.5
5.0
10.0
59. 56
Munich Re Winter storms in Europe (II)Occurrence probability of windstorm market losses
Some major historical windstorm events in Europe
Country Date Event, area Fatalities Overall loss
in €m
Austria 1990, January-March Winter storms 3 200
Belgium 1990, January-March Winter storms 15 870
Denmark 1981, 24th/25th November Gale 9 280
1990, January-March Winter storms 160
1999, 3rd/4th December Winter storm Anatol 7 2,600
France 1967, 25th June Tornados, north 40
1982, 6th-9th November Gale 14 430
1987, 15th/16th October Gale “87J”, northwest 4 1,400
1990, January-March Winter storms 66 1,650
1998, 1st-5th January Winter storms 140
1999, December Winter storms 92 12,000
Germany 1164, February Storm surge: Julianenflut 20,000
1219, January Storm surge, North sea 36,000
1287, December Storm surge, North sea 50,000
1362, January Storm surge, Große Manndränke 100,000
1532, November Storm surge, Nordstrand/Eiderstedt 5,000
1570, November Storm surge, North Sea 9,000
1625, February Storm surge, Baltic Sea 9,100
1634, October Storm surge, North Sea 8,400
1717, December Storm surge, North Sea 11,500
1825, February Storm surge, North Sea 800 20
1962, February Storm surge, North Sea 347 1,200
1967, February Gale, North Sea 40 600
1968, 10th July Tornado, Pforzheim 2 60
1972, 12th/13th November Lower Saxony gale 54 700
1976, 2nd–4th January Capella gale 27 450
1990, January–March Winter storms 64 3,800
1994, 27th January Winter storm Lore 6 360
1998, 27th–29th October Winter storm Xylia 5 130
1999, December Winter storms 18 1,800
2001, 3rd August Severe storm 1 750
Great Britain 1588, 21st September Gale (Sinking of the Spanish Armada) 20,000
1703, 6th/7th December Gale, south 8,125
1976, 2nd–4th January Capella gale 24 200
1987, 15th/16th October Gale 87J, south 13 1,600
1990, January–March Winter storms 85 4,100
1991, 5th/6th January Winter storm Undine 30 700
1997, 23rd–25th December Winter storm Yuma 7 230
1998, 1st–5th January Winter storms 15 470
1998, 24th October Winter storm Winnie 3 250
1998, 26th/27th December Winter storm Silke 5 170
Italy 1973, 26th October Gale, Palermo 170
2001, 17th/18th July Severe storm, tornado 200
Luxembourg 1990, January–March Winter storms 300
Netherlands 1281, January Storm surge, Zuidersee 80,000
1421, November Storm surge 100,000
1953, January/February Storm surge 1,932 6,450
1990, January–March Winter storms 21 1,500
Poland 1928, 6th July Tornado, Warsaw 82
Switzerland 1990, January-March Winter storms 4 160
1999, 26th December Winter storm Lothar 12 1,500
Europe 1976, 2nd–4th January Capella gale 82 1,600
1987, 15th/16th October Gale 87J 17 3,000
1990, January–March Winter storms 272 12,800
1999, December Winter storms >150 18,500
As at November 2001. Hail events are not included. Loss figures in original values, converted into €.
Source: Munich Re NatCatSERVICE.
60. 57
Munich Re Winter storms in Europe (II) Methods of estimating market loss potentials
5.3 Methods of estimating
market loss potentials
Looking back into the meteorological past is one of the main bases for defining
windstorm scenarios for the purpose of estimating accumulation losses in
Europe. This information is not complete, however, and does not permit any
conclusions as to the effect of changing climatic conditions on the windstorm
hazard in the future. In this study we adopted two approaches in order to esti-
mate market windstorm accumulation potentials and their probabilities in indi-
vidual countries and for Europe as a whole:
1. We carried out a statistical analysis of historical windstorm losses and
2. evaluated past meteorological data and extrapolated wind fields (wind
speeds, geographical size) assuming a medium-term and long-term change in
the windstorm hazard in Europe on the basis of new climatological models.
ad 1. Distributions of loss amounts
In principle all continuous distributions may be used for this. In the case of
frequent but minor losses, exponential distributions have proven to be a
suitable means of representing loss amount distributions. In the case of expo-
nential distributions, however, the probabilities given to medium and relatively
large losses tend to be too low and consequently the return periods are too
long. Better estimates of rare large loss events are produced by the so-called
Burr distribution or – as a special form – a generalized Pareto distribution.
The Burr distribution has the following distribution function:
The resulting density function is as follows:
f(x)
x
x
x0
+
=
+1
1
F(x) = 1-
x
x0
x
x0
+
-
1 für x >0, >0, >0, >0x0
für x >0, >0, >0, >0x0
61. 58
Munich Re Winter storms in Europe (II)Methods of estimating market loss potentials
A Pareto distribution is a Burr distribution using π=1 and x-x0 instead of x.
Before adjusting, threshold values must be chosen to be the upper and lower
limits of the adjustment. The maximum value of the distribution is defined by
the highest simulated market loss from the selected windstorm scenarios.
ad 2. Wind fields and windstorm scenarios
The wind fields of historical windstorms over Europe have not been recorded
systematically or analysed by meteorological research institutes or meteoro-
logical services. Since the wind speed data from many weather stations is
based on relatively short time series (mostly only for the past 30–50 years), the
reconstruction of earlier windstorms requires the synopsis of data from other
sources including recordings of atmospheric pressure and reports on the dam-
age caused. On account of the many different processing steps that need to be
taken before the production of the wind fields, the results of these reconstruc-
tions always bear the individual handwriting of the respective scientists (or
groups of scientists). The development of Munich Re's Europe windstorm
model is based on the following method being applied in the definition of wind-
storm scenarios:
– the analysis of historical wind speeds at up to 1,400 meteorological stations in
Europe,
– the analysis of studies on windstorm catastrophes of recent centuries, and
– the extrapolation of the future windstorm hazard on the basis of historical data
assuming a medium-term and long-term change in the wind climate as a
result of global warming.
62. 59
Munich Re Winter storms in Europe (II) Methods of estimating market loss potentials
Potential increase in the windstorm hazard in Europe and possible effects on
loss potentials
It is not yet possible to carry out a scientifically sound quantification of the
expected increase in severe wind events over Europe using climatalogical
models (cf. Special topic 2: “Climate change – Is the windstorm risk changing
too?”). We therefore had to find an approach of our own that reflects our own
loss experience. This involved
– adjusting our wind field scenarios based on empirical data by means of a
loading on the highest expected wind speeds, which leads to higher
simulated maximum losses and hence to higher threshold values in the
adjustment, and
– modifying the average annual frequency of loss events (loss frequency)
based on observations of the past.
The following graph shows the effects of the changed adjustment parameters
on a selected PML curve. The maximum wind speed was raised by 10% and the
loss frequency by 50%.
Standard distribution of loss amounts
Distribution of loss amounts assuming increased maximum wind speeds (+10%) and
loss frequency (+50%)
Lossasa‰oftheSI
PML curve
Return period in years
63. 60
Munich Re Winter storms in Europe (II)Windstorm scenarios
5.4 Windstorm scenarios –
Examples of wind fields with
a loss return period of 100 years
Based on the market loss estimates (cf. table on page 55) and the analysis of
historical wind fields of recent decades in these countries, windstorm scenarios
with various occurrence probabilities were developed for each of the stated
regions.
The wind field scenarios determined in this way may serve as an indication for
considering the aspect of accumulation. A single countrywide windstorm
scenario can never represent a maximum event for all possible geographical
exposure distributions. A windstorm scenario conceived for a whole country
may, given unfavourable circumstances, fail to estimate the maximum loss for
a portfolio with a regional bias. A company writing business throughout a
country should, on the other hand, be able to use a countrywide scenario to
calculate the possible loss accumulation.
In the following a selected windstorm scenario is shown per region for a return
period of approx. 100 years.
It should be noted that the loss events on which this is based are derived from a
relatively narrow time window. The derived occurrence probabilities of wind
field scenarios can therefore only provide a rough approximation of the loss to
be expected.
The “Super Daria” scenario is based on the analysis of historical wind fields
over Europe. Its track is modelled on that of Daria. The wind field determined
for the “Super Daria” scenario should produce an accumulation loss of the
stated return period for an insurer writing business throughout Europe. For an
insurer whose activities are limited to a single country, however, the wind field
scenario may under certain circumstances not be suitable for accumulation
estimates.
64. 61
Munich Re Winter storms in Europe (II) Windstorm scenarios
“Super Daria” gale
The wind field of a possible gale
scenario.
80 90 100 110 120 130 140 150 160 170 180 190 200
Wind speed (km/h)
Source: Munich Re
65. 62
Munich Re Winter storms in Europe (II)Windstorm scenarios
Windstorm scenario for Austria
with a return period of 100 years.
Windstorm scenario for Belgium
with a return period of 100 years.
80 90 100 110 120 130 140 150 160 170 180 190 200
Wind speed (km/h)
Source: Munich Re
Source: Munich Re
66. 63
Munich Re Winter storms in Europe (II) Windstorm scenarios
Windstorm scenario for Denmark
with a return period of 100 years.
Windstorm scenario for France
with a return period of 100 years.
%
80 90 100 110 120 130 140 150 160 170 180 190 200
Wind speed (km/h)
Source: Munich Re.
Source: Munich Re.
67. 64
Munich Re Winter storms in Europe (II)Windstorm scenarios
Windstorm scenario for Germany
with a return period of 100 years.
Windstorm scenario for
the Netherlands
with a return period of 100 years.
80 90 100 110 120 130 140 150 160 170 180 190 200
Wind speed (km/h)
Source: Munich Re.
Source: Munich Re.
68. 65
Munich Re Winter storms in Europe (II) Windstorm scenarios
Windstorm scenario for
the United Kingdom
with a return period of 100 years.
80 90 100 110 120 130 140 150 160 170 180 190 200
Wind speed (km/h)
Source: Munich Re.
69. 66
Munich Re Winter storms in Europe (II)Special topic 1: The frequency of windstorms in Europe
Special topic 1: The frequency of
windstorms in Europe
Unlike the strength of earthquakes (release of energy), which may be defined
using a single physical parameter (magnitude), the “strength” of winter storms
can only be defined using auxiliary parameters like maximum (local) wind
speeds, central pressure, windstorm duration, and the geographical expanse of
the storm field. As the recording of these parameters in the past has been
incomplete and of very irregular quality, the informational value of nearly every
time series of windstorms in Europe is limited.
The fact that these analyses are limited to known historical extreme events
also means that, when estimating the return periods of severe windstorms,
there are uncertainties in the results due to the lack of a definition of such
events – and hence to the question of how complete the corresponding wind-
storm catalogues really are.
Individual events like Anatol, Lothar, and Martin do not allow any conclusions
to be drawn as to the future frequency and expanse of heavy gales in Europe
either, even if record wind speeds are measured.
Computer climate models still produce rather inconsistent simulation results in
the forecasting of complex extreme events like winter storms. The results of
more recent calculations increasingly point to a rise in the frequency of strong
low-pressure systems in central Europe (see also Special topic 2: “Climate
change – Is the windstorm risk changing too?”).
Number of days with winds of at least Beaufort 8 in Nuremberg and Düsseldorf
1969–1999
50
40
30
20
10
0
Nuremberg Düsseldorf
Nuremberg trend Düsseldorf trend
Source: Deutscher Wetterdienst, 2000.
Days
1969
1971
1973
1975
1977
1979
1981
1983
1985
1987
1989
1991
1993
1995
1997
1999
70. 67
Munich Re Winter storms in Europe (II) Special topic 1: The frequency of windstorms in Europe
Conclusion:
The above graphs suggest that there has been an unfavourable change in the
wind climate in past decades and centuries – at least in parts of Europe.
As explained at the beginning, these time series are to be observed critically.
They do not present an unconditionally verified basis for the extrapolation of
the frequencies and intensities of winter storms to be expected in the future.
But even if it is not yet possible to make quantitative statements on the develop-
ment of windstorm activity, there are mounting indications of an increasing
windstorm hazard in Europe. If risk carriers act responsibly, they will take these
indications seriously and account for them in their considerations.
Frequency of heavy and extreme winter storms in Switzerland
1500–1999
Development of intense lows (<950 hPa) over the North Atlantic and Europe
1956/57–2000/01
Number
20
16
12
8
4
0
Source: Deutscher Wetterdienst, 2001.
unverified storms heavy storms extreme storms (Varying bar heights for better differentiation)
Source: Pfister, 1999; amended from WSL, 2001.
1500
1550
1600
1650
1700
1750
1800
1850
1900
1950
1999
1956/57
1960/61
1964/65
1968/69
1972/73
1976/77
1980/81
1984/85
1988/89
1992/93
1996/97
2000/01
71. 68
Munich Re Winter storms in Europe (II)Special topic 2: Climate change – Is the windstorm risk changing too?
Special topic 2: Climate change –
Is the windstorm risk changing
too?
The effects of climate change on windstorm events in Europe are a matter of
controversial discussion, even on scientific committees. Even with the computer
models used today, climate modellers and meteorologists are still unable to
deliver reliable quantitative estimates, as the birth and course of windstorms
are extremely complex, dynamic processes in both spatial and temporal terms.
Scientific studies focussing on the effects of climate change in Europe are there-
fore usually very cautious in what they say. An example of this is given by the
EU's comprehensive ACACIA report (“Assessment of Potential Effects and
Adaptations for Climate Change in Europe”, Brussels 2000). An increase in
windstorm frequency is not considered proven but is held to be “possible”. The
general increase in precipitation volumes in the winter half-year, on the other
hand, is deemed scientifically proven. Individual winter storms will conse-
quently be “moister”, i.e. rainier, a fact that will influence windstorm losses as a
whole and have a significant effect on individual losses.
But even if scientific proof is still lacking in terms of the windstorm risk, we
must – in line with the precautionary principle – expect the situation in central
Europe to get worse, which means that the frequency and intensity of both
winter storms and local windstorms will increase.
In 2001 the Intergovernmental Panel on Climate Change (IPCC), the international
team of climatologists set up the United Nations, published its third status
report. It predicts that the mean global temperature will increase between 1.4°C
and 5.8°C by the end of this century.
As far as windstorm activity is concerned, the following effects are probable:
– The degree of warming in each region of the earth will vary, which means that
some regions will be significantly hotter, some will change slightly, and some
will even cool down. This will inevitably affect pressure relationships and
dynamics in the atmosphere. If the temperature and pressure gradients
between the moderate and polar regions increase, the circulation in the
atmosphere must be expected to accelerate and there will be an intensification
of windstorms. Basically speaking, the greenhouse effect is increasing the
input of energy into the global atmospheric “heat engine”, which will “shift
into top gear” as a result.
– In cold winters with large amounts of snow a cold and rigid mass of air forms
over central and eastern parts of Europe. Meteorologists speak of a “blocking”
high-pressure system, as this air mass blocks west-to-east streams. Conse-
quently the low-pressure vortices coming in from the North Atlantic are gen-
erally diverted north or south before they reach western and central parts of
Europe. However, in the milder winters that are to be expected – according to
ACACIA the number of so-called “cold winters” (the coldest of ten winters in
the climate period from 1961 to 1990) will gradually decrease in the period up
to 2020 – this cold high-pressure system will become weaker on account of the
lack of snow cover. Fewer winter storms will therefore be forced to veer
towards Scandinavia or into the Mediterranean region. They will be able to
72. 69
Munich Re Winter storms in Europe (II) Special topic 2: Climate change – Is the windstorm risk changing too?
penetrate deeper into the continent and hence hit the countries in central
Europe harder. Recent climate models support the supposition that the areas
with the highest windstorm activity over the North Atlantic will gradually shift
eastwards, which means closer to the west coast of Europe.
– Global warming leads to an intensification of convection processes in the
atmosphere. Also, the number of lightning strokes increases steeply in a
warmer atmosphere, a phenomenon with which we are familiar in the Tropics,
for instance. Our investigations in Germany show that the number of lightning
strokes increases exponentially with the temperature of the atmosphere. As a
rule, for example, about 20,000 lightning strokes are registered in months with
an average temperature of 15°C, whereas more than 150,000 strokes must be
expected at an average of 20°C. In a warmer atmosphere, therefore, more fre-
quent and more intensive thunderstorms and severe storms with hailfall are to
be expected.
– In many countries of southern Europe, but also in central parts of Europe, pro-
longed periods of heat and drought must be expected in the summer months.
During or after heat waves, however, it is not unusual for there to be particu-
larly large and devastating storms (e.g. intense precipitation events or storm
and hail fronts) capable of causing losses regionally of several hundred mil-
lion euros, as numerous severe storms in the past years have vividly demon-
strated. Here are just a few selected examples from Austria and Germany in
the period 2000/2001:
• 3rd/4th July 2000 – hailstorm: Austria (Tyrol, Salzburg, Styria); economic
loss: > €100m; insured loss: €90m
• 6th/7th July 2001 – severe storm: Germany (Saarbrücken, Baden-Württem-
berg, Bavaria, Saxony); economic loss: €350m; insured loss: probably >
€200m
• 3rd August 2001 – hailstorm: Germany (Bavaria); economic loss: €750m;
insured loss: probably > €500m.
It would certainly be exaggerating to develop horror scenarios for Europe as a
result of climate change, of which there are now clear signs. On the whole, how-
ever, there is no doubt that in a warmer climate it will be necessary to expect
much more frequent and more intensive windstorm and severe storm events.
73. 70
Munich Re Winter storms in Europe (II)Terminology, abbreviations
Terminology, abbreviations
ACACIA Assessment of Potential Effects and Adaptations for Climate Change in Europe;
study by the European Union on the effects of climate change in Europe
AStB General windstorm insurance terms and conditions for commercial business in
Germany
Average loss Key figure in loss statistics
Calculation: relationship between overall loss and the number of policies
affected by losses (as a function of wind speed)
Beaufort-Scale (12-stage) scale developed by Admiral Beaufort in 1805 for estimating wind
force and wind speed
CRESTA Catastrophe Risks Evaluating and Standardizing Target Accumulations (system
for recording and controlling accumulated exposures)
Deductible The amount of an insured loss carried by the policyholder
DWD Deutscher Wetterdienst (German meteorological service)
IPCC Intergovernmental Panel on Climate Change; set up by the United Nations to
carry out research on global climate change
Loss frequency Key figure in loss statistics
Calculation: relationship between the number of policies/risks affected by losses
and the total number of policies/risks (as a function of wind speed)
Loss ratio Key figure in loss statistics
Calculation: relationship between loss and sum insured (as a function of wind
speed)
PML Probable maximum loss (not the same as “worst case”)
Portfolio All the objects covered by an insurance company (also called “risks”)
SMA MeteoSwiss (Swiss meteorological institute)
SI Sum insured
UTC Universal Time Coordinated (world time, previously Greenwich Mean Time)
VGV Homeowners insurance in Germany
VHV Household insurance in Germany
Vulnerability The susceptibility of a system (structure, facility, state, enterprise, etc.) to dam-
age by outside effects
WSL Swiss Federal Institute for Forest, Snow and Landscape Research
74. 71
Munich Re Winter storms in Europe (II)
Danish Forestry Association (publ.).
Facts on Danish forestry. Frederiksberg, 1998.
Deutscher Wetterdienst (publ.).
Klimastatusbericht 1999. Offenbach, 2000.
Eidgenössische Forschungsanstalt für Wald, Schnee und Landschaft and Bun-
desanstalt für Umwelt, Wald und Landwirtschaft BUWAL (publ.).
Lothar – Der Orkan 1999. Berne, 2001.
Météo-France (publ.).
Le point sur les deux ouragans qui ont traversé la France du 26 au 28 décembre
1999. http://www.meteo.fr/la_une/tempetes.html, as at: 02/2000.
MeteoSwiss.
http://www.MeteoSwiss.ch/de/
Munich Re.
NatCatSERVICE database of natural hazard losses. Munich, 2001.
Munich Re (publ.).
Winter Storms in Europe: Analysis of 1990 Losses and Future Loss Potentials.
Munich, 1993.
Munich Re (publ.).
Windstorm – New Loss Dimensions of a Natural Hazard. Munich, 1990.
Parry, M. L. (publ.).
Assessment of Potential Effects and Adaptations for Climate Change in Europe:
The Europe ACACIA Project. Norwich, UK, 2000.
Pfister, C.
Wetternachhersage – 500 Jahre Klimavariationen und Naturkatastrophen
(1496–1995). Berne, 1999.
Swedish Forest Industries Federation (publ.).
The Swedish Forest Industries 2000 – Facts and figures. Stockholm, 2001.
Ulbrich, U., Fink, A. H., Klawa, M., Pinto, J. G.
Three extreme storms over Europe in December 1999.
In: Weather 2001, 3, pp. 70–80.
Bibliography, sources
Bibliography, sources
75. 72
Munich Re Winter storms in Europe (II)Munich Re publications
Munich Re publications
Munich Re's special section Geo Risks Research has written a large number
of publications on natural hazards. This series is being extended and updated
continually.
M Münchener Rück
Munich Re Group
WELTKARTE | GRUNDLAGENINFORMATION | KATASTROPHENKATALOG
GEO-SPECIALS | GEO-SERVICES | LÄNDERLEXIKON
WORLD MAP | BASIC INFORMATION | CATASTROPHE CATALOGUE
GEO SPECIALS | GEO SERVICES | COUNTRY PROFILE
Welt der Naturgefahren | World of Natural Hazards