2. Norway is Europe’s northern most country located directly west of Sweden and bordering
the North Atlantic Ocean and Northernmost Finland (About Norway History, 2010). In terms of
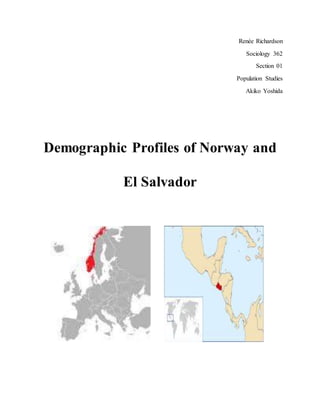
kilometers and miles, the country is slightly bigger than the state of New Mexico. Despite
Norway’s proximity to the Arctic Circle, the North Atlantic Drift brings warm, damp air to the
whole country (Background Note: Norway , 2010). The west coast experiences more
precipitation and mild winters opposed to the North where winters are long, dark, and is cooler.
The country’s rugged coastline stretches for more than 16,000 miles with thousands of islands
and fjords. More inland two thirds of the country is tundra and are covered with mountains.
Norway is well-known for its Viking history where Norse tribes and warriors raided Europe from
the 8th to 11th centuries CE. Norway was ruled by Denmark from 1521 and achieved
independence in 1814. Norway is a unitary parliamentary democracy. Although there is a
monarchy, the king and queen’s role is now largely ceremonial. The title for the head of the
Norwegian government is prime minister. In terms of governmental administration, Norway is
divided into 19 counties and 430 municipalities. The capital city of Oslo is considered a county
and municipality.
Norwegian immigration to the United States was especially prominent during the 19th and
first few decades of the 20th century for reasons of religious and economic concerns, particularly
to the Midwest (Norwegian Americans, 2010). Norway is one of the world’s richest countries in
terms of Gross national income per capita at $54,880 US dollars in 2009 and Gross domestic
product per capita at $79,089 US dollars in 2009 (Data Norway , 2010). The main economic
exports are oil, fish, shipbuilding, machinery, and wood products (Norway Economy and
Industry , 2011). From 2001 to 2007, then also in 2009 and 2010, Norway was ranked with the
highest human development by the United Nations. The population census was first taken in
3. 1769, when the population was 723,618 (Population Statistics Norway, 2010). In 1990, the
population was 4.2 million and the current mid-year population in 2010 was 4,900,000 million
persons. The crude birth rate in 2010 was 13 per 1,000 population and the crude death rate was
9 per 1,000 population. The current rate of natural increase is 0.4 percent. In order for the
population to double it would take 172.5 years (69/0.4=172.5)! The net migration rate was 8 per
1,000 population in 2010.
In terms of the demographic transition, Norway is arguably the most modern nation in the
developed world and enjoys the highest standard of living of any country in the world; this was
catapulted by the discovery of oil in the 1960’s and petroleum is the largest industry in Norway
(Norway Economy and Industry , 2011). Norway’s economy is a combination of a free-market
with substantial government intervention. In 2009 the country was the second largest exporter of
natural gas and the ninth largest exporter of oil in the world. Norway is also Europe’s largest
supplier of fish and fish products. Industry accounts for 40.1 percent of the country’s gross
domestic product; services account for 57.8 percent and agriculture accounts for 2.1 percent of
the remaining GDP. Wealth is more or less evenly distributed and is ranked third in the world
for the lowest level of income inequality in 2008.
Norway had the third highest fertility rates in Europe at 2.0 births per woman in 2010
(Article: New Fertility Rates for Europe, 2009). Life expectancy was the highest in the world in
1970; for men it was 71 years and women it was 77 years (Health Profile: Norway , 2010). Life
expectancy continues to grow and as of 2010 the life expectancy for men was 79 years and for
woman was 83 years. The population is aging but not as quickly as other European countries;
19% of the population is under 15 years, 15% of the population is over the age of 65, and the
median age is 40 years for both sexes. In 1801, 10% of the population lived in cities, 50% of the
4. population was urban in 1950 compared to 80% of the population in 2010. Norway is in the
third stage of the demographic transition theory.
Demographic data for Norway is collected by Statistics Norway, also called the
Norwegian Statistics Bureau, with falls under the Ministry of Finance in the Norwegian
government and is the central Norwegian office for official government statistics (About
Statistics Norway, 2011). It was established in 1876 and census, vital registration and statistics,
and administrative data are collected in this bureau. Data for census is collected from
administrative, statistical registers, and questionnaires. Other population data is collected by the
central population register, which falls under the Office of the National Register. There have
been 22 population censuses since the first was taken in 1769 (Focus On Population, 2010).
In 1960 the life expectancy for males was 71.3 years and 75.9 years for females; this was
the year that Norway had the highest life expectancy in the world (Causes of Death, Statistics
Norway , 2010). In 2010 the life expectancy for males was 79 and 83 for females; by this year
Norway was ranked 13th in the world for longest life expectancy. The longer life expectancy has
increased because of a decrease in death among the oldest aged people. In 1976 there were a
total of 40,216 deaths; 21,925 men and 18,291 women, the death rate was 10.0 per 1,000
population. In 2009 there were a total of 41,342 deaths; 19,864 for men and 21,478 for woman,
and the death rate was 8.5 per 1,000 population. There has been a steady increase in the number
of women in the majority of the dying because there is more woman in higher age groups. In
2009, those 75 and older concentrated the majority of those dying; 12,145 men and 16,686
women. Those aged 64 to 74 years constituted the next group of those dying; 3,389 men and
2,226 women. The top causes of death between 1991 and 2009 were cardiovascular diseases,
cancer, and respiratory system diseases. The total number of deaths caused by HIV/AIDS was
5. 19. Infant mortality was 3.1 for boys and 2.5 for girls per 1,000 live births in 2010 compared to
11.0 for boys and 9.8 for girls in 1976. There were only 196 total infant deaths in 2009
compared to 387 total infant deaths in 1991. Healthcare in Norway is universal and contributes
to the high life expectancy of the country.
There was a total of 61,442 live births in Norway for 2010; in 1986 there was a total of
52,514 live births but lower than the 66,697 live births in 1968 (Births, Statistics Norway, 2011).
The total fertility rate in Norway for 2010 was 1.95, up from 1.82 in 1986 but lower from the
TFR of 2.72 in 1968. In 2010 woman aged 30-34 were the most fertile with 128.0 per 1,000
woman live births for age-specific fertility rate, higher than the 98.5 live births for the same age
group in 1968. The next most fertile age group in 2010 was woman aged 25 to 29 with 124.0
live births per 1,000 women, lower than the 164.6 live births per 1,000 women in 1968. In 2010,
over 88 percent of woman aged 15 to 49 used contraception and there were a total of 15,744
induced abortions. There was a “baby-boom” in the country after WWII much like the United
States. Despite having below replacement fertility, Norway had the third highest fertility rate in
Europe in 2010. Because of the high standard of living and economic status of Norwegians, they
can afford to raise children (Kravdal, 2006). Norway subsidizes child care and pays for maternal
leave in the workplace for up 10 months to 1 year with full wage compensation. It is even
possible for mothers who are working to leave for a few hours to breastfeed or stay at home with
a sick child.
In 2009, 200,500 persons moved between municipalities in Norway. Since the
1980’s, people have moved from peripheral areas to more central areas. Norway had a net
migration rate in 2010 of 8 per 1,000 population (Focus on Immigration, 2010). Immigrants
accounted for 11.4 percent of the Norway’s population at the beginning of 2010. There are
6. slightly more men than woman immigrants, 51 percent and 49 percent respectively. About 50
percent of immigrants are under age 34. Norway defines the immigrant population as persons
having both parents born abroad. In order to become a citizen of Norway, migrants are required
to have permanent resident status for seven continuous years and have a record of good conduct.
Children born to two immigrant parents must wait until age 18 to apply for citizenship. There
were 459,000 immigrants and 93,000 Norwegian-born persons with immigrant parents living in
Norway. The top five countries that immigrants were from included Poland, Sweden, Germany,
and Iraq. 7 out of 10 immigrants were European in 2010. If broken down by region 257,000
persons had a European background, 199,000 were Asian, 67,000 were African, 18,000 were
Latin American, and 11,000 were North American and Oceanian. 35 percent of immigrants have
Norwegian citizenship. Between 1990 and 2008, 377,000 non-Nordic citizens immigrated and
were granted citizenship. Of these, 24 percent came as refugees, 24 percent were labor migrants
(most of these were European immigrants), and 11 percent were given residence in order to
undertake education. 23 percent came due to family reunification and 17 percent were granted
residence because they had established families. 2 in 10 immigrants have lived in Norway for
more than 20 years and 4 in 10 have lived in Norway for 4 years or less. 61.7 percent of
immigrants were employed in the fourth quarter of 2009. Immigrants from Nordic countries was
74.6 percent, immigrants from other EU countries was 69.7 percent. 7.1 percent of immigrants
were unemployed. There were 74,654 short term (staying 6 months or less) wage earners in
Norway. If we transposed this data to a theory, it would suggest the World Systems theory,
given Norway’s economic status and the reasons given by migrants for coming to the country.
7. 19 percent of the population on in Norway was aged 15 years or less, 66 percent of the
population was aged between 15 and 64 years, and 15 percent of the population was aged 65
years or more in 2010 (World Population Data Sheet, 2010). The elderly support ratio is 4 in
2010. It is projected to be 3 by the year 2050. The median age in 2010 was 39.7 years for both
sexes; 38.8 for men and 40.5 for woman. The median age in the year 2050 is projected to be
45.2 years for both sexes; 43.6 for men and 46.7 for woman. The sex ratio in 2010 was 98.4
males to 100 females for all age groups. In the 65 and older age group, the sex ratio is 76 males
to 100 females in 2010. Norway’s age structure had been described as a pillar where most age
concentration numbers are almost the same. Norwegians may retire at age 67 when they receive
their pensions. The Norwegian government is actually paying for their elderly to retire abroad,
especially to warmer climates such as Spain because warmer weather is believed to extend life
and to save the government money (Fuchs, 2007). Health care centers in Spain for Norway’s
elderly are almost entirely staffed by Norwegians. Living expenses are also lower in Spain than
Norway, which is one of the most expensive countries in the world. Currently there is about
10,000 Norwegian elderly in Spain and the government is expected to build more senior
residences in Spain. Doctor approval most be given in order to move to Spain or abroad.
8. About 80 percent of the population in Norway lives in urban places or about over 3.7
million persons. The rate of urbanization is 1.2 percent annual rate of change. The population
density is 12 persons per square kilometer. Urban areas are defined by the Norwegian
government as cities with a population of 10,000 persons or more. The largest city by area and
population is Oslo, covering an area of 454 square kilometers and a current population of
876,391 persons.
There were 2.2 million households in Norway (Norway, 2011). 40 percent of households
are single persons living alone. 20 percent or 1 in 5 of the population lives alone compared to
just 4 percent in 1960. 27 percent of men aged 20 to 59 live alone in cities, the same figure for
woman is 17 percent. 75 percent of woman aged 20 to 66 are employed in Norway. The
average starting marriage age is 38 for men and 34 for woman. Men and woman aged 20 to 24
cohabitation percentage was 27, 25 to 29 age range was 34 percent, and 30 to 34 age range was
30 percent. The total number of cohabitants was 300,000 for 2009. The number of children
aged 18 or less was a little over 1.1 million persons. About 1 in 4 children lived with 1 parent.
Half of all children are born to single mothers. 72 percent of woman in the workforce have
children. Currently, 40.4 percent of all marriages end in divorce.
El Salvador is the smallest country in Central America, bordering the Pacific Ocean
between Guatemala and Honduras (Factbook El Salvador, 2011). In terms of kilometers and
miles, the country is only slightly smaller than the State of Massachusetts and the current mid-
year 2010 population was 6,200,000 million persons (World Population Data Sheet, 2010).
Humans are believed to have settled in the region by about 2000 BCE (At a Glance: El Salvador,
2010). Spanish conquistadors arrived in the region in 1524 and ruled the country until 1821
(Factbook El Salvador, 2011). El Salvador than became a Coffee republic, dependent on the
9. exportation of coffee as its’ economic basis. As little as 2 percent of the population controlled 95
percent of the wealth and attempts by the majority of the population to establish fair wages, land
rights, and unions were severely subdued by the country’s military (Library of Congress country
studies, 1988). After the establishment of the Salvadoran Communist Party in the 1930’s, the
political situation of the country can be characterized by numerous coups and assassinations as
right and left wing political parties struggled for control of El Salvador. In 1980, the country
exploded into a full blown civil war that lasted until 1992. During this time, the Salvadoran
army committed numerous human rights violations as it tried to eliminate right wing guerilla
groups who were targeting government officials. The war took the lives of more than 75,000
people.
The government of El Salvador is now a presidential representative democratic republic.
In terms of governmental administration, the country is divided into 14 departments (the
equivalent of States in the US) and 262 municipalities (the equivalent of counties in the US)
(Factbook El Salvador, 2011). The country’s climate can be characterized as tropical with
pronounced wet season that sometimes includes hurricanes, lasting May to October and a dry
season lasting from November to April. Being located next to the Pacific Ring of Fire, El
Salvador is known as the land of volcanoes and is subject to frequent earthquakes and volcanic
activity. The current growth rate is 1.4% (World Population Data Sheet, 2010). The population
increased from 1.9 million inhabitants in 1950 to 4.1 million in 1975 (Library of Congress
country studies, 1988). It was projected to increase 8.8 by the year 2000. The population was
projected to have doubled every quarter century since 1950. At the current growth rate the
population will now double in 49.3 years (69/1.4=49.3). The current birth rate is 20 births per
1,000 population and the current death rate is 7 deaths per 1,000 population. The country is
10. characterized as a lower middle income country, with a Gross national income per capita of
$3,370 US dollars in 2009 and 40% of the country’s population lives in poverty (El Salvador
Data, 2010). The main economic exports are coffee, sugar, textiles, chemicals, and metals
(Factbook El Salvador, 2011).
In terms of the demographic transition, El Salvador is going through a rapid period of
industrialization in order to make its economy less dependent on agriculture (El Salvador Data ,
2010). It has the third largest economy based on Gross domestic product in Latin America.
Agriculture accounts for 11 percent of the GDP, industry account for 29.1 percent of the GDP,
while services account for the remaining 59.9 percent. 19 percent of the labor force is employed
in agriculture, 23 percent in industry, and 58 percent in services. Unemployment is about 7
percent. Most of El Salvador’s farmland is controlled by wealthy plantation owners. The
country still suffers from high income inequality and is ranked 15th in terms of the greatest
inequality.
El Salvador fertility rates have declined since in the mid 1970’s from 6.3 births per
woman to 2.5 births per woman in the first decade of the twenty first century (Kent, 2010).
Since the 1950’s the death rate has declined from 21.3 in 1950 to 7 in 2010 (At a Glance: El
Salvador, 2010). In terms of age structure, the Salvadoran population is still very young with
33% of the population aged 15 years or less and the median age of the population is 24.3 years.
Migration is a relatively recent phenomenon; at the beginning of 1980 only 10,000 Salvadorans
lived outside of their country. As of 2010, 2.3 million Salvadorans lived outside of El Salvador
and emigration from the country has continued even with the end of the civil conflict in 1992
(Gammage, 2007). Since 1950 the percentage and number of rural population has gone down
while the number and percentage of urban population has gone up (World Urbanization
11. Prospects, 2009). This evidence would suggest that El Salvador is currently in the later second
stage of the demographics transition theory.
The sources of demographic data for El Salvador comes from Vital Statistics and it
includes census data, survey, and administrative data (International Data Base El Salvador,
2008). The General Directorate Statistics and Census (Dirección General de Estadística y
Censos) is a government agency under the Ministry of the Economy and is in charge of taking
the national census of El Salvador every 10 years as well as other demographic information such
as mortality, fertility, divorce, marriage, migration, and housing statistics (Vital Demographic
Statistics , 2008). However, budget, legal, and administrative problems have not always made
taking the census every ten years possible. The General Directorate (GD) was established in
1881 and the first census was taken in 1930; there have been six censuses taken since (Censos de
El Salvador, 2008). The GD also conducts surveys with regard to agriculture, economic, and
labor statistics.
In the mid-1970’s, the total fertility rate was 6.3 births per woman (Kent, 2010). It
dropped to 2.5 between 2003 and 2008. As of 2010, the TFR had dropped to 2.4 births per
woman. Woman in rural areas have one child more than in urban areas: 3.0 compared to 2.1. In
terms of economics, woman in the wealthiest one-fifth of households had a TFR of 1.6 births in a
lifetime while woman in the poorest one-fifth had a TFR of 3.7 in a lifetime. The percentage of
woman of child-bearing age using contraception has increased from 47 percent in 1988 to 73
percent in 2008. Sterilization has been the most common means of birth control; as of 2004 one
quarter of woman under age 30 had been sterilized. In 2008 the percentage of woman of child-
bearing ages using injectable hormones was 31 percent. The total fertility rate is expected to fall
to 1.8 births per 1,000 woman by 2025.
12. El Salvador had a net migration rate of 8 per 1,000 population in 2010 (World
Population Data Sheet, 2010). Before the beginning to the Civil War it is estimated that only
10,000 Salvadorans were living in the US. During the civil war between 20 and 30 percent of
the population emigrated for the country (Gammage, 2007). Over half a million people came to
the US alone. Also, there were 120,000 Salvadorans who fled to Mexico, 70,000 to Guatemala,
20,000 to Honduras, 17,000 to Nicaragua, and 10,000 to Costa Rica. Currently there are 2.5
million Salvadorans living in the US out of 3.2 million Salvadorans who live outside their home
country. Remittances from Salvadorans abroad are a major source foreign income; $2.5 billion
dollars annually or about 17% of the GDP (One Home, Two Nations, 2011). 60 percent of
remittance senders are male and 63 percent are under the age of 40. 22 percent of households in
El Salvador receive remittances. If remittances were not being sent up to 37 percent of the
population would be living in extreme poverty compared to just 20 percent now. 75 percent of
the remittance money pays for household expenditures. Because so many Salvadorans receive
remittances many now have chosen not to work and now there 200,000 migrants from other
Central American countries coming to El Salvador because the currency of the country is the US
dollar (Navarro, 2007).
13. In 2010, 33 percent of the population was age 15 or less and 7 percent of the
population was ages 65 and older (World Population Data Sheet, 2010). The current elderly
support ratio is 8 and is projected to be 4 in 2050. Over 1.8 children aged 18 and under are
exploited as child labor. As much as 7 out of 10 children are abused in the country. Gangs have
become common place since the end of the civil war in 1992 (Youth Gang Organizaton in El
Salvador, 2010). They started as a result of migrants from the United States who were deported
from violent areas of Los Angeles, CA. It is estimated that over 50,000 youth are affiliated with
gangs. Gangs are reported to be responsible for as many as 27% of all crime and 40% of all
homicides in 2010.
Currently 63 percent of people in El Salvador live in urban areas (Congress, 2005). The
capital San Salvador is the largest city by area and population. It covers over 620 square
kilometers and has a metropolitan population of over 2.2 million people. The urbanization of El
Salvador was fueled in the early twentieth century by exportation of coffee; the wealthiest and
the elite of the country used their earnings to establish infrastructure and transportation services
for the economy. Other building projects included communication, educational, health, welfare
services, and factories. Many rural people started migrating in the 1930’s to urban areas for jobs
and better wages because of the low wages in agriculture.
El Salvador and Norway can expect to see positive population growth in the future.
Migration from El Salvador will continue due to income inequality, limited space to grow the
population, and poverty while immigrants continue to come to Norway because of its high
human development. Health and mortality from communicable diseases in El Salvador will
continue to decline while health and mortality in Norway will stay the same given that healthcare
is universal. El Salvador’s population will probably get older with many people in the 50 to 64
14. age range to taking up a greater amount of the population in 2050. Total fertility rate will hover
just above 2.0 in El Salvador because of its young population while it hovers just below or equal
to 2.0 in Norway.
Bibliography
AboutNorway History.(2010, November).RetrievedMarch18, 2011, fromNorwayThe Official Site in
the UnitedStates:http://www.norway.org/aboutnorway/history/
AboutStatisticsNorway.(2011, January).RetrievedMarch7, 2011, from StatisticsNorwayWebsite:
http://www.ssb.no/english/about_ssb/history/
Article: NewFertility Rates forEurope.(2009, November).RetrievedMarch20, 2011, fromPopulations
Reference BureauWebsite:http://www.prb.org/Articles/2007/newfertilityrates.aspx
At a Glance: El Salvador.(2010,March 2). RetrievedMarch20, 2011, fromUNICEF Statistics:
http://www.unicef.org/infobycountry/elsalvador_statistics.html
Background Note:Norway.(2010, December7).RetrievedMarch13, 2011, fromU.S. Departmentof
State Web site:http://www.state.gov/r/pa/ei/bgn/3421.htm#geo
Births, StatisticsNorway.(2011, April 7).Retrieved April14,2011, fromStatisticsNorway:
http://www.ssb.no/fodte_en/
Causesof Death,StatisticsNorway .(2010, December3).RetrievedMarch6, 2011, from Statistics
Norway: http://www.ssb.no/dodsarsak_en/
CensosdeEl Salvador.(2008, June 30). RetrievedMarch3, 2011, from General Directorate of Statistics
and Census:http://www.digestyc.gob.sv/
Congress,L.o. (2005, January). Country Studies:ElSalvadorUrbanization.RetrievedApril 1,2011, from
UnitedStatesLibraryof Congress:http://memory.loc.gov/cgi-
bin/query/r?frd/cstdy:@field%28DOCID+sv0044%29
DataNorway .(2010, January 31). RetrievedMarch25, 2011, from Thw WorldBank GroupWeb site:
http://data.worldbank.org/country/norway
El SalvadorData .(2010, March 30). RetrievedFebruary25,2011, fromWorld BankGroup Web site:
http://data.worldbank.org/country/el-salvador
El SalvadorData.(2010, January31). RetrievedMarch27, 2011, from WorldBank GroupWeb site:
http://data.worldbank.org/country/el-salvador
15. FactbookEl Salvador.(2011, April 6).RetrievedApril17,2011, fromCIA The WorldFactbook:
https://www.cia.gov/library/publications/the-world-factbook/geos/es.html
Focuson Immigration.(2010, January 2).RetrievedMarch30, 2011, fromStatisticsNorway:
http://www.ssb.no/innvandring_en/
FocusOn Population.(2010, January31). RetrievedMarch27, 2011, fromStatisticsNorwayWebsite:
http://www.ssb.no/befolkning_en/
Fuchs,D. (2007, June 27). Norway looksafterits Elderly-in Spain.RetrievedMarch17, 2011, fromThe
GuardianNewspaper: http://www.guardian.co.uk/world/2007/jun/26/spain.international
Gammage,S. (2007, July31). Country Profiles:El Salvador.RetrievedMarch11, 2011, from Migration
InformationSource Website:http://www.migrationinformation.org/Profiles/display.cfm?ID=636
Health Profile:Norway .(2010, March). RetrievedFebruary21,2011, fromWorld HealthRankingsWeb
site:http://www.worldlifeexpectancy.com/country-health-profile/norway
InternationalDataBaseEl Salvador. (2008, September).RetrievedMarch17, 2011, from US Census
BureauWeb site:http://www.census.gov/ipc/www/idb/country.php
Kent,M. M. (2010, October31). PRB: El Salvador.RetrievedFebruary7,2011, from Populations
ReferencesBureauWebsite:http://www.prb.org/Articles/2010/elsalvador.aspx
Kravdal, O.(2006, August28). Why is fertility in Norway so high? RetrievedMarch13, 2011, fromCenter
for AdvancedStudy:http://www.cas.uio.no/Publications/Seminar/Complexity_Kravdal.pdf
Library of Congresscountry studies.(1988, June 30). RetrievedFebruary 17,2011, fromLibrary of
CongressWebsite:http://lcweb2.loc.gov/cgi-bin/query/r?frd/cstdy:@field%28DOCID+sv0032%29
Navarro,L.-G. (2007, October12). El SalvadorMigration CreatesLaborShortage.RetrievedMarch30,
2011, fromNational PublicRadio:http://www.npr.org/templates/story/story.php?storyId=15218365
Norway Economy and Industry .(2011, January 15). RetrievedApril 1,2011, from NorwayThe Official
site inthe UnitedStates:http://www.norway.org/aboutnorway/economy/
Norway,S.(2011, April 7). Families and Households.RetrievedApril 20,2011, from StatisticsNorway:
http://www.ssb.no/familie_en/
Norwegian Americans.(2010,January 31). RetrievedFebruary28,2011, from NorwayThe Official Site in
the UnitedStatesWebsite:http://www.norway.org/
OneHome, Two Nations.(2011, January 20). RetrievedMarch28, 2011, from AmericanPublicMedia:
http://marketplace.publicradio.org/features/onehome/chinameca_remittances.shtml
Population StatisticsNorway.(2010,January31). RetrievedMarch11, 2011, fromStatisticsNorwayWeb
site:http://www.ssb.no/english/
16. Vital DemographicStatistics . (2008, January31). RetrievedMarch30, 2011, fromGeneral Directorate of
StatisticsandCensusWebSite (TranslatedfromSpanish):
http://translate.google.com/translate?hl=en&sl=es&u=http://www.digestyc.gob.sv/&ei=CmSuTcqfBIbLg
QevjNH7Cw&sa=X&oi=translate&ct=result&resnum=1&ved=0CCAQ7gEwAA&prev=/search%3Fq%3DDir
ecci%25C3%25B3n%2BGeneral%2Bde%2BEstad%25C3%25ADstica%2By%2BCensos%26hl%3D
World Population DataSheet. (2010, December1).RetrievedFebruary17,2011, from Population
Reference BureauWebsite:http://www.prb.org/pdf10/10wpds_eng.pdf
World Population DataSheet. (2010, December1).RetrievedFebruary17,2011, from Population
Reference BureauWebsite:http://www.prb.org/pdf10/10wpds_eng.pdf
World Urbanization Prospects.(2009, January31). RetrievedMarch30, 2011, fromUnitedNations
PopulationDivision:http://esa.un.org/unpd/wup/unup/index_panel1.html
(2010). YouthGang Organizaton in El Salvador. Districtof Columbia:USDepartmentof State.