Recommended

Recommended
More Related Content
Similar to Ontario Ski Hill Speeds
Ontario Ski Hill Speeds
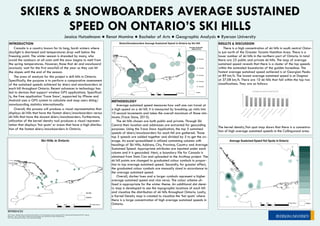
- 1. SKIERS & SNOWBOARDERS AVERAGE SUSTAINED SPEED ON ONTARIO’S SKI HILLS Jessica Hutzelmann ● Renat Mamine ● Bachelor of Arts ● Geographic Analysis ● Ryerson University INTRODUCTION Canada is a country known for its long, harsh winters where daylight is shortened and temperatures drop well below the freezing point. The winter season is dreaded by many, who avoid the outdoors at all costs until the snow begins to melt from the spring temperatures. However, those that ski and snowboard anxiously wait for the first snowfall of the year so they can hit the slopes until the end of the season. The area of analysis for this project is skill hills in Ontario. Specifically, the purpose is to perform a comparative assessment of the sustained speeds achieved by skiers and snowboarders at each hill throughout Ontario. Recent advances in technology has led to devices that support wireless GPS applications. Specifical- ly, the free application ‘Trace Snow’, supported by IPhone and Android uses a GPS system to calculate and map users skiing/ snowboarding statistics internationally. Overall, this process will produce a visual representation that displays ski hills that have the fastest skiers/snowboarders versus ski hills that have the slowest skiers/snowboarders. Furthermore, utilization of the kernel density tool produces a visual represen- tation that displays ‘hot spots’ or areas that have a high distribu- tion of the fastest skiers/snowboarders in Ontario. METHODOLOGY Average sustained speed measures how well one can travel at a high speed on a ski hill. It is measured by breaking up visits into 10 second increments and takes the overall maximum of those min- imums (Trace Snow, 2015). The ski hills chosen are both public and private. Through Ski Central their location and addresses are extracted for geocoding purposes. Using the Trace Snow Application, the top 5 sustained speeds of skiers/snowboarders for each hill are gathered. Those top 5 speeds are added together and divided by 5 to get the av- erage. An excel spreadsheet is utilized containing columns with headings of Ski Hills, Address, City, Province, Country and Average Sustained Speed. Appropriate attributes are inputted under each column and it is geocoded. Next, a boundary file for Canada is obtained from Stats Can and uploaded to the ArcMap project. The ski hill points are changed to graduated colour symbols in propor- tion to top average sustained speed. Secondly, for greater effect, the graduated colour symbols are manually sized in accordance to the average sustained speed. Overall, darker hues and a larger symbols represent a higher average sustained speed and vice versa. The colour scheme uti- lized is appropriate for the winter theme. An additional dot densi- ty map is developed to see the topographic locations of each hill and visualize the distribution of ski hills throughout Ontario. Lastly, a Kernel Density map is created to visualize the ‘hot spots’ where there is a large concentration of high average sustained speeds in Ontario. RESULTS & DISCUSSION There is a high concentration of ski hills in south central Ontar- io just north of the Greater Toronto Hamilton Area. There is a lower number of ski hills in the northern part of Ontario. In total there are 23 public and private ski hills. The map of average sustained speed reveals that there is a cluster of the top speeds within the extended boundaries of the golden horseshoe. The fastest average sustained speed achieved is at Georgian Peaks at 89 km/h. The lowest average sustained speed is at Dagmar at 37.08 km/h. There are 10 ski hills that fall within the top two classifications. They are as follows: The kernel density/hot spot map shows that there is a concentra- tion of high average sustained speeds in the Collingwood area. REFERENCES 2011 Census - Boundary files. (n.d.). Retrieved from http://www12.statcan.gc.ca/census-recensement/2011/geo/bound-limit/bound-limit-2011-eng.cfm SkiCentral - The #1 Search Site for Skiing and Snowboarding. (n.d.). Retrieved from http://skicentral.com/ Trace. (n.d.). Retrieved from https://snow.traceup.com/landing 0 10 20 30 40 50 60 70 80 90 100 Average Sustained Speed (km/h)