(INSTRUCTIONS) Your submission should be a minimum of 2000 words (m.docx
BPR Site Selection
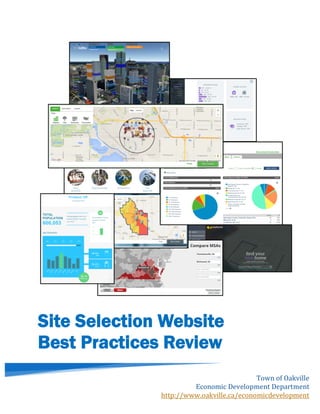
1. Town of
Town
of
Oakville
Economic
Development
Department
http://www.oakville.ca/economicdevelopment
2. PAGE | 1
Table of Contents
I. Table of Contents ........................................................................................ 1
II. Executive Summary.....................................................................................2
Common
Findings ......................................................................................................2
III. Website Reviews ..........................................................................................3
State
Book
International..........................................................................................3
Yes
Virginia;
Site
Selection
Tools ..........................................................................7
Hamilton
Site
Finder ...............................................................................................10
YP
Next
Home............................................................................................................13
Altus
InSite:
Dynamic
3D
View ............................................................................17
Zoom
Prospector:
GIS
Planning...........................................................................20
IV. Recommendations..................................................................................... 29
3. PAGE | 2
Executive Summary
Site
Selection
is
a
growing
industry,
and
many
communities
are
updating
their
tools
with
new
and
improved
software
and
data
creating
an
attractive
atmosphere
for
their
users.
Throughout
this
Site
Selection
Website
Best
Practices
Review
it
is
seen
that
the
main
focus
of
all
webpages
is
to
help
the
user
get
the
information
that
they
want.
Various
customizations
of
information
allow
users
to
use
the
tools
to
their
advantage
and
pinpoint
the
specific
information
that
they
want
to
know.
This
allows
users
to
have
a
sense
of
control
over
the
tool,
making
it
more
attractive
to
them.
Many
of
the
webpage
reviews
below
demonstrate
different
and
unique
ways
of
showing
data
which
is
beneficial
to
the
user,
and
also
beneficial
to
Phase
2
of
Oakville’s
Site
Selection
Tool.
Updating
Find
Oakville
will
attract
more
users
and
help
businesses
expand
and
locate
where
best
suitable.
Areas
of
focus
in
this
report
are;
heat
mapping,
report
generating,
radius
searching,
3D
models,
and
comparing
cities.
These
are
all
tools
which
were
found
in
the
various
reviews
and
are
also
listed
below
in
Common
Findings.
By
updating
all
these
features
the
Find
Oakville
tool
could
become
a
leading
search
tool
for
businesses
looking
for
industrial,
commercial,
or
land
properties
in
Oakville.
Common
Findings
Webpage
Heat
Maps
Report
Generating
Radius
Searches
3D
Models
Comparing
Cities
State
Book
International
ü
ü
ü
Yes
Virginia
ü
ü
Hamilton
Site
Finder
ü
ü
ü
YP
Next
Home
ü
Altus
InSite
ü
ü
Zoom
Prospector:
Niagara
Site
Finder
ü
ü
ü
Navigate
Newell
ü
ü
ü
ü
Great
Lakes
Bay
Region
ü
ü
ü
ü
ü
Oregon
Prospector
ü
ü
ü
ü
ü
4. PAGE | 3
Website Reviews
State
Book
International
Webpage:
https://www.statebook.com/
Description
State
Book
International
is
a
National
site
selection
tool
that
allows
users
to
focus
their
search
from
a
national
to
a
local
scale;
either
by
State,
Metropolitan
Statistical
Area
(MSA),
or
County.
State
Book
International
works
with
Economic
Development
Organizations
(EDOs),
Site
Selectors,
Universities
and
Government
Agencies
to
collect
the
most
trusted
data
and
create
an
online
marketplace
for
economic
development,
corporate
site
selection
and
property
search.
The
search
can
be
filtered
by
the
many
different
attributes
including:
• Arts
and
Culture
• Climate
and
Geography
• Demographics
• Education
• Health
• Household
and
Income
• Housing,
Incentives
• Industries
• Lifestyle
• Taxation
• Transportation
• Utilities
• Workforce
and
Training
• Sites
and
Buildings
• Radius
• Manual
Each
of
these
attributes
allows
the
user
to
define
their
search
to
exactly
what
they
want
to
know
about
the
area.
Options
to
compare
areas
are
also
available,
and
the
ability
to
save
filter
options
helps
to
compare
the
different
locations
based
on
the
information
the
user
wants.
State
Book
International
allows
the
user
to
use
their
map
tool
for
all
of
the
filters
for
free,
but
to
do
a
more
in
depth
search
and
compare
sites
you
must
pay
for
a
subscription.
5. PAGE | 4
Stand-‐‑out
Functionality
Specific
Search
and
Saving
The
most
stand-‐‑out
function
of
State
Book
International
is
all
of
the
filters
it
provides
and
how
each
filter
can
be
adjusted
to
the
users’
specific
search.
All
of
the
filters
provided
offer
different
information
about
the
area
they
have
selected.
Another
interesting
search
functionality
is
the
radius
tool,
which
allows
users
to
define
their
search
within
a
specific
radius
of
the
location
they
have
chosen.
The
depth
of
each
filter
gives
the
user
many
different
options
of
what
they
would
like
to
see,
and
being
able
to
select
multiple
filters
allows
them
to
have
all
the
information
they
want.
Users
can
save
their
selection
of
filters
and
reuse
those
exact
same
filters
for
another
location.
For
example;
State
Books’
Demographics
filter
can
be
broken
down
into
multiple
categories.
The
images
below
show
how
State
Book
portrays
their
data:
Image
1
shows
Age
Demographics,
image
2
shows
Language
Ability
Demographics,
image
3
shows
Population
Demographics,
and
image
4
shows
Race
and
Ethnicity
demographics.
These
filters
are
then
added
to
a
side
section
where
the
user
can
use
the
filters
they
selected
to
build
a
report
for
a
specific
County,
MSA,
or
State.
This
is
a
function
that
can
help
the
user
gain
information
about
a
location
they
may
be
interested
in.
Image
1:
State
Book
International
shows
a
wide
range
of
Age
Demographics
including;
Age
Range,
Population
by
Age
Ranges,
Age
Dependency
Ratios,
Median
Age,
and
Old-‐‑Age
Dependency
Ratio.
6. PAGE | 5
Image
2:
State
Book
International
shows
all
the
different
Language
Ability
Demographics
of
the
States
by
creating
a
full
wide
range
of
Languages
from
A
to
Z
including;
Arabic,
Chinese,
English,
etc.
Image
3:
State
Book
International
has
Population
Demographics
including
Total
Population,
Total
Female
Population,
and
Total
Male
Population.
Image
4:
State
Book
International
shows
Race
and
Ethnicity
Demographics
of
the
States
by
separating
into
different
races
and
ethnicities
into
categories.
This
shows
how
in
depth
and
specific
State
Book
International’s
searches
can
be
and
this
goes
for
all
the
filters
across
the
top.
The
user
can
pick
each
filter
they
want
to
view
and
then
save
it
as
a
bundle
and
view
all
the
information
in
one
tab,
allowing
for
a
specific
search
and
a
filter
saving
feature.
7. PAGE | 6
Image
5:
Example
of
a
Search
with
the
Filters
on
the
right-‐‑hand
side.
Image
5
is
an
example
of
how
the
tool
is
in-‐‑depth
and
provides
information.
New
York
State
was
selected
along
with
some
of
the
many
filters
offered
including
Percent
of
Unemployment,
Population
in
labour
force,
Total
Population,
etc.
State
Book
International
has
included
a
tab
called
Organizations
(Image
6).
This
stand-‐‑out
feature
shows
all
the
Economic
Development
Organizations
(EDOs)
for
the
area
that
the
user
has
selected.
By
clicking
the
EDO
State
Books
redirects
the
user
to
a
new
webpage
with
all
the
information
about
that
EDO.
Another
stand-‐‑out
here
is
the
Region
Information
tab
(Image
7).
All
of
the
filters
that
the
user
has
selected
have
been
summarized
into
a
regional
information
area,
giving
them
everything
they
are
looking
for.
Image
6:
EDOs
tab
by
State
and
including
links
to
their
webpages.
Image
7:
Regional
Information
Tab.
8. PAGE | 7
Yes
Virginia;
Site
Selection
Tools
Webpage:
http://www.yesvirginia.org/ToolsResources/SiteSelection
Community
Information
The
State
of
Virginia
has
an
increasing
population
of
8,
326,
289
people
as
of
2014,
Virginia
is
located
on
the
Atlantic
Coast
of
the
United
States
with
North
Carolina
to
the
South
and
Maryland
to
the
North
and
they
are
striving
for
new
investments.
Description
Virginia
Scan
is
a
webpage
set
out
to
provide
information
for
businesses
and
to
market
their
state
as
“the
best
state
for
business”.
Saying
‘yes’
to
Virginia
is
saying
yes
to
lower
operating
costs
and
access
to
high
skilled
education
and
global
markets.
This
webpage
has
been
purely
developed
to
attract
businesses,
market
Virginia
and
even
provide
success
for
current
businesses
in
the
State.
There
are
three
main
features
to
this
webpage:
Comparing
Virginia
to
other
States,
Search
Available
Properties,
and
Viewing
Community
Profiles.
The
main
purpose
of
this
webpage
is
as
a
marketing
tool
to
get
people
interested
in
developing
their
business
in
Virginia,
and
they
do
this
by
listing
all
the
benefits
of
locating
business
there.
The
webpage
also
provides
the
user
with
a
lot
of
information
on
the
workforce,
education,
research
and
development,
location
and
infrastructure,
and
the
quality
of
life
in
the
State.
Another
feature
this
page
portrays
is
the
opportunity
of
Global
Focus;
allowing
your
business
to
expand
internationally
with
investment.
9. PAGE | 8
Image
8:
Virginia
Scan
Comparison
Tool
and
Features.
Image
9:
Example
of
Virginia
Scan
Comparing
States.
Stand-‐‑out
Functionality
Comparing
Cities
&
States
Out
of
the
three
main
features:
Compare
Virginia
to
other
States,
Search
Available
Properties,
and
View
Community
Profiles,
the
most
stand
out
function
is
the
Comparison
tool
seen
in
image
8.
This
tool
allows
the
user
to
Compare
Virginia
with
other
states
and
provides
data
on:
• Income
and
Output
• Workforce
• Education
• Cost
of
doing
Business
• Fiscal
Strength
• Entrepreneurship
and
Innovation
• Foreign
Direct
Investment
The
user
is
able
to
select
the
areas
that
are
of
interest
to
them
and
create
a
business
type
report
in
PDF
or
Excel
Spreadsheet.
A
stand
out
function
here
is
that
the
user
can
select
more
up
to
three
other
States
to
compare
to
Virginia
seen
in
image
9.
The
information
is
then
generated
for
all
the
States
and
collected
in
all
the
categories.
Image
10
is
an
example
of
the
kind
of
data
that
is
shown
in
the
report.
Certain
features
can
also
be
hidden
from
the
downloadable
report
by
clicking
the
X
on
the
right
hand
side.
Image
10:
Example
of
Virginia
Scan
Comparing
States
with
the
Selected
Data,
Income
and
Output.
10. PAGE | 9
Image
11:
Virginia
Scan
Comparing
Metropolitan
Statistical
Areas
(MSAs).
Another
stand
out
feature
in
this
tool
is
that
the
user
can
also
compare
Metropolitan
Statistical
Areas
(MSAs).
MSAs
are
geographical
areas
that
have
a
relatively
high
density
at
the
core
and
also
have
economic
ties
in
the
area.
This
feature
allows
the
user
to
see
full
reports
on
any
selected
MSAs,
which
is
a
great
function
to
have
when
thinking
about
locating
a
business
in
a
specific
area.
Yes
Virginia
also
has
its
own
community
profiles
section,
which
can
be
divided
by
county,
region,
MSA,
or
even
a
view
of
the
commonwealth
of
Virginia.
The
user
can
download
a
PDF
based
on
whatever
location
in
Virginia
they
are
looking
at,
and
it
will
provide
them
with
information
on:
Data
Source
The
data
used
to
generate
the
reports
is
from
various
sources.
The
majority
of
the
data
is
from:
• The
U.S.
Department
of
Commerce,
Bureau
of
Economic
Analysis
• The
U.S.
Department
of
Commerce,
Census
Bureau
• The
U.S.
Department
of
Labor,
Bureau
of
Labor
Statistics
• Digest
of
Education
Statistics,
2014
Edition,
National
Center
for
Education
Statistics
• Research
Institute
of
America
• Location
within
the
State
• Labour
Market
• Unemployment
Rates
• Population
Characteristics
• Educational
Attainment
• Transportation
• Financial
Institutions
• Community
Facilities
• Lifestyle
11. PAGE | 10
Hamilton
Site
Finder
Webpage:
http://www.investinhamilton.ca/
;
http://siteselector.hamilton.ca/
Community
Information
The
City
of
Hamilton
is
located
an
equal
distance
of
a
1
hour
drive
from
the
City
of
Toronto
and
the
U.S.
Border.
Hamilton
has
a
population
of
over
500,
000
and
a
well-‐‑educated
workforce,
natural
amenities,
and
diverse
economy,
it
is
a
prime
choice
for
future
economic
opportunities.
Hamilton
is
also
made
up
of
7
communities:
• Ancaster
• Dundas
• Flamborough
• Glanbrook
• Hamilton
• Stoney
Creek
• Downtown
Hamilton.
Description
The
City
of
Hamilton’s
Economic
Development
Division
has
created
this
page
to
attract
businesses
to
the
growing
area.
The
Invest
in
Hamilton
Site
Selector
page
is
to
help
businesses
come
to
Hamilton.
It
provides
the
user
with
the
information
they
need
about
available
properties
and
existing
businesses
in
the
area.
The
Site
Selector
tool
is
a
collaborative
effort
between
the
Regional
Commercial
Council
of
the
Realtors
Association
of
Hamilton-‐‑Burlington
and
the
City
of
Hamilton’s
Economic
Development
Division.
The
City
of
Hamilton
has
a
large
array
of
employment
lands
which
is
why
they
market
the
city
as
an
economically
diverse
location.
The
site
selector
also
allows
the
user
to
distinguish
searches
by
community
which
can
help
if
they
are
interested
in
a
particular
area.
12. PAGE | 11
Image
12:
Hamilton
Site
Selector
Filters
and
View
Image
13:
Example
of
Radius
Search.
Image
14:
Example
of
Business
Report
based
on
Radius
Search.
Stand-‐‑out
Functionality
Radius
Search
The
Hamilton
Site
Selector
tool
provides
a
functional
business
tool
for
users
looking
for
buildings
or
land.
It
gives
the
user
a
number
of
different
options
to
choose
from
in
every
section:
Property
Type
Building,
Sale
Type
and
even
which
Community
they
have
interest
in.
Once
a
location
has
been
selected
the
user
can
see
other
available
properties
close
by.
The
user
is
also
able
to
select
the
areas
that
are
of
interest
to
them
and
create
a
business
type
report
and
print
it
off.
A
simple
radius
search
in
the
business
types
tab
allows
the
user
to
select
a
specific
distance
from
the
potential
location
seen
in
image
13.
This
creates
a
list
of
the
different
types
of
business
in
the
area,
the
percentage
of
that
area
that
they
take
up
and
also
the
total
number
of
businesses
in
each
section
seen
in
image
14.
This
is
a
great
function
if
the
user
really
wants
to
narrow
their
data
to
a
particular
area.
13. PAGE | 12
Image
15:
Radius
Search
with
all
the
Business
Types
on
the
Map.
For
additional
detail,
the
user
can
actually
click
on
the
type
of
business
and
see
all
the
locations
around
their
potential
location
this
is
seen
in
image
15.
Along
with
this
is
an
actual
list
of
all
the
places
that
are
of
that
business
type
and
in
the
area.
This
is
a
great
tool
to
see
the
diversity
of
a
specific
business
type
and
allows
the
user
to
identify
which
businesses
they
could
be
in
competition
with
or
even
what
businesses
could
be
of
use.
Data
Source
The
Hamilton
Site
Selector
has
demographic
information
as
well.
The
Demographic
data
source
is
Statistics
Canada
Census
Data
from
2006,
together
with
the
City
of
Hamilton’s
Planning
and
Economic
Development
Department.
The
data
in
the
business
types
section
is
generated
and
maintained
by
YLM.
It
is
their
responsibility
to
keep
the
information
that
they
provide
for
the
city
up-‐‑to-‐‑date.
(www.ylm.ca)
14. PAGE | 13
YP
Next
Home
Webpage:
http://nexthome.yp.ca/
Description
Yellow
Pages
Next
Home
is
a
leading
provider
of
media
and
online
advertising
solutions
for
the
Real
Estate
Industry.
Although
this
is
not
a
typical
page
for
economic
development
site
selection,
it
provides
appealing
search
properties
and
community
profiles
that
Find
Oakville
could
use.
This
webpage
alone
is
provided
for
all
of
Canada,
allowing
users
to
search
any
property
listings
in
Canada
and
viewing
specific
profiles.
Yellow
Pages
created
YP
Next
Home
to
help
builders,
developers,
and
real
estate
agents
to
advertise
their
properties.
Yellow
Pages
connects
with
Canadians
nationally
and
regionally.
Yellow
Pages
Next
Home
is
a
site
selection
interface
that
allows
a
user
to
select
a
number
of
filters
based
on
their
interests.
The
user
can
search
by
any
location
in
Canada,
with
this
there
are
three
options;
Rent,
New
Construction,
and
Realtor
Listings.
All
of
the
options
also
provide
an
area
of
filters
based
on
the
property
type
the
user
is
looking
for.
Once
a
potential
location
is
selected
the
user
can
further
see
a
neighbourhood
profile
with
some
demographics
about
the
area
as
well.
This
could
be
useful
to
anyone
look
to
move
to
an
area
or
even
build
a
business
in
an
area.
The
webpage
also
provides
national
news
and
information
for
users
to
see
what
is
happening
in
local
and
national
news.
15. PAGE | 14
Image
16:
YP
Next
Home,
Search
Tabs
and
filter
features.
Image
17:
Community
Highlight
Feature
Stand-‐‑out
Functionality
Specific
Search
The
first
stand-‐‑out
feature
here
is
the
Search
tab;
it
provides
a
colorful
and
appealing
view
of
the
available
properties
as
seen
in
image
16.
The
user
can
then
select
the
filters
that
are
suitable
for
them
some
including;
Commercial
and
Office
space,
and
Commercial
Building.
Another
interesting
feature
here
is
that
the
user
can
select
to
view
the
available
listings
in
Map
view
or
List
view.
Having
different
viewing
options
is
good
because
the
user
may
have
different
preferences
of
looking
at
information.
Once
an
area
has
been
selected
it
is
then
highlighted
as
in
image
17.
The
user
can
now
click
on
the
property
they
are
interested
in.
The
tab
on
the
right
of
the
map
is
the
link
to
further
information
about
the
available
property
listing.
Another
feature
here
is
that
the
community
area
is
highlighted,
so
the
user
can
see
where
the
demographics
report
is
based
on.
16. PAGE | 15
Image
18:
Neighbourhood
Profile:
Housing.
Image
19:
Neighbourhood
Profile:
Neighbours
Community
Profile
Next
on
the
list
of
stand-‐‑out
features
are
the
Neighbourhood
profiles.
YP
Next
Home
has
a
unique
way
of
showing
their
data
which
is
great
for
attracting
users
by
using
diagrams
with
data
as
is
seen
in
image
18.
This
feature
also
provides
the
user
with
some
demographic
data
on
the
following:
• Housing:
Most
common
homes,
owners
vs.
renters,
average
cost,
age
of
housing.
• Neighbours:
Average
household
income,
population
by
age,
children
at
home,
income
by
category,
education
levels.
• Commute:
Common
commute
type,
commuting
by
car,
commuting
by
transit.
• Wheels:
Vehicles
by
price
class,
average
amount
spent
on
vehicles,
most
popular
car
brands.
• Habits:
Top
leisure
activities,
magazines
read,
most
watched,
top
physical
activities.
• Cheers:
Top
beer
brands,
top
wine
types,
top
alcohol
selections.
The
most
informative
section
of
this
tool
for
those
looking
at
potential
business
locations
would
be
the
Neighbours
section.
Looking
at
income,
population
size,
and
education
levels
could
help
determine
if
the
neighbourhood
is
a
good
fit
or
not.
17. PAGE | 16
Image
20:
YP
Next
Home,
News
and
Inspiration
Tab
News
and
Inspiration
An
additional
feature
the
YP
Next
Home
provides
is
a
News
and
Inspiration
tab.
This
allows
the
user
to
see
news
articles
and
postings
mostly
relating
to
housing
and
other
amenities.
As
seen
in
figure
20,
there
are
four
tabs
within
News
and
Inspiration;
Trending,
Advise,
Inspiration,
and
Profiles.
All
which
have
interesting
and
informative
articles
either
about
housing
or
other
interesting
media.
There
is
also
a
side
search
feature;
More
News
and
Inspiration,
figure
21.
This
allows
the
user
to
specify
their
search
either
by
topic
or
by
city.
There
is
even
an
articles
of
the
day
section
where
top
trending
articles
can
be
seen.
By
Topic:
-‐‑ Breaking
news
-‐‑ Celebrity
news
-‐‑ Condo
news
-‐‑ Economic
analysis
-‐‑ Market
news
-‐‑ New
homes
news
-‐‑ Politics
-‐‑ Rental
news
-‐‑ Resale
news
-‐‑ Transit
-‐‑ Urban
planning
By
City:
-‐‑ Edmonton
-‐‑ London
-‐‑ Montreal
-‐‑ Regina
-‐‑ Hamilton
-‐‑ Vancouver
-‐‑ Calgary
-‐‑ Toronto
-‐‑ Ottawa
-‐‑ Winnipeg
-‐‑ Victoria
-‐‑ Niagara
Falls
-‐‑ Charlottetown
-‐‑ Halifax
Image
21:
Expand
Search
18. PAGE | 17
Altus
InSite:
Dynamic
3D
View
Webpage:
https://www.altusinsite.com/
Description
Altus
Insite
is
leading
Commercial
Real
Estate
Research
system
providing
information
to
users
on
available
spaces
in
Vancouver,
Edmonton,
Calgary,
Winnipeg,
Toronto,
Ottawa,
Montreal,
Quebec
City
and
30
regional
markets
across
Canada.
It
is
not
only
a
research
base
for
Canada
but
also
for
business
around
the
world
looking
to
locate
in
prime
Canadian
locations.
Altus
InSite
has
partnered
with
Cube
Cities
to
create
a
new
presentation
and
analysis
of
information
for
the
Commercial
Real
Estate
Industry
in
Canada.
The
new
Dynamic
3D
View
they
provide
to
users
has
created
such
a
realistic
view
of
these
cities
that
buyers
can
actually
visualize
and
see
what
the
location
and
its
surroundings
are
like.
The
markets
included
in
3D
view:
-‐‑ Toronto
-‐‑ Calgary
-‐‑ Vancouver
-‐‑ Montreal
-‐‑ Ottawa
For
users
to
gain
access
to
more
tools
they
will
have
to
subscribe
to
the
webpage,
the
free
option
allows
the
user
to
visualize
and
see
what
properties
are
available
–
but
not
access
more
information
on
the
property
itself.
Options
for
subscribers
include;
static
views
of
properties
and
spaces
in
a
certain
market,
snapshots
of
new
supply,
customization
of
presentation
views
to
match
the
specific
user
expectations.
Cube
Cities
has
also
made
a
recent
change
from
Google
Earth
to
Cesium
in
their
3D
development.
19. PAGE | 18
Image
23:
Listings
Distinguished
by
Colour
Stand-‐‑out
Functionality
3D
Models
Altus
InSites’
best
feature
is
its
ability
to
have
a
realistic
3D
representation
of
a
city
along
with
the
functionality
of
looking
for
available
spaces.
Image
22
is
a
3D
representation
of
the
City
of
Toronto.
This
tool
also
includes
a
list
of
the
addresses
on
the
sidebar
along
with
other
search
filters.
Under
3D
Available
Space
Listings
there
is
the
option
for
the
user
to
select
which
district
they
would
like
to
view
and
it
takes
you
directly
to
that
location.
Another
stand-‐‑out
feature
here
is
that
it
shows
the
user
exactly
which
floor
of
the
building
the
available
listing
is
on
and
it
also
distinguishes
the
type
of
listing
based
on
colour:
-‐‑ Direct
Lease:
o Dark
Blue:
Full
Floor
o Light
Blue:
Partial
Floor
-‐‑ Sublet:
o Dark
Green:
Full
Floor
o Light
Green:
Partial
Floor
-‐‑ Development:
o Orange:
Under
Construction
Image
22:
Altus
InSites;
3D
Representation
of
Toronto
20. PAGE | 19
Image
25:
Bird’s
Eye
View
3D
Representation
of
Toronto
The
user
can
directly
click
on
the
floor
that
they
want
to
know
more
about,
which
brings
up
a
small
summary
page
of
the
listing.
This
allows
the
user
to
see
the
actual
listing
available
on
that
floor
and
what
building
it
is
in.
The
visuals
are
practically
identical
to
the
3D
model
as
seen
in
image
24.
The
3D
view
of
this
tool
is
an
exceptional
feature
for
users
with
the
technology
that
we
have
today.
This
tool
even
allows
the
user
to
change
their
view
completely
by
being
able
to
choose
the
specific
angles
they
want
to
view.
Then
can
even
get
a
bird’s
eye
view
of
the
available
location
and
its
surroundings
as
seen
in
image
25.
This
new
Dynamic
3D
View
from
Altus
InSite
is
an
appealing
tool
to
showcase
available
properties
and
will
attract
users
because
of
these
stand-‐‑out
features.
Image
24:
View
Listings
Directly
by
using
3D
Model
21. PAGE | 20
Image
26:
Niagara
Site
Finder;
Property
Search
Zoom
Prospector:
GIS
Planning
Webpage:
http://www.zoomprospector.com/
;
http://www.gisplanning.com/
The
GIS
Planning
Company
has
a
large
client
base,
and
operates
the
Zoom
Prospector
for
communities
in
the
United
States
and
some
of
Canada.
GIS
Planning
has
renovated
the
world
of
Site
Finders
and
Site
Selection.
The
four
best
webpages
to
look
at
for
this
tool
are:
• Niagara
Site
Finder:
http://sitefinder.niagaracanada.com/
• Opportunity
Newell:
http://www.navigatenewell.com/
• Great
Lakes
Bay
Region:
http://www.greatlakesbaysites.com/sites.html
• Oregon
Prospector:
http://www.oregonprospector.com/
The
main
focus
of
Zoom
Prospector
is
to
offer
details
through,
Demographics,
Dynamic
Maps,
Business
Data,
and
Comparing
Communities.
Stand-‐‑out
Functionality
Demographics;
Radius
Search
When
looking
at
Niagara’s
Site
Finder,
a
lot
of
options
are
available
to
the
user
allowing
them
to
customize
their
searches.
Simple
property
searches
can
be
done
based
on
what
business
type
you
are
and
what
kind
of
property
you
are
looking
for.
22. PAGE | 21
Image
27:
Demographics
through
Radius
Search
Image
28:
Demographics
Report
based
on
Radius
Search
The
next
step
is
to
look
into
the
Demographics
of
the
area.
This
tool
allows
the
user
to
complete
a
report
based
on
the
Census
Demographics,
provided
through
Environics
Analytics,
and
also
allows
the
user
to
select
the
radius
in
which
you
want
to
search
–
in
this
case
a
distance
of
5
km
from
the
property
was
selected,
image
27.
This
creates
a
demographics
report
(Image
28)
based
on
the
distance
selected.
The
report
shows
data
from
2014
and
prospective
data
for
2019.
This
allows
users
to
see
expected
data
for
the
future
allowing
them
to
make
their
decision.
This
feature
also
allows
the
user
to
save
the
report
for
later
or
to
e-‐‑mail
to
their
team.
Being
able
to
see
this
data
will
help
users
determine
whether
or
not
to
locate
their
business
there.
23. PAGE | 22
Image
29:
Navigate
Newell
Tool
Image
30:
Heat
Map
Based
on
Participation
Rate
Image
31:
Heat
Maps;
Demographic
Options
Dynamic
Maps;
Heat
Maps
and
Layers
The
ability
to
change
the
dynamics
of
the
maps
can
help
users
refine
their
searches
in
a
visual
manner.
An
option
shown
on
Navigate
Newell
is
Heat
Maps:
In
image
29
user
has
selected
heat
maps,
which
can
be
divided
into
three
categories;
Demographic
Data,
Consumer
Expenses,
or
Labor
Force.
These
categories
are
further
divided
into
other
areas
to
really
narrow
the
users
search.
This
allows
the
user
to
choose
exactly
which
part
of
the
demographic
report
they
would
like
to
see
as
a
visual
heat
map.
Image
30
is
a
heat
map
under
demographics
–
2014
Labor
Force
Status
was
selected
to
show
the
employment
participation
rate
in
the
area.
Based
on
the
density
the
user
can
conclude
which
properties
are
available
in
areas
that
have
a
high
or
low
participation
rate.
Image
31
shows
the
various
heat
map
options;
including
population,
age
distribution,
educational
attainment,
and
many
more.
24. PAGE | 23
Image
32:
Layers
Option
Image
33:
Layers
based
on
Local
Data
showing
Electoral
Divisions
Image
34:
Participation
Heat
Map
and
Electoral
Division
Layer
on
same
map
Another
option
on
Navigate
Newell
is
the
Layers
option,
image
32.
This
allows
the
user
to
add
a
layer
to
the
map
to
see
specific
boundaries
or
parcels
of
land.
In
this
case,
the
user
can
choose
from:
Local
Data,
Geography,
or
Transportation
–
which
are
all
further
divided
into
other
areas.
Local
Data
gives
the
user
the
chance
to
narrow
their
search
based
on
location.
By
showing
Electoral
Divisions
the
user
can
see
which
division
the
potential
property
is
located
in,
as
seen
in
image
33.
Users
can
also
select
more
than
one
layer
they
want
to
view.
This
is
also
useful
when
wanting
to
create
a
visual
with
Heat
Maps
and
Layers
seen
in
image
34.
Now
the
user
has
their
original
heat
map
option
with
their
selected
layers,
further
developing
their
search
and
giving
them
the
information
that
they
need
to
make
a
decision.
25. PAGE | 24
Image
35:
Great
Lakes
Bay
Prospector;
Radius
Business
Report
Image
36:
Business
Type
Data
Business
Data;
Report
Features
The
Great
Lakes
Bay
prospector
allows
the
user
the
ability
to
look
at
businesses
around
potential
property
locations
and
see
what
types
of
industries
are
there,
as
seen
in
image
35.
A
full
business
report
is
generated
based
on
the
selected
radius
search,
and
shows
all
the
business
types
in
the
area,
seen
in
image
36.
The
information
is
provided
by
Info
USA
from
August
2015.
This
report
also
shows
estimated
sales
of
the
companies
and
allows
the
user
to
search
within
each
category.
The
user
can
expand
the
tabs
to
see
other
businesses
in
the
business
types
tab
and
they
can
click
on
the
business
for
it
to
show
up
on
the
map,
this
is
done
through
the
radius
search.
26. PAGE | 25
Image
37:
Report
of
Consumer
Spending
based
on
Radius
of
10
miles.
Image
38:
Labour
Force
Report
Other
types
of
reports
that
can
be
beneficial
to
users
include
Consumer
Spending
and
Labour
Force
Activity
seen
in
image
37.
These
reports
show
2015
data
with
prospective
2020
data
from
Applied
Geographic
Solutions.
The
user
can
also
see
infographics
of
community
profiles.
The
great
feature
of
these
reports
is
the
visuals
that
they
provide.
This
includes
pie
charts
and
graphs,
also
giving
the
user
the
opportunity
to
see
the
data
presented
in
a
different
way.
If
this
is
something
that
the
user
finds
distracting
there
is
also
the
option
hide
them
and
only
the
data
will
be
listed.
Not
only
do
these
reports
allow
for
the
data
to
be
presented
in
another
way
but
the
user
can
also
pick
out
the
areas
of
the
chart
they
want
to
know
more
about.
Image
38
was
taken
out
of
the
labour
force
report.
27. PAGE | 26
Image
40:
Drive
Time
of
60
min.
perimeter
around
location.
Radius
and
Drive
Time
Another
stand
out
feature
on
the
Great
Lakes
Bay
prospector
is
the
ability
to
change
the
radius
from
distance
to
time
travelled.
This
allows
the
user
to
see
the
area
around
the
potential
location
by
travel
time
it
takes
to
get
there.
Instead
of
typing
the
miles
to
get
a
radial
distance,
the
user
can
type
in
the
minutes
to
get
a
drive
time
distance.
Image
39
demonstrates
the
representation;
average
time
to
get
to
work
is
60
minutes
–
a
useful
feature
for
a
potential
business
buyer.
This
will
then
generate
the
area
below
in
image
40.
This
generates
an
area
around
the
potential
location
of
a
maximum
driving
time
of
60
minutes.
The
best
part
about
this
feature
is
that
like
the
radius
feature
–
your
reports
will
also
be
based
off
of
the
highlighted
distance.
Allowing
the
user
to
see
not
only
the
different
business
data
available
in
the
time
selected
and
also
labour
force,
demographics,
and
consumer
reports
based
off
of
the
selected
area.
The
modification
of
these
reports
gives
the
user
a
lot
of
opportunity
to
see
the
different
types
of
resources
they
have
access
to
within
a
certain
distance
or
travel
time
of
their
potential
location.
A
feature
like
this
could
be
the
turning
point
for
a
buyer
between
one
location
and
the
other.
Image
39:
Drive
Time
Feature
28. PAGE | 27
Image
41:
Oregon
Prospector;
Comparing
Cities
Image
42:
Comparing
Communities
side
by
side
with
projected
analysis.
Comparing
Communities
and
Report
Generating
Creating
reports
based
on
the
specific
location
gives
the
user
a
lot
of
information
to
make
their
decision
on
whether
or
not
to
locate
in
a
certain
area.
To
expand
this
Zoom
Prospector
has
a
tool
to
compare
communities
this
is
seen
on
the
Oregon
Prospector.
This
allows
the
user
to
compare
data
on
different
communities
and
to
see
the
stats
side
by
side;
seen
in
image
42.
The
user
can
select
the
places
(or
addresses)
that
they
would
like
to
compare.
Then
the
tool
will
generate
a
report
based
on
all
of
the
information
the
site
has.
The
demographic
information
shows
both
the
2015
and
prospective
2020
data
along
with
both
cities
that
the
user
wants
to
compare.
Allowing
the
user
to
see
expected
future
population
and
statistics
could
also
determine
whether
or
not
they
will
buy
a
location.
Having
this
type
of
comparison
is
useful
to
the
user.
29. PAGE | 28
Image
43:
Community
Profile
Access
Image
44:
Portland,
OR
Inforgraphic,
click
on
the
image
above
or
this
link;
Portland,
OR
Community
Profile
to
see
the
full
graphic.
Comparing
cities
is
a
great
tool
if
a
user
is
deciding
between
two
specific
locations.
Another
tool
which
is
great
is
the
community
profiles.
Image
43
is
an
example
of
Portland,
OR.
The
user
can
select
the
city
they
wish
to
target
and
see
a
profile
of
the
information
for
the
location
as
a
whole.
This
provides
the
user
with
the
following:
A
community
profile
appears
as
an
infographic
image
44,
with
a
lot
of
important
information
about
the
community.
This
is
a
great
visual
way
to
draw
the
attention
of
the
user
and
also
for
the
user
to
get
a
summary
of
information.
This
infographic
ties
in
data
from
all
the
different
reports
into
one.
Although
this
is
a
good
summary
of
the
location,
a
more
proper
and
in
depth
analysis
would
be
done
by
accessing
the
reports
as
they
provide
more
in-‐‑depth
data.
30. PAGE | 29
Recommendations
For
recommendations
on
Phase
2
of
Oakville’s
Site
Selection
tool
we
can
start
by
looking
at
the
common
findings
of
the
webpage
reviews:
• Heat
Maps
• Report
Generating
• Radius
Searches
• 3D
Models
• Comparing
Cities
All
of
these
areas
are
things
should
be
looked
at
to
develop
Phase
2
of
Oakville’s
Site
Selection
tool.
The
ability
for
a
user
to
select
specific
categories
of
interest
allows
them
to
customize
their
search
and
benefit
more
from
Oakville’s
site
selection
tool.
This
can
be
done
with
the
ability
to
create
heat
maps
based
on
a
variety
of
different
density
aspects;
population,
average
income,
consumer
spending,
and
labour
force.
Having
this
type
of
feature
available
is
great
for
the
user
to
determine
where
the
best
location
is
and
to
then
look
for
available
properties.
Demographic
data
is
a
large
part
of
opening
a
business.
This
kind
of
data
could
be
very
useful
to
a
user
looking
to
open
up
a
business
in
Oakville.
A
cool
feature
would
be
to
show
a
summary
chart
or
graph
of
the
local
demographics.
This
can
further
build
report
building
on
Oakville’s
site
selection
tool.
Being
able
to
select
or
deselect
specific
data
the
user
can
include
in
their
report
is
also
a
great
feature
allowing
the
user
to
customize
their
findings.
Ability
to
share
the
reports
via
email
or
saving
features
like
PDF
is
great
to
keep
the
information
for
a
later
purpose.
The
radius
search
is
also
a
really
important
feature.
This
corresponds
with
the
drive
time
search
as
well.
Doing
a
radius
distance
search
from
a
potential
location
with
correspondence
to
data
is
important
when
looking
at
the
data
and
being
able
to
determine
if
the
area
itself
is
a
good
fit.
Drive
time
is
also
important
to
see
how
the
area
is
accessible
by
other
places,
potential
employees,
and
customers.
When
looking
at
the
webpage
reviews
many
of
the
3D
models
are
an
appealing
factor
to
the
users.
If
these
models
are
also
different
based
on
the
type
of
property
available
(building,
office,
land)
the
user
would
have
a
more
visual
basis
of
what
they
are
looking
at.
The
most
appealing
3D
feature
would
be
creating
a
realistic
view
of
a
city
will
attract
the
user
to
the
area,
creating
a
more
visual
relationship
for
them
to
envision
the
location.
Comparing
locations
is
a
great
feature
to
have
on
this
tool
so
that
the
user
can
determine
the
pros
and
cons
based
on
what
they
are
looking
for.
Oakville’s
site
selection
tool
could
benefit
from
being
able
to
compare
communities
or
areas
in
Oakville
with
others
to
help
the
user
determine
which
area
would
be
best
for
them.
Another
option
is
to
compare
BIAs
or
growth
areas
in
Oakville,
this
would
show
the
users
the
inner
development
and
business
opportunities
in
Oakville.