MQ-series SnO2 gas sensors were used in an electronic nose device to classify olive oil samples. Sinusoidal signals were generated to heat the sensor arrays. Analysis of the sensor response patterns using big data tools showed certain sensors could predict the response of others, allowing some sensors to be removed to reduce costs. Virgin olive oil and olive oil mixture samples were analyzed, with the virgin olive oil showing stronger distinguishing sensor responses in the Fourier analysis. This analysis demonstrated how hidden relationships between sensor responses in an IoT system can be identified to optimize the sensor configuration.
1. Spread the love
By Óscar Cuenca Roca
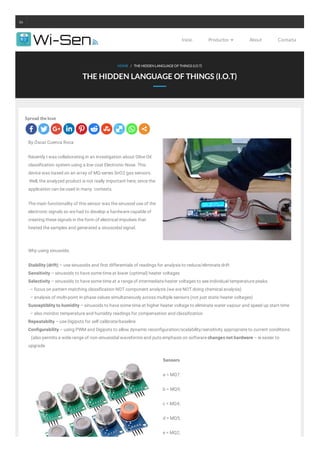
Recently I was collaborating in an investigation about Olive Oil
classification system using a low cost Electronic Nose. This
device was based on an array of MQ-series SnO2 gas sensors.
Well, the analyzed product is not really important here, since the
application can be used in many contexts.
The main functionality of this sensor was the sinusoid use of the
electronic signals so we had to develop a hardware capable of
creating these signals in the form of electrical impulses that
heated the samples and generated a sinusoidal signal.
Why using sinusoids.
Stability (drift) – use sinusoids and first differentials of readings for analysis to reduce/eliminate drift
Sensitivity – sinusoids to have some time at lower (optimal) heater voltages
Selectivity – sinusoids to have some time at a range of intermediate heater voltages to see individual temperature peaks.
– focus on pattern matching classification NOT component analysis (we are NOT doing chemical analysis)
– analysis of multi-point in-phase values simultaneously across multiple sensors (not just static heater voltages)
Susceptiblity to humidity – sinusoids to have some time at higher heater voltage to eliminate water vapour and speed up start-time
– also monitor temperature and humidity readings for compensation and classification
Repeatabilty – use Digipots for self calibrate/baseline
Configurability – using PWM and Digipots to allow dynamic reconfiguration/scalability/sensitivity appropriate to current conditions
(also permits a wide range of non-sinusoidal waveforms and puts emphasis on software changes not hardware – ie easier to
upgrade
Sensors
a = MQ7:
b = MQ9;
c = MQ4;
d = MQ5;
e = MQ2;
HOME / THE HIDDEN LANGUAGE OF THINGS (I.O.T)
THE HIDDEN LANGUAGE OF THINGS (I.O.T)
Inicio Productos About Contacta
2. f = MQ8;
g = MQ3;
h = MQ135
Sample chambers
Glass and are hermetically sealed with the air pump exhaust feeding back into the sample chamber to allow concentrations to
stabilize
Used: 1. Green Virgen Oil 2. Ybarra Olive Oil (blended) 3. Curry Powder
Shapes with grouped data of several components Grouped by type of
sensor and its phase.
According to this graph we can group the sensors according to their VOC signal in three groups.
Elephant shape MQ7, MQ9, MQ2, MQ135
Highest rate of ascent slope approx [85 – 110]
Highest rate of descendent slope approx [37 – 50]
Whale Tail Form MQ5, MQ4, MQ8
Highest rate of ascent slope approx [0 – 30]
3. Highest rate of descendent slope approx [40 – 110]
Pelican Head Shape MQ3
Highest rate of ascent slope approx [0 – 35]
Highest rate of descendent slope approx [85 – 110]
Could we save on cost and energy using less sensors ?.
Maybe we should look for more variety of sensors that give us more different results to have a greater range of shapes and therefore
to improve the fingerprint …
One of the arguments is MQ7, MQ9 and MQ135 had different heating schedules and therefore their responses will look similar to
each other, but very different to the other sensor responses. It is likely to be the small differences within the types that will really help
to classify results.
To get better understanding about this I decided to analyze the data using big data tools like Watson Analytics or…
Experiments with a heater cycle time of 224 seconds (8 seconds at each of 28 levels : PWM period = 30ms
Duty cycle varies from 6ms (20%) to 24ms (80%) to minimize stress on switch mode PSU
28 step simulated sinusoid, 4 readings at each step 67 PWM periods between readings so cycle time = 30ms*67*4*28 = approx
224 secs. Sample chambers
Glass and are hermetically sealed with the air pump exhaust feeding back into the sample chamber to allow concentrations to
stabilize
Used:
1. Green Virgen Oil
2. Ybarra Olive Oil (blended)
3. Curry Powder
Gas inlet and exhaust exposed to room air between samples, to flush
Readings are in 112 step cycles (4 at 2 second intervals at each of 28 different PWM settings). Each cycle starts on a “1000
value” record boundary.
Green oil connected during cycle 21xxx, removed at 28xxx,
ybarra at 37xxx, removed at 43xxx
curry at 54xxx, removed at 62xxx
empty enclosed at 82xxx, open at 107xxx
4. Sample of table
Total records analyzed in sample: 112112 x 8 = 896896
Some interesting observations.
The Pelican Head is the only group that obtains an
independent fingerprint of other sensors for the three
substances.
The shape of Elephant has responded inversely proportional
to the variation of the rate of Pelican Head Drop and almost
inversely proportional to the variation of the rate of descent
of Whale Tail
The rate of variation of Whale Tail and Pelican Head rise to a
high degree of correlation Data Analysis by type of
Substance and Sensor Characterization Virgin Olive Oil ID
[21001 – 28112]
Data Analysis by type of Substance
and Sensor Characterization Virgin
Olive Oil ID [21001 - 28112]
*Watson Analytics
The combination of MQ8 and MQ2 is a predictor of MQ5 with a predictive strength of 97%
The combination of MQ135 and MQ8 is a predictor of MQ5 with a predictive strength of 96%
The combination of MQ8 and MQ7 is a predictor of MQ5 with a predictive strength of 96%
The combination of MQ8 and MQ9 is a predictor of MQ5 with a predictive strength of 94%
The combination of MQ8 and MQ4 is a predictor of MQ5 with a predictive strength of 93%
MQ4 is a predictor of MQ5 with a predictive strength of 92%
The combination of MQ3 and MQ8 is a predictor of MQ5 with a predictive strength of 86%
MQ8 is a predictor of MQ5 with a predictive strength of 82%
The combination of MQ3 and MQ2 is a predictor of MQ5 with a predictive strength of 81%
What we can see that by observing the behavior of several convolutions we can predict MQ5. Therefore we can save a sensor within
our system. Apparently it does not seem like much, but in a network of thousands of sensors operating for 24 hours and
transmitting data, this can be converted into many thousands of euros of savings.
We are going to focus in Virgin Olive Oil and Olive oil Mixture
From here what we are going to do is to take each sensor data (Virgin Oil vs Mixture Oil) smooth / soften its function and visualize its
Fourier Spectrum and the residuals.
Let’s see the graphs of stronger one taking Pure Olive.
5. Conclusion
What we can observe here, is that starting from completely
different sets of data and that in principle do not have a visual
relationship, as you can see in the graphs, these can generate
predictions of other sets within the same system.
In this case, thanks to the information obtained from the use of
tools such as Watson Analytics we have been able to obtain
savings in a sensor system. This means that objects are related
to each other by information hidden from our senses.
Any system of sensorized objects must go through a previous
analysis of the data to determine the effectiveness of that
system, before proceeding with an installation as we can
generate significant savings.
UNIDADES DE NEGOCIO
Fábricas
Comercios
Edificios
Ciudades
Entornos
Infraestructuras
Salud
Vehículos
Agricultura
App Moviles
graciascontactar
Analizador Luz
Inicio
cloud-led-platform
The hidden language of things
(I.O.T)
TECNOLOGÍAS
Analizador Luz
App Moviles
Big Data
cloud-led-platform
Comunicación
Gestión de Activos
graciascontactar
Inicio
Seguridad
Sensores
The hidden language of things
(I.O.T)
AVISO LEGAL
Analizador Luz
App Moviles
Certificaciones
cloud-led-platform
Condiciones Comerciales
Datos de la empresa
graciascontactar
Inicio
Protección de Datos
The hidden language of things
(I.O.T)
EMPRESA
Analizador Luz
App Moviles
cloud-led-platform
Distribuidores
Filosofía de la Empresa
Fundadores
graciascontactar
Inicio
Quienes Somos
The hidden language of things
(I.O.T)
Developed by ThinkUp Themes Ltd. Powered by Wordpress.
![f = MQ8;
g = MQ3;
h = MQ135
Sample chambers
Glass and are hermetically sealed with the air pump exhaust feeding back into the sample chamber to allow concentrations to
stabilize
Used: 1. Green Virgen Oil 2. Ybarra Olive Oil (blended) 3. Curry Powder
Shapes with grouped data of several components Grouped by type of
sensor and its phase.
According to this graph we can group the sensors according to their VOC signal in three groups.
Elephant shape MQ7, MQ9, MQ2, MQ135
Highest rate of ascent slope approx [85 – 110]
Highest rate of descendent slope approx [37 – 50]
Whale Tail Form MQ5, MQ4, MQ8
Highest rate of ascent slope approx [0 – 30]](data:image/gif;base64,R0lGODlhAQABAIAAAAAAAP///yH5BAEAAAAALAAAAAABAAEAAAIBRAA7)