1. Nicola Allen1
, Franz Pichler2
and Professor Sam Salek3
Purpose of Study
Aims
Patient access to new medicines varies between countries, resulting in inequities.
This study aims to:
• Characterise the agencies and systems involved in evaluation and decision
making from licensure to reimbursement
• Develop a systematic method to enable comparison between these systems
Objectives
Create a systematic map of the process that a new medicine undergoes from
market authorisation to market access in order to enable comparison between
the systems of different countries
To achieve this objective:
• Identify the organisations involved in the process from market authorisation
to market access
• Establish how the organisations interact with each other and with the sponsor
• Identify key milestones and activities involved in the systems and processes
from marketing to reimbursement
• Produce a visual method for the systemic comparison across the different
systems
Background
All new medicines need to be granted marketing approval by a regulatory
authority before they can be accessed by patients. Licensing approval is based
on safety, efficacy and quality.
National health providers then decide if they should purchase the new medicine.
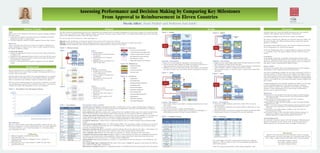
There has been an increasing interest in using Health Technology Assessments
(HTAs) to determine if new medicines should be reimbursed (e.g. Figure 1).
The process from marketing approval to the decision to reimburse a new medi-
cine, including where and how HTA is included in this process, varies between
countries and could be affecting patients’ access to new medicines.
HTA definition
HTAs are “a form of policy research that systematically examines the short- and
long-term consequences, in terms of health and resource use, of the application
of a health technology, a set of related technologies or a technology related
issue” (Henshall et al, 1997)
Australia – Description
• Almost 70% of total healthcare expenditure is government funded
• The key decision maker (Minister for Health and Ageing) is advised by an
independent statutory body that meets three times annually
• Medicines that cost more than $5m annually require finance and administra-
tion approval. When costs exceed $10m, Cabinet consideration is required
Canada – Description
• The Canadian system is more similar to European models than the United
States system
• No national insurance
• Each Province provides a publicly funded drug plan
• HTAs produced for the Canadian Agency for Drugs and Technologies in
Health influence province decisions (except for Quebec)
England – Description
• England has the world’s largest public funded National Health Service (NHS);
The Department of Health decides HTA topics
• HTAs, performed by external sources for the National Institute for Health and
Clinical Excellence, influence reimbursement decision makers
• There are limits in place to control the return on capita to help control NHS
expenditure
France – Description
• France has a public healthcare system that is mostly (75%) covered by
national insurance
• The Transparency Commission (TC) produces HTAs for HAS which is a deci-
sion recommender
• France has a system to incorporate coverage with evidence development (CED)
• Reimbursement decision is reevaluated five years after marketing
Discussion
Systematic maps were created that identify the process that a new medicine
undergoes from regulatory approval through to reimbursement.
Considerable variability between the eleven countries was identified.
The extent to which the key milestones are connected varies from within a sin-
gle agency through to the different milestones being conducted by separate
agencies or committees.
The position of HTA within the process, the evaluation methods used and the
level of independence all varied between agencies.
As the four example maps show, to compare different countries access process-
es, a systematic analysis that captures different elements within the system is
needed.
Conclusion
By developing a framework of systematic characterisation of the processes
involved in obtaining reimbursement for new medicines, this study makes pos-
sible future projects that would compare these agencies, such as an analysis of
time taken to achieve reimbursement in different nations.
Future studies
This project was primarily aimed at developing appropriate process mapping
methodology to allow comparison between diverse systems.
Now that the methodology is defined, the next stage of this project could be to
extend the number of countries that have been mapped. This might be particu-
larly useful for projects aimed at harmonising or aligning parts of these projects
such as EUnetHTA project in Europe. In addition, mapping of emerging markets
could be very beneficial due to the limited information currently available about
these systems.
A potential application of the systematic mapping is the ability to use the maps
to define meaningful milestones for the purpose of timeline comparison
between different countries. Such milestones would enable peer comparison
leading to a better understanding of why some countries reimbursement
processes may be quicker than others.
References
Drummond M et al. Key principles for the improved conduct of health technology
assessments for resource allocation decisions. Int J Technol Assessment Health
Care. 2008;24:244-258.
European Network for Health Technology assessment. 2010. Available at:
www.eunethta.net. Accessed March 3, 2010.
National Institute for Health and Clinical Excellence. Guide to the single technology
appraisal process. 2009.
Henshall C et al. Priority setting for health technology assessment: theoretical consid-
erations and practical approaches. Int J Technol Assessment Health Care. 1997;
13:144-185.
Thomson Reuters. 2010. IDRAC database. Available at: http://www.idrac.com.
Accessed February 20, 2010.
Velasco-Garrido M, Busse R. 2005. Policy Brief, Health technology assessment: An
introduction to objectives, role of evidence, and structure in Europe. The
European observatory on health systems and policies. 2005;18-19.
Acknowledgements
We would like to thank the support of Dr Neil McAuslane (CMR International
Institute for Regulatory Science) and the advice of all the people from the
different agencies who provided their time and insight into this project.
Disclosures
Author(s) of this presentation have the following to disclose concerning
possible financial or personal relationships with commercial entities that may
have a direct or indirect interest in the subject matter of this presentation:
Nicola Allen: Nothing to disclose
Franz Pichler: Nothing to disclose
Sam Salek: Nothing to disclose
Assessing Performance and Decision Making by Comparing Key Milestones
From Approval to Reimbursement in Eleven Countries
Figure 1. The formation of new HTA agencies in Europe.
Nicola Allen
Undergraduate Student
Cardiff University
allenna@cardiff.ac.uk
Figure 2. Model process map.
Step 1.
• Identify agencies
• Determine the connections between
the agencies
• Understand the level of sponsor
involvement
• Highlight sponsor involvement and
order of steps taken
Step 2.
• Identify key milestones
• Establish where each milestone
occurs within process
• Create a symbol to represent each
key milestone
• Add symbols to show where the
milestones occur
Step 3.
• Identify key activities
• Design an icon to represent each
key activity
• Determine where each activity is
performed
• Add key activity symbols to the
process maps
Figure 3a. Process key.
Figure 3c. Activities key.
Figure 3b. Milestones key.
The HTA systems and reimbursement processes were characterised and evaluated in eleven countries. Information for each of these countries was sourced from pub-
lished sources (see references), the IDRAC regulatory database, government and private agency websites (Table 1), the ISPOR Global Health Care Systems Road Map
Project (www.ISPOR.org) and direct contact with agency officials.
The process maps were constructed in a three steps (Figure 2).
Step one was the identification of all agencies involved in the process and how they were connected.
Step two overlaid the key milestones onto the different agencies in order to represent where the major milestones occurred in the system.
Step three was the identification and subsequent indication of the predetermined key activities for each agency.
Descriptions of key activities
Scientific advice (SA): Highlights organisations that offer a scientific advice service, usually to pharmaceutical companies or
device manufacturers. This service is often requested before an application to ensure the correct information or evidence is
being collected. There is usually a fee for this service.
Joint scientific advice (JSA): Joint scientific advice programs have been established within some of the systems evaluated in this
project. The JSA meetings are held with the sponsor and the agencies who have agreed to offer the combined service.
Coverage with evidence development (CED): CED is a method that allows only the provisional availability of a new health tech-
nology. During this time period evidence is collected to establish whether full coverage should be granted. As stated by
Drummond et al. (2008) “CED can be seen as a means of implementing EBM in a real-world setting.”
Cost effective analysis (CE): A method used to compare the financial costs of a health technology with the predicted health
benefits.
Evidence based medicine (EBM): Sackett et al. (1996) describes EBM as “the conscientious, explicit, and judicious use of current
best evidence in making decisions about the care of individual patients.” Evidence-based medicine can incorporate clinical,
economic and political information.
Randomised controlled trials (RCT): A quantitative study that randomly allocates the subjective into either a control group or an
intervention group. The control group may be a placebo or the current standard method of intervention.
Active comparative trials (ACT): An ACT will compare the properties of a specific drug against other active agents.
Comparative effectiveness research (CER): CER gathers evidence to inform health-care decisions by establishing which interven-
tion offers the most benefit and for which populations. CER uses research from head-to-head clinical trials but may also
include information from systematic reviews of existing evidence (AHRQ 2010).
Clinical guidelines (CG): Clinical guidelines are created as a recommendation for the best treatment or care available for a spe-
cific indication.
Price setting/ Budget impact consideration ($): This symbol will be used to highlight the agencies in each system that will form
price setting and budget impact considerations.
Patient advocacy committee (P):Agencies or organisations that have an established system for involving patient views and opinions.
Methods Results
Figure 4. Australia.
Figure 5. Canada.
Figure 6. England.
Figure 7. France.
Table 2. Comparison of Activity Table 3. Resourcing
The annual budget and number of permanent staff (expressed as full time
employees – FTEs) are shown in Table 3 to help understand the differences
between HTA agencies.
Some of the agencies listed partake in other activities additional to HTA.
Table 1. Source Websites
Affiliations
1. MPharm Programme, Cardiff University, Wales
AllenNA@cardiff.ac.uk
2. CMR International Institute for Regulatory Science, London, UK
fpichler@cmr.org
3. WSP Centre for Socioeconomic Research, Cardiff University, Wales
SalekSS@cardiff.ac.uk