Neil Bradshaw earns 90% on business exam
•
0 likes•158 views

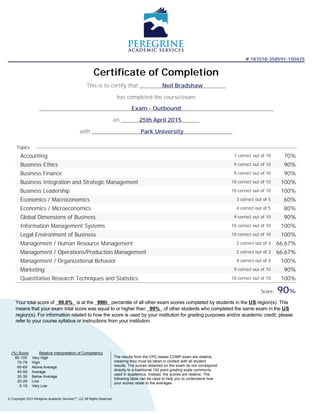
Neil Bradshaw completed an exam through Park University on April 25, 2015. He scored 90% overall on the exam covering various business topics. His highest scores were in Business Integration and Strategic Management, Business Leadership, Information Management Systems, Legal Environment of Business, Organizational Behavior, and Quantitative Research Techniques and Statistics where he scored 100% in each topic. His lowest scores were in Economics/Macroeconomics and Operations/Production Management where he scored 60% and 66.67%, respectively. His total score of 90% was in the 99th percentile compared to other students in the US who took the same exam.

Recommended
More Related Content
Similar to Neil Bradshaw earns 90% on business exam
Similar to Neil Bradshaw earns 90% on business exam (20)
Neil Bradshaw earns 90% on business exam
- 1. # 187018-358591-150425 Certificate of Completion This is to certify that Neil Bradshaw has completed the course/exam Exam - Outbound on 25th April 2015 with Park University Topics Accounting 7 correct out of 10 70% Business Ethics 9 correct out of 10 90% Business Finance 9 correct out of 10 90% Business Integration and Strategic Management 10 correct out of 10 100% Business Leadership 10 correct out of 10 100% Economics / Macroconomics 3 correct out of 5 60% Economics / Microeconomics 4 correct out of 5 80% Global Dimensions of Business 9 correct out of 10 90% Information Management Systems 10 correct out of 10 100% Legal Environment of Business 10 correct out of 10 100% Management / Human Resource Management 2 correct out of 3 66.67% Management / Operations/Production Management 2 correct out of 3 66.67% Management / Organizational Behavior 4 correct out of 4 100% Marketing 9 correct out of 10 90% Quantitative Research Techniques and Statistics 10 correct out of 10 100% Score: 90% Your total score of 90.0% is at the 99th percentile of all other exam scores completed by students in the US region(s). This means that your exam total score was equal to or higher than 99% of other students who completed the same exam in the US region(s). For information related to how the score is used by your institution for grading purposes and/or academic credit, please refer to your course syllabus or instructions from your institution. (%) Score Relative Interpretation of Competency 80-100 Very High 70-79 High 60-69 Above Average 40-59 Average 30-39 Below Average 20-29 Low 0-19 Very Low The results from the CPC-based COMP exam are relative, meaning they must be taken in context with all student results. The scores obtained on the exam do not correspond directly to a traditional 100 point grading scale commonly used in academics. Instead, the scores are relative. The following table can be used to help you to understand how your scores relate to the averages. © Copyright 2015 Peregrine Academic Services™, LLC All Rights Reserved.
- 2. Subject Level Analysis Outbound Exam - Outbound Completed: 25th April 2015 Score: 90% Outbound Accounting Accounting Data Analysis 2/3 = 66.67 Financial Statement Analysis 1/1 = 100.00 Interest, Income, and Debt 1/1 = 100.00 Journal Entries 3/5 = 60.00 Average: 70.00% Business Ethics Corporate Ethics and Climate 3/4 = 75.00 Discrimination 1/1 = 100.00 Ethical Climate 2/2 = 100.00 Ethical Decision-Making 2/2 = 100.00 Ethical Standards 1/1 = 100.00 Average: 90.00% Business Finance Balance Sheets and Financial Statements 1/1 = 100.00 Business Analysis Ratios and Calculations 2/2 = 100.00 Interest and Dividends 3/3 = 100.00 Profit, Loss, Cash Flow, and Margins 1/2 = 50.00 Stocks and Bonds 2/2 = 100.00 Average: 90.00% Business Integration and Strategic Management Competition 1/1 = 100.00 Corporate Strategies 4/4 = 100.00 Diversification 3/3 = 100.00 Strategic Planning and Decision-Making 2/2 = 100.00 Average: 100.00% Business Leadership Assessing Leadership Styles 2/2 = 100.00 Building and Leading Teams 1/1 = 100.00 Control and Types of Leader Power 2/2 = 100.00 Employee Development 1/1 = 100.00 Employee Motivation and Rewards 2/2 = 100.00 Models of Leadership 2/2 = 100.00 Average: 100.00% Macroconomics Economics Trends and Forecasting 2/3 = 66.67 Interest Rates, Investment, and Fiscal Policy 1/1 = 100.00 International Trade 0/1 = 0.00 Average: 60.00% Microeconomics Microeconomic Trends and Analysis 2/3 = 66.67 Spending and Saving 1/1 = 100.00 Supply and Demand 1/1 = 100.00 Average: 80.00% Global Dimensions of Business Foreign Direct Investment and Trade 3/3 = 100.00 International Corporate Strategies 1/2 = 50.00 International Governance and Regulation 1/1 = 100.00 International Patents and Protections 1/1 = 100.00 Multinational Culture 3/3 = 100.00 Average: 90.00% Information Management Systems Data and Information 2/2 = 100.00 Executive and Decision-Support Systems 2/2 = 100.00 Information Management Processes and Procedures 3/3 = 100.00 Simulation Analysis 1/1 = 100.00 Software and Hardware 2/2 = 100.00 Average: 100.00%
- 3. * Legal Environment of Business Civil and Criminal Processes 1/1 = 100.00 Consumer Protection 3/3 = 100.00 Legal Agreements and Documents 2/2 = 100.00 Liability 4/4 = 100.00 Average: 100.00% Human Resource Management HR Planning 1/1 = 100.00 Recruiting and Retention of Employees 0/1 = 0.00 Staffing Decisions 1/1 = 100.00 Average: 66.67% Operations/Production Management Data Analysis Tools 0/1 = 0.00 Quality Management 2/2 = 100.00 Average: 66.67% Organizational Behavior Corporate Culture and Climate 1/1 = 100.00 Organizational Charts and Structure 2/2 = 100.00 Organizational Mission, Vision, and Values 1/1 = 100.00 Average: 100.00% Marketing People 3/3 = 100.00 Place 1/2 = 50.00 Price 3/3 = 100.00 Product 1/1 = 100.00 Promotion 1/1 = 100.00 Average: 90.00% Quantitative Research Techniques and Statistics Descriptive Statistics 2/2 = 100.00 Hypothesis Testing 2/2 = 100.00 Population Sampling 1/1 = 100.00 Probability 1/1 = 100.00 Type I and Type II Errors 4/4 = 100.00 Average: 100.00% Frequency of Questions Correct. The frequency of questions correct is calculated for each subject within a CPC topic. The formula is: Number of Questions Correct / Number of Questions Offered) * 100.