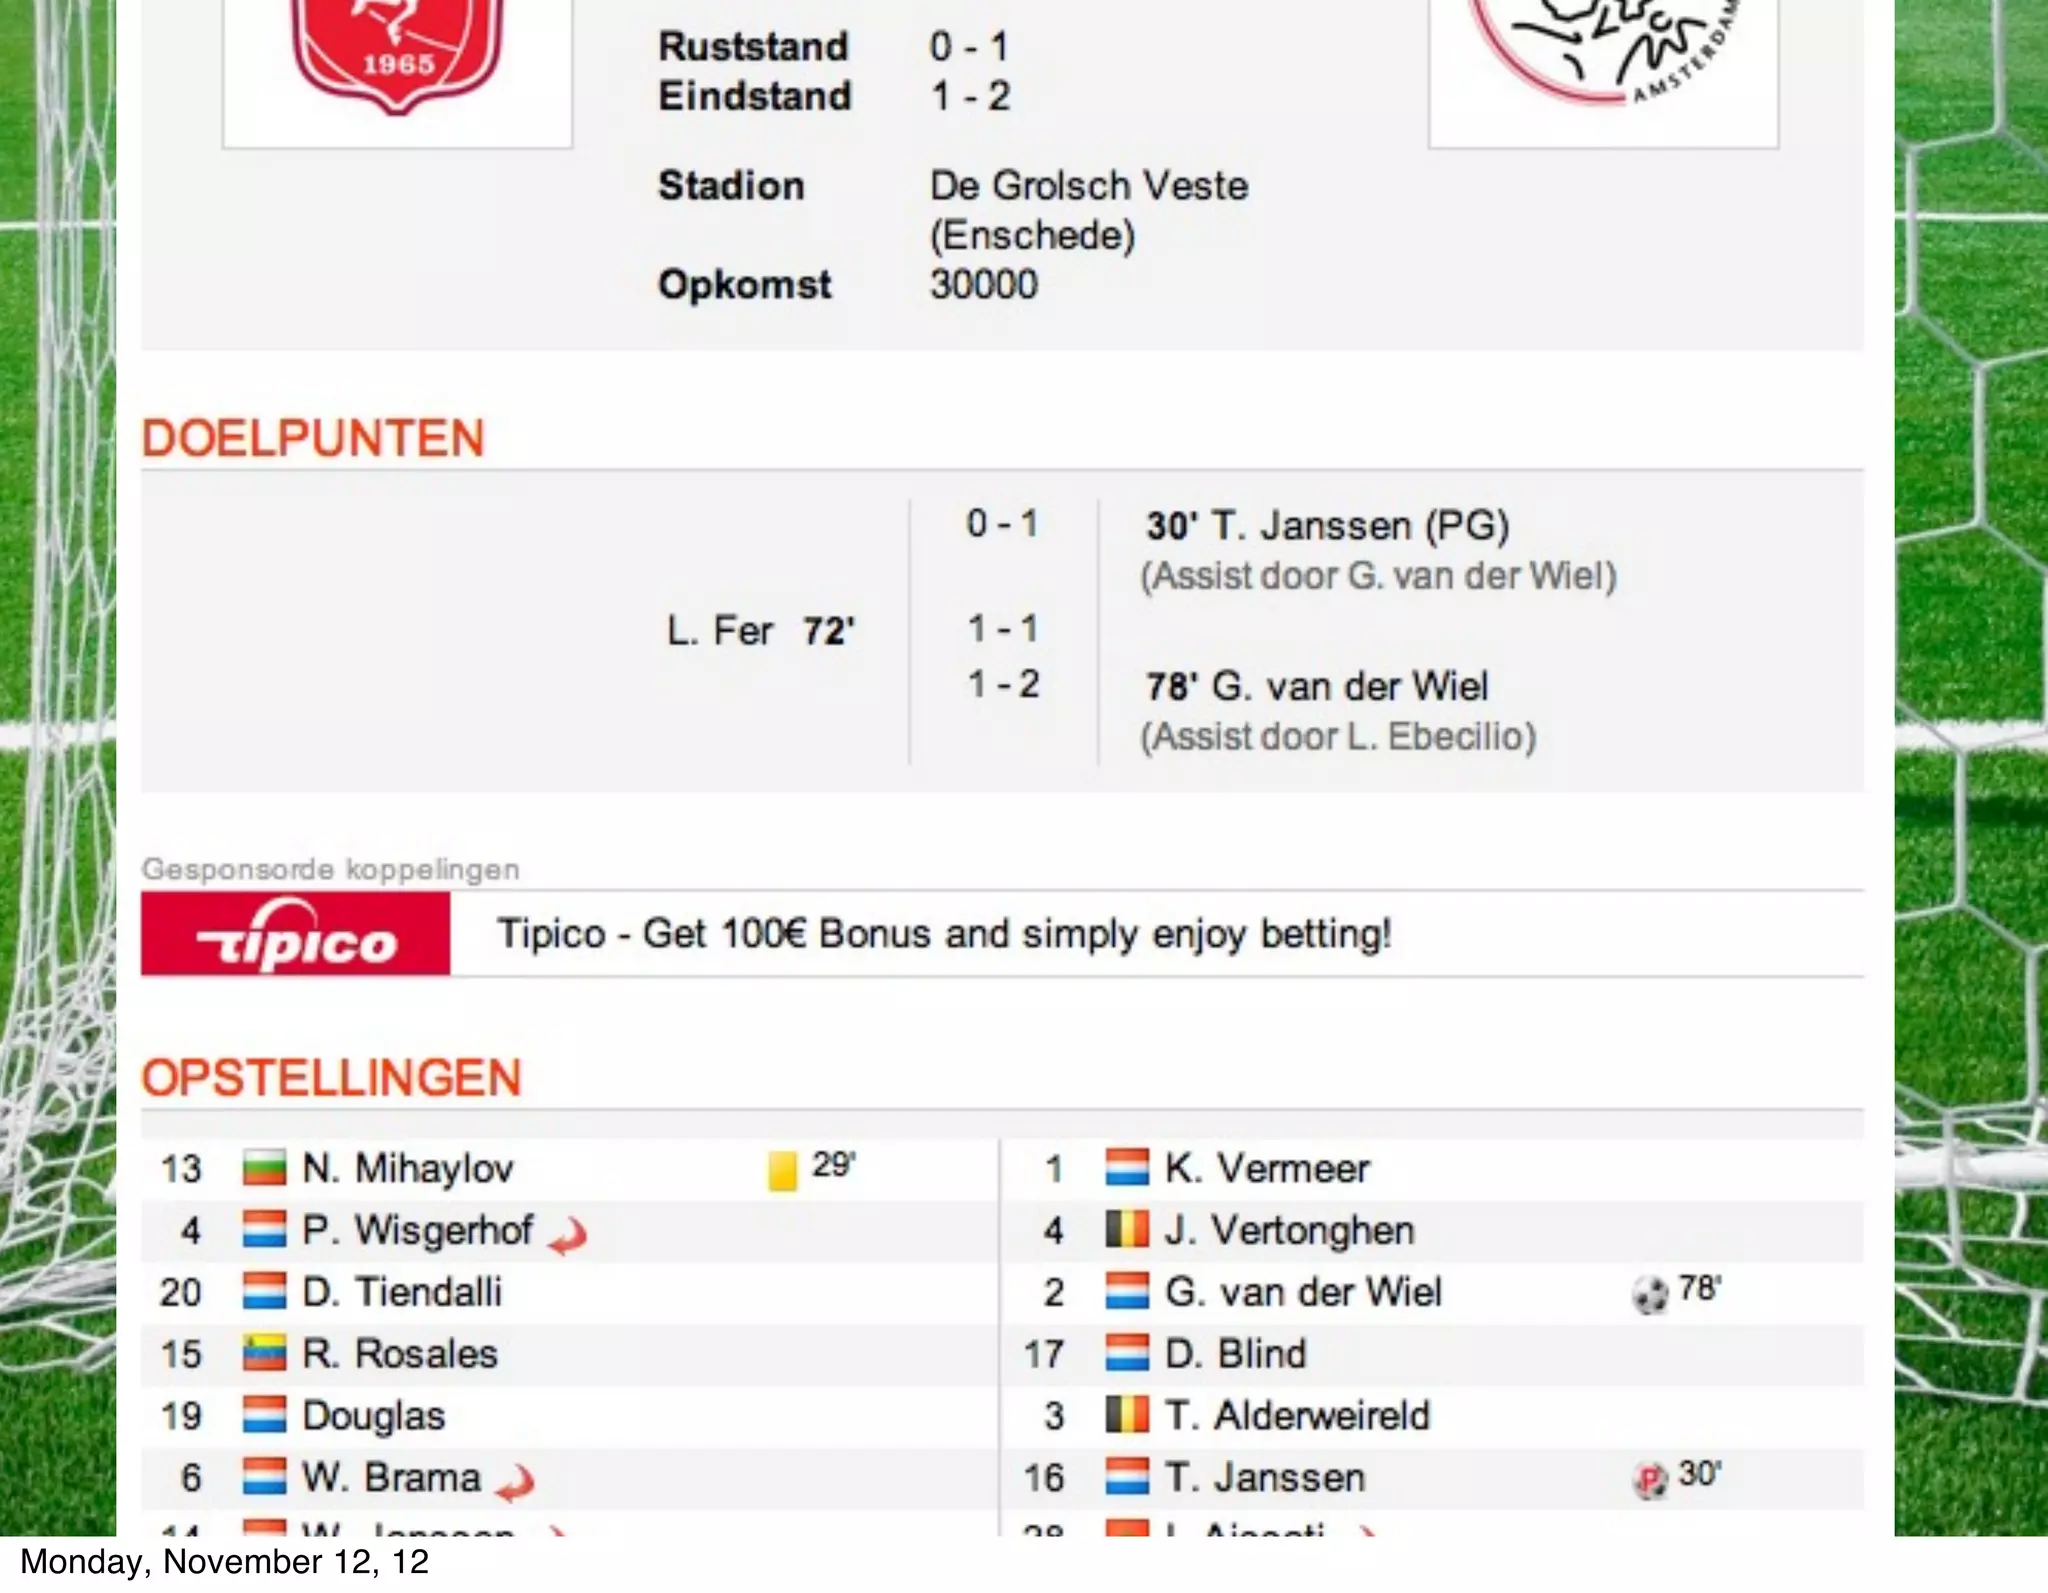
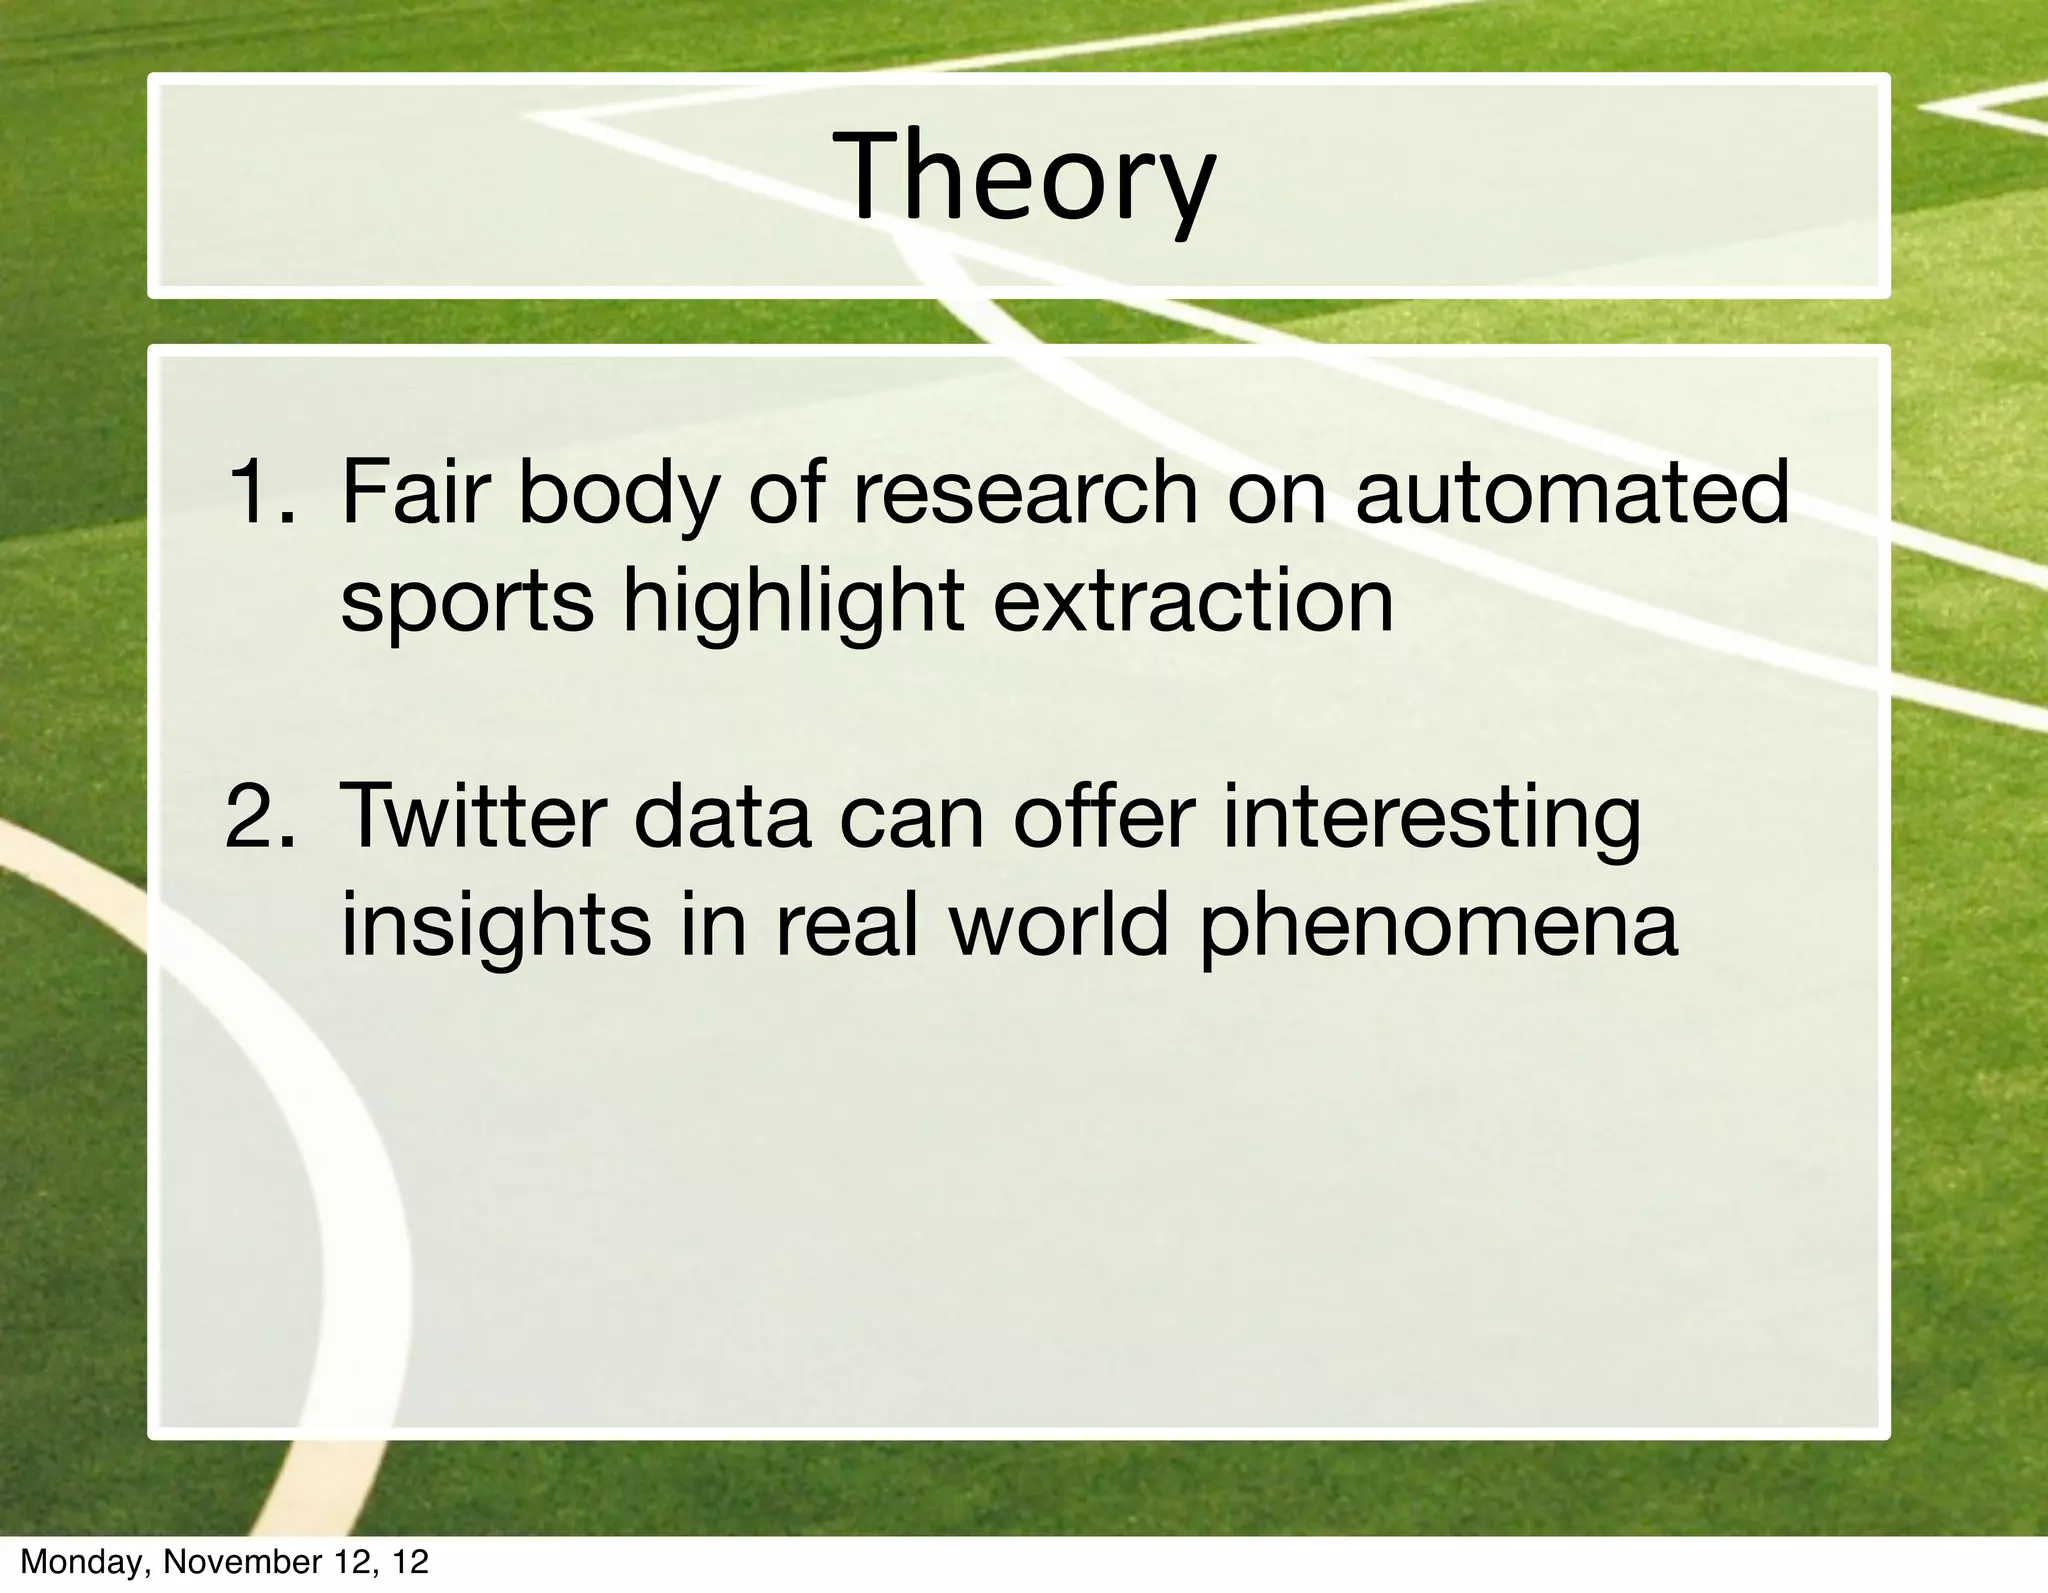
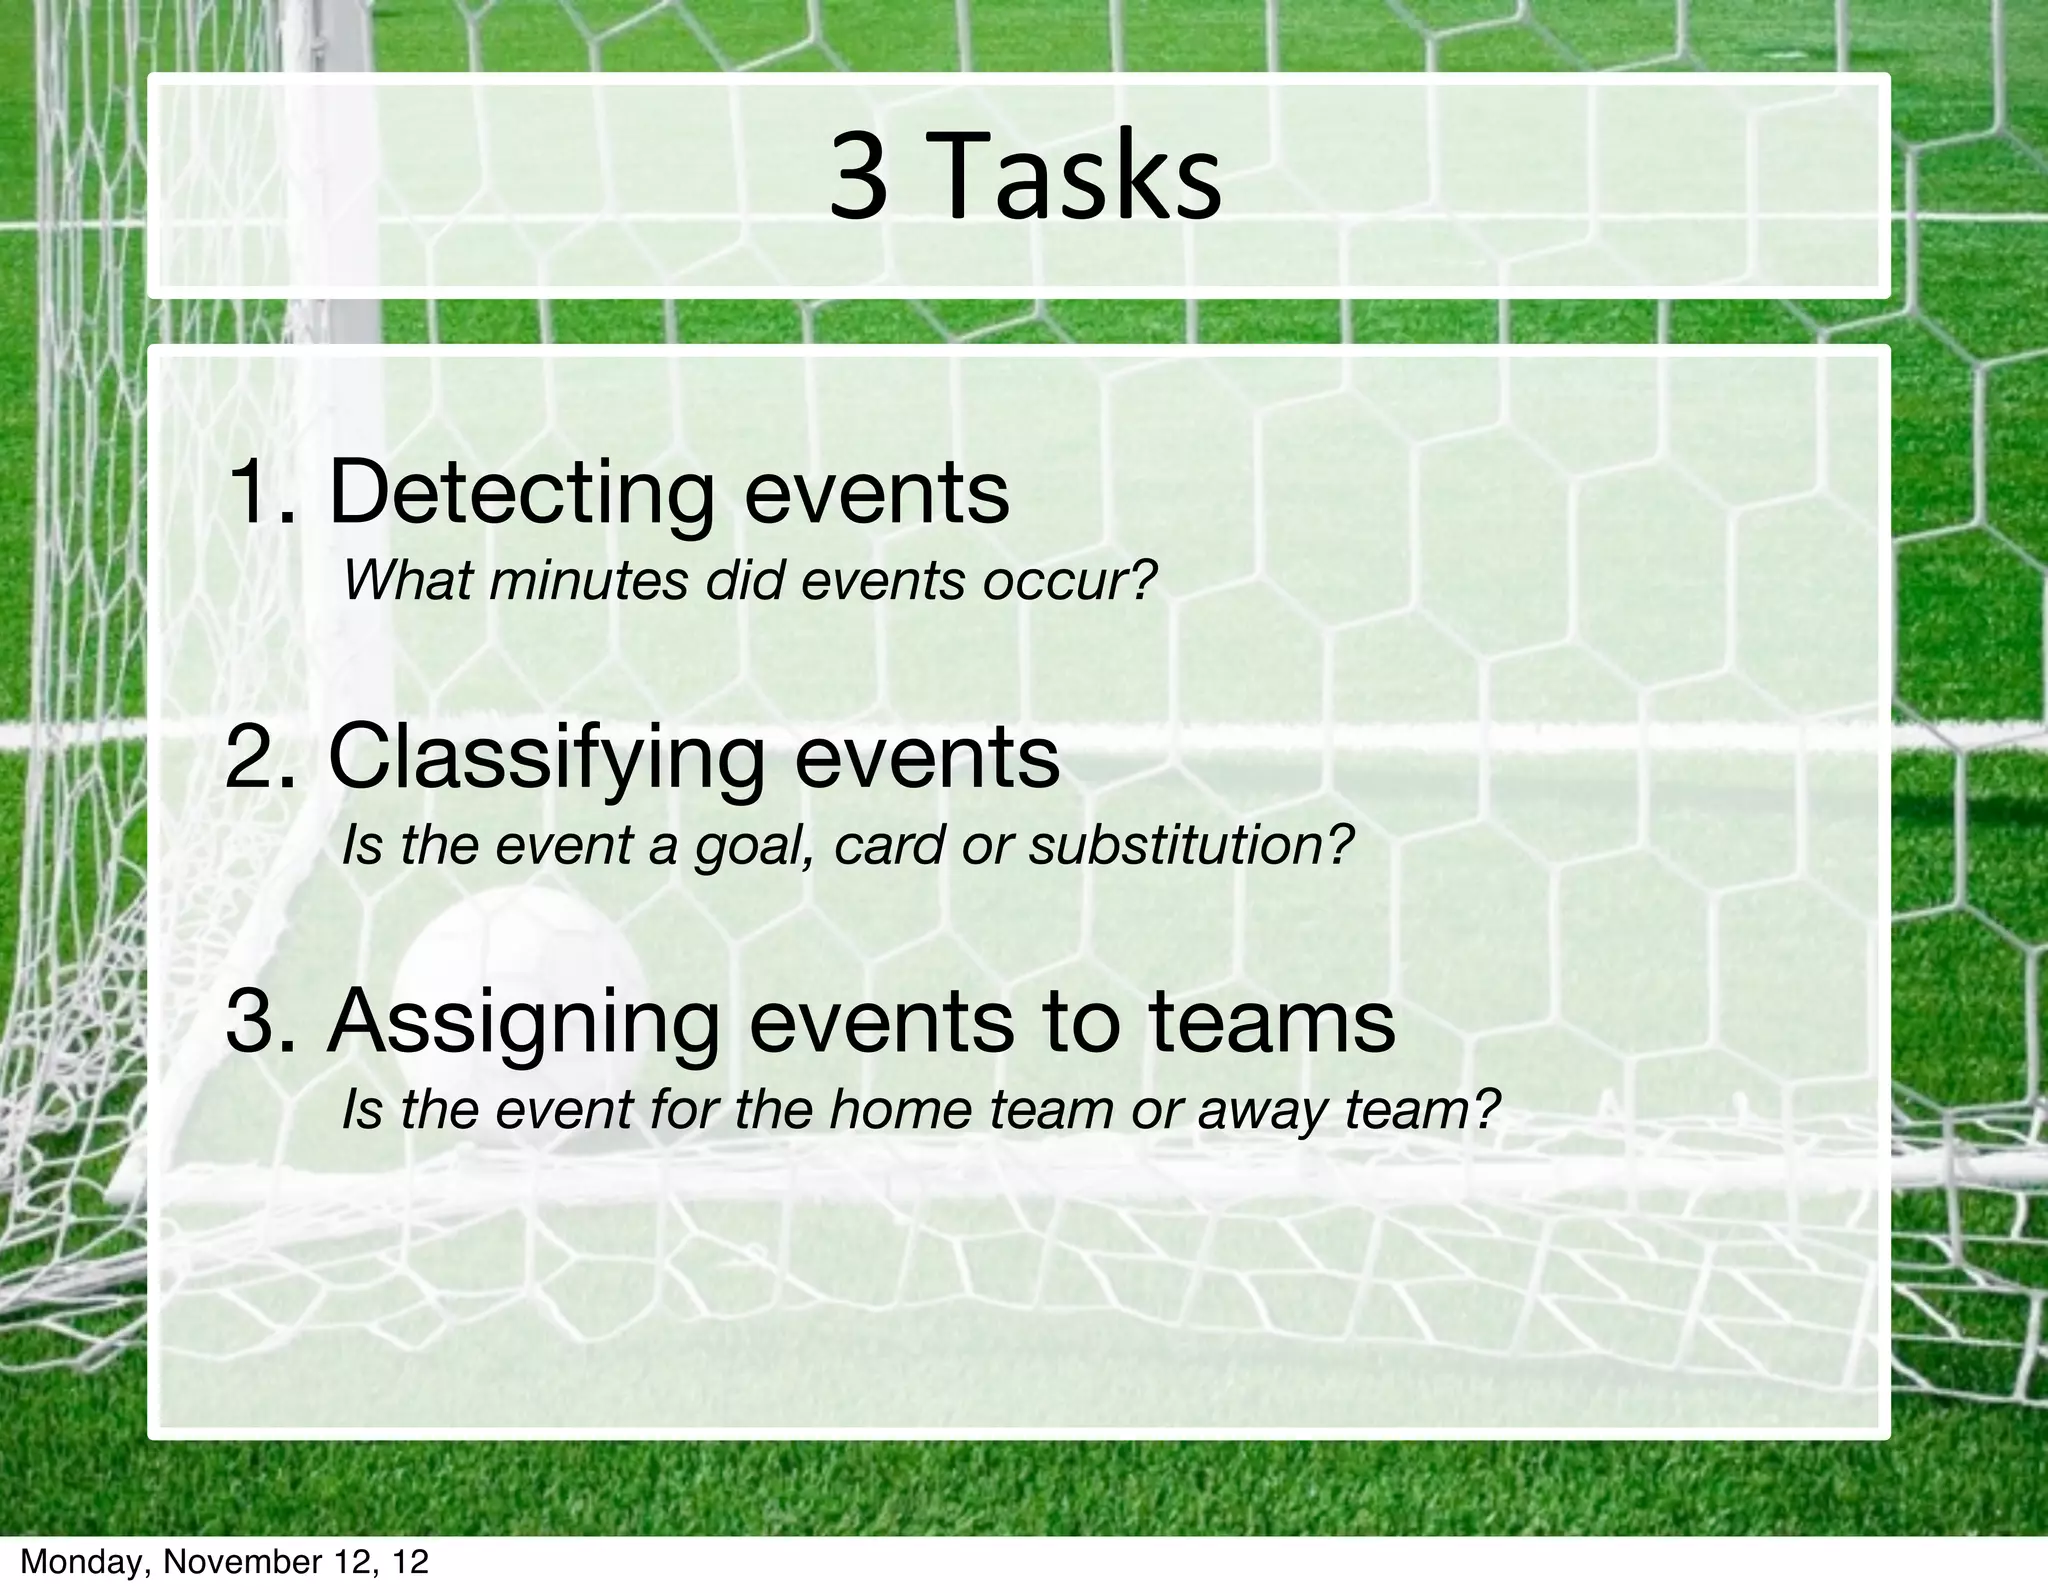
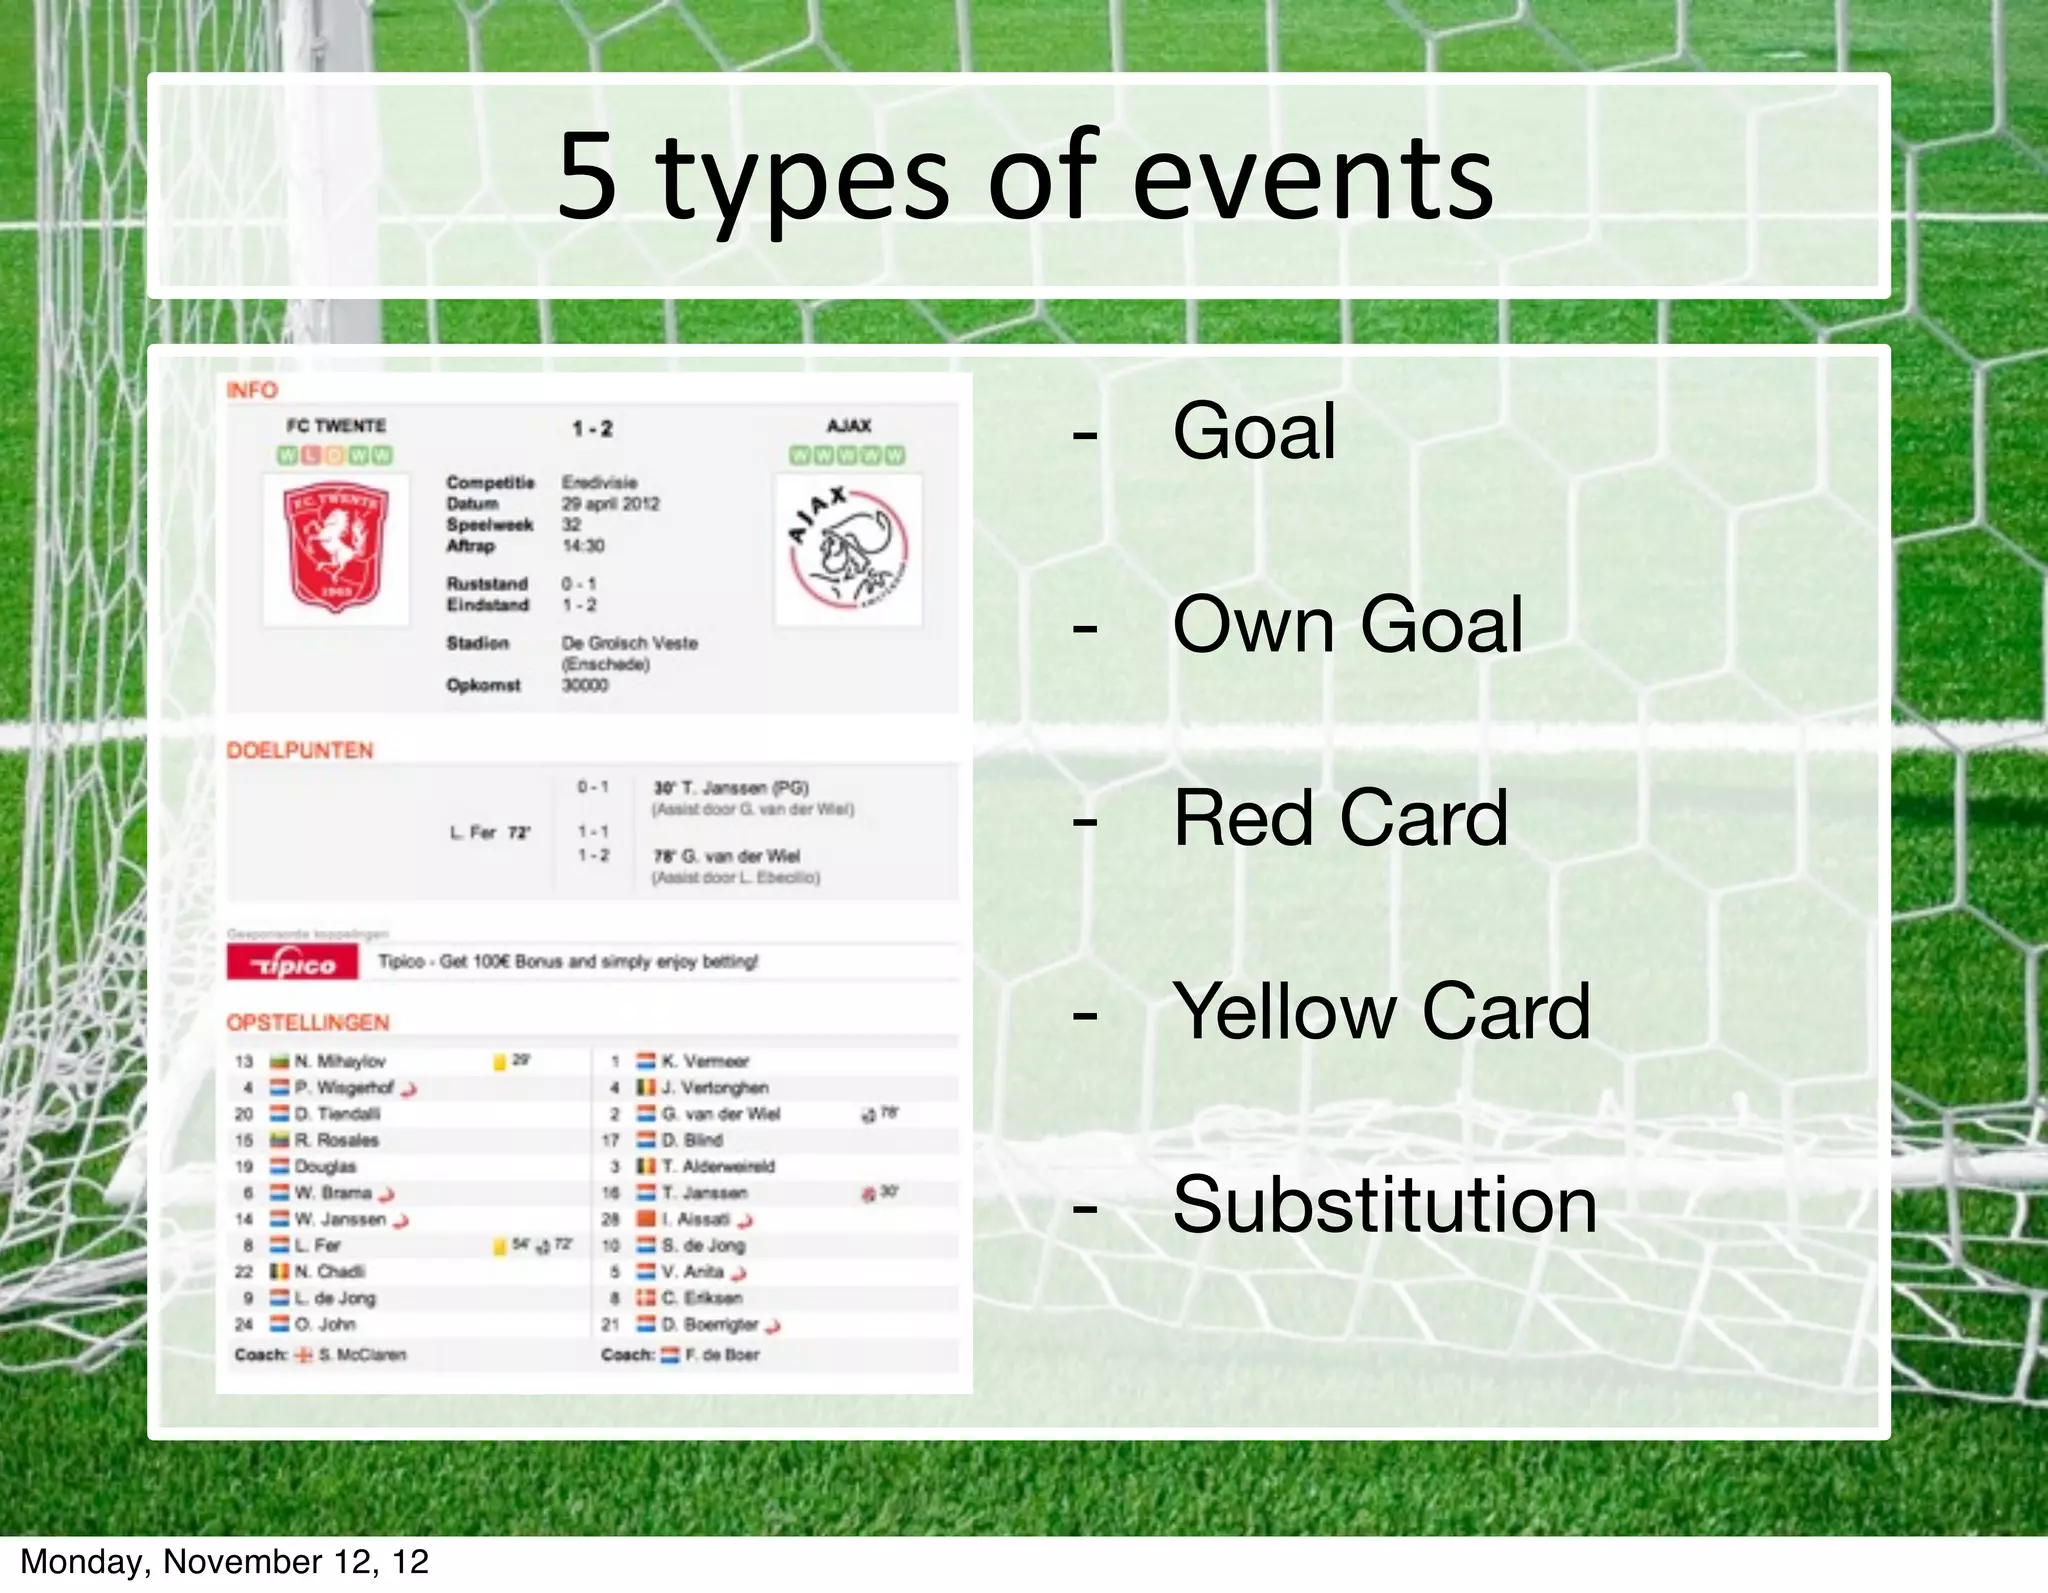
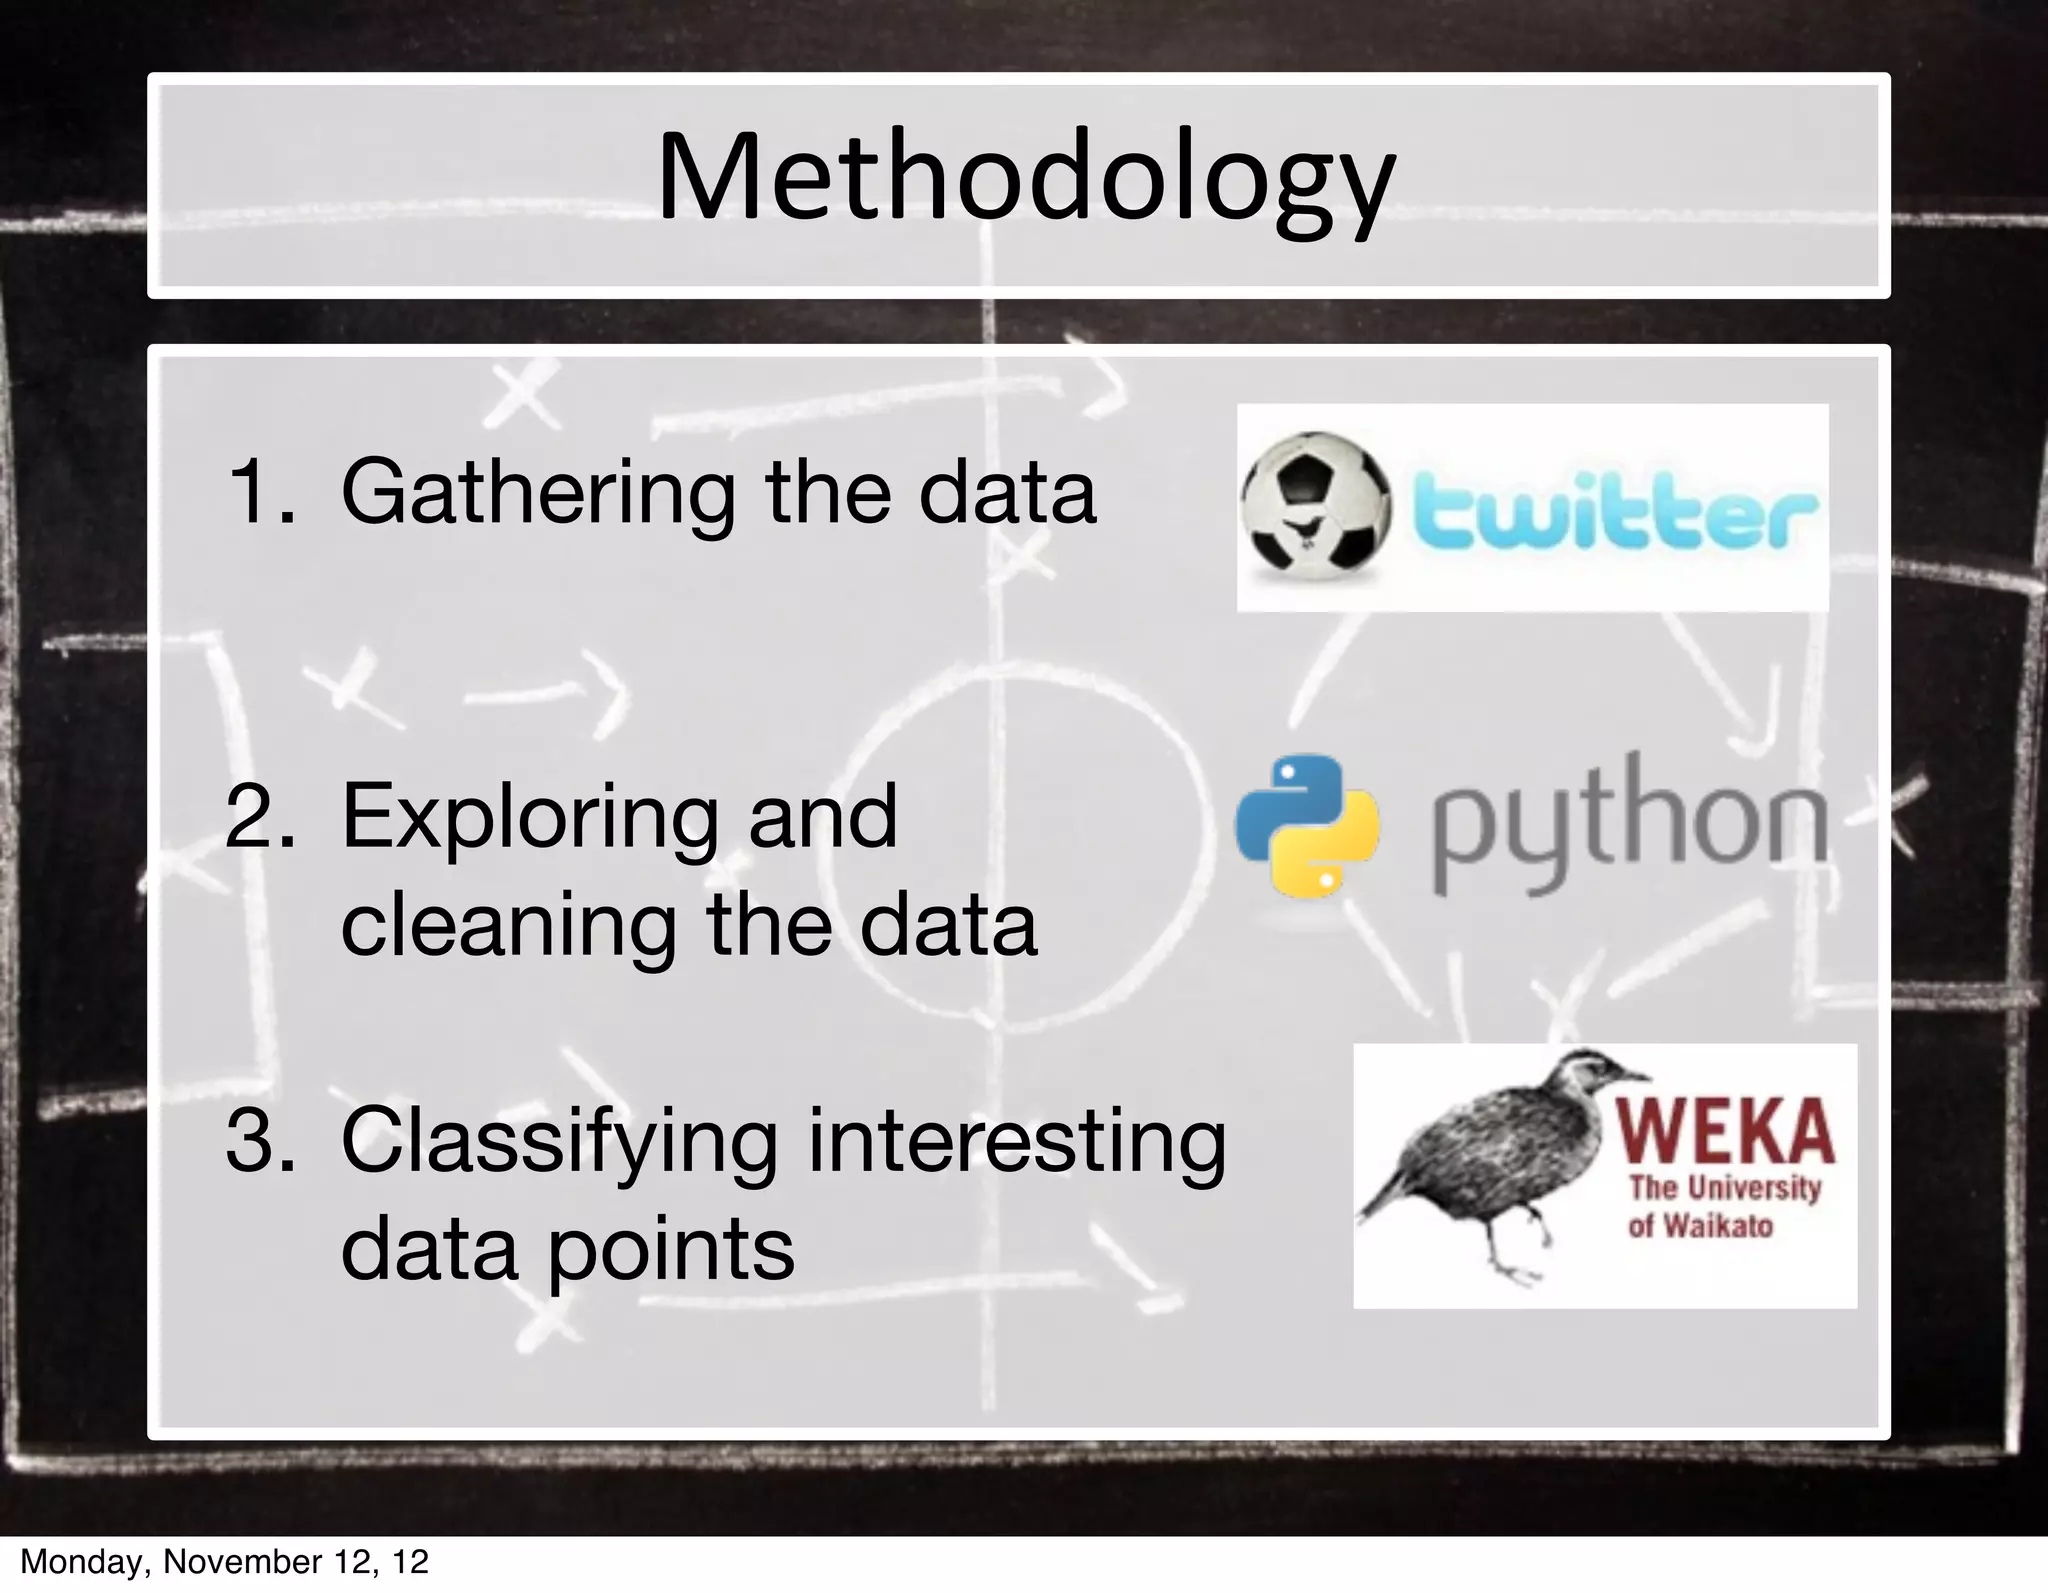
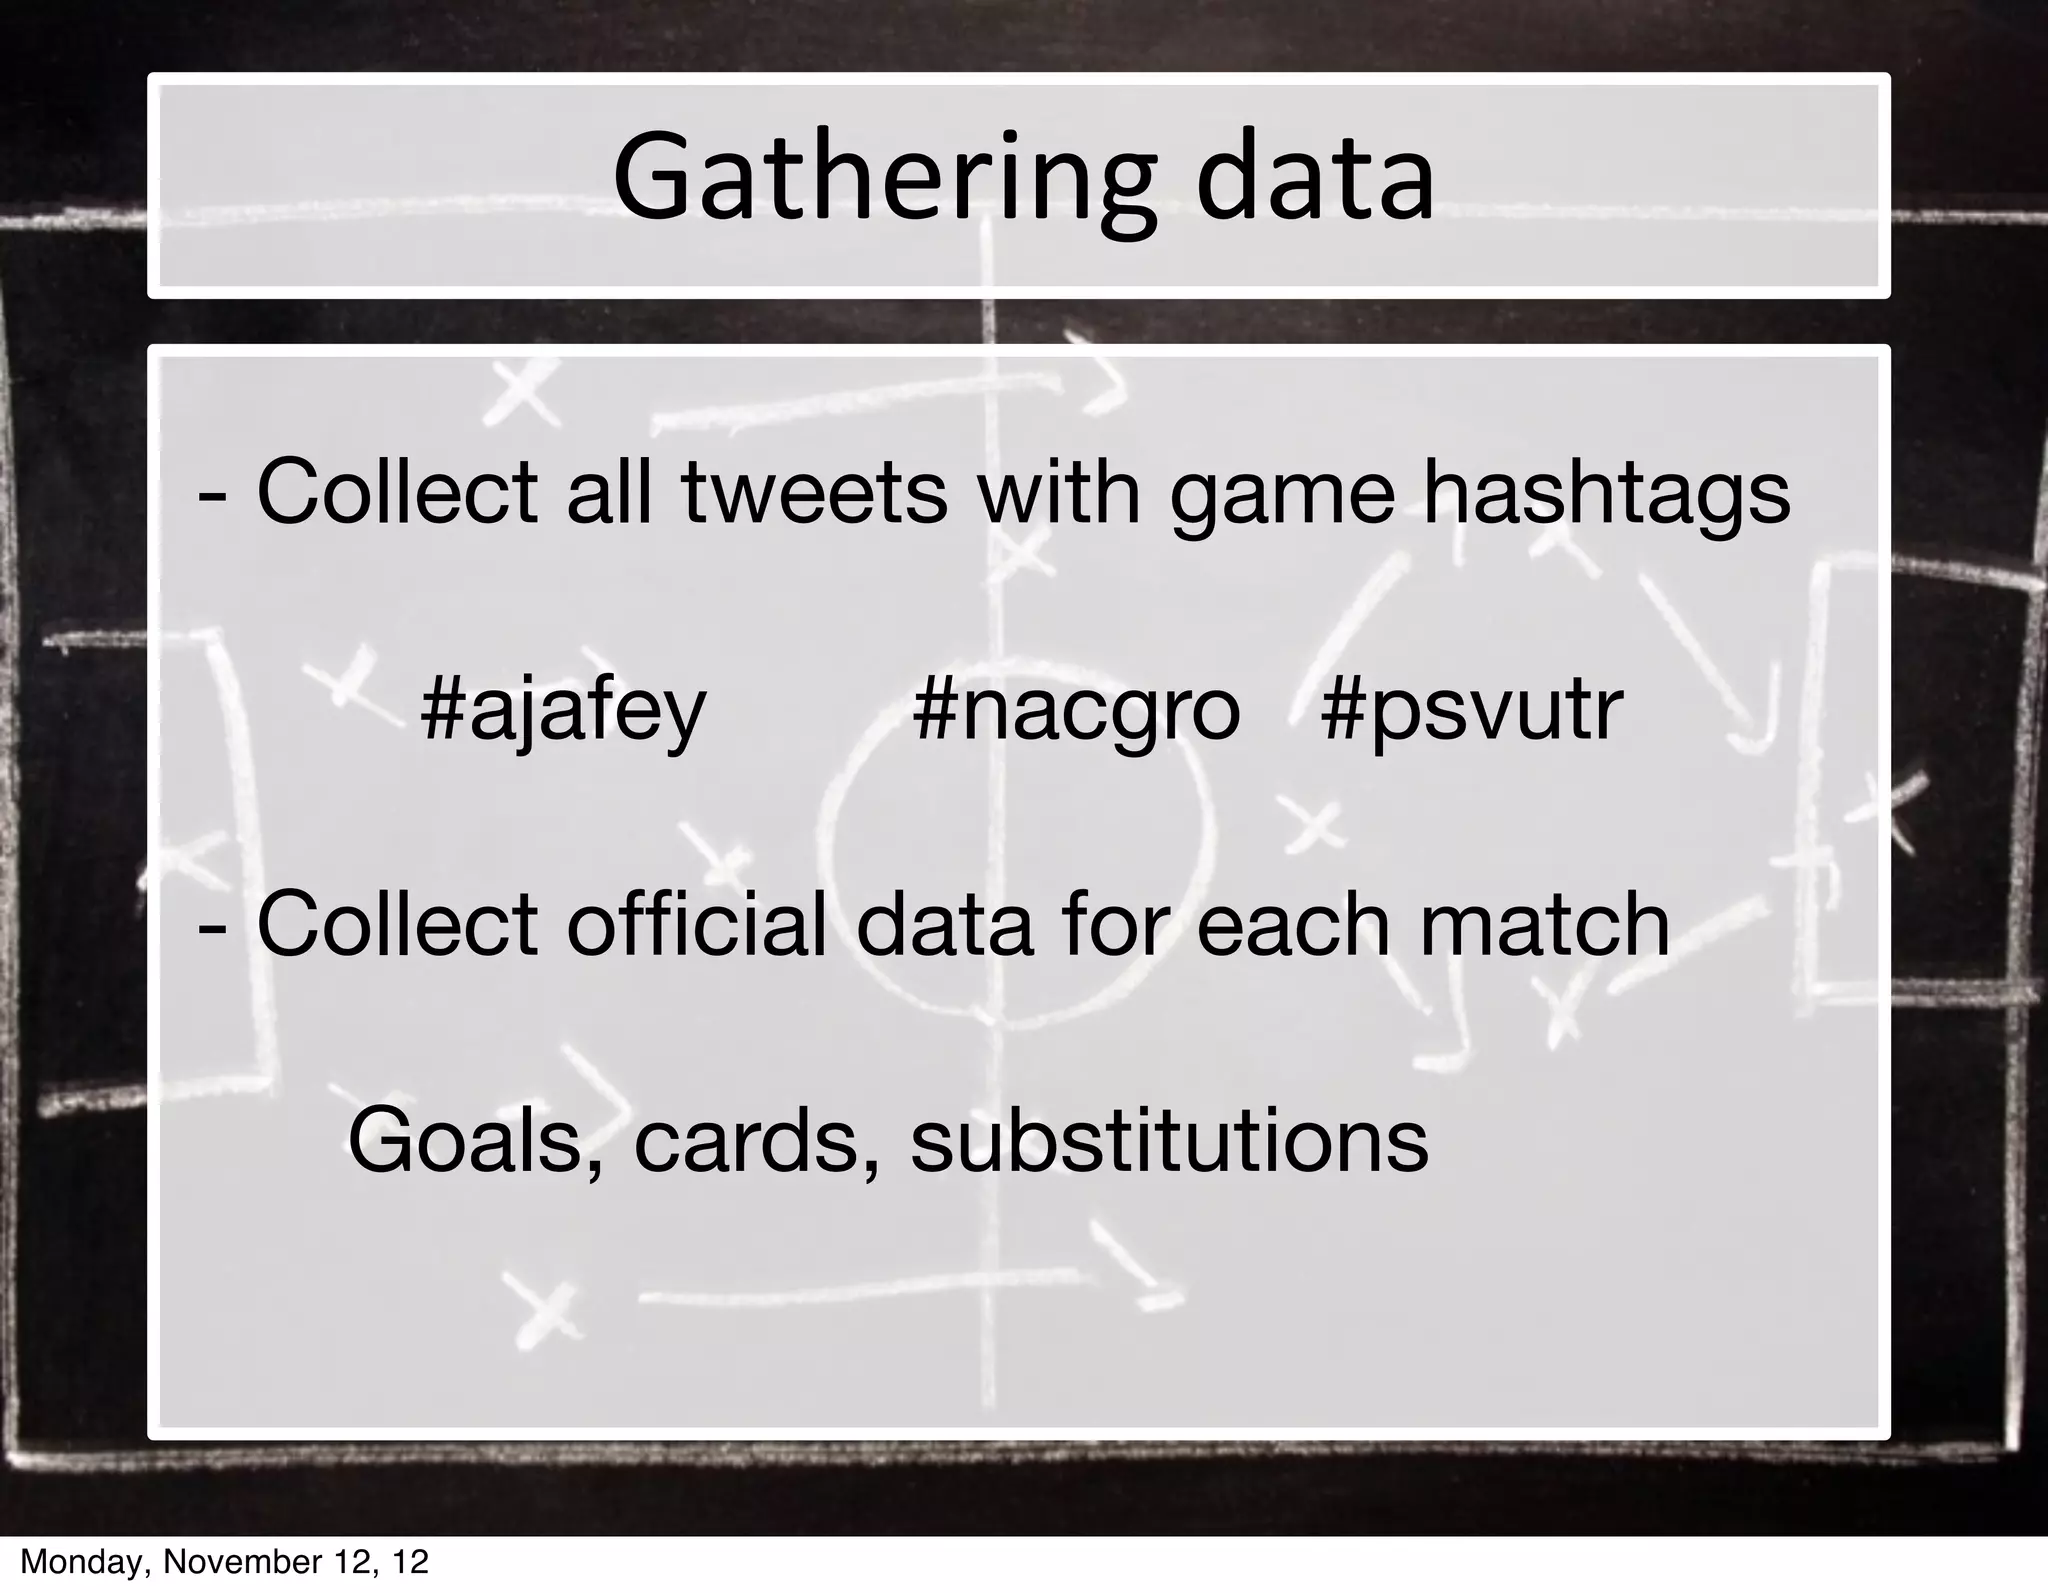
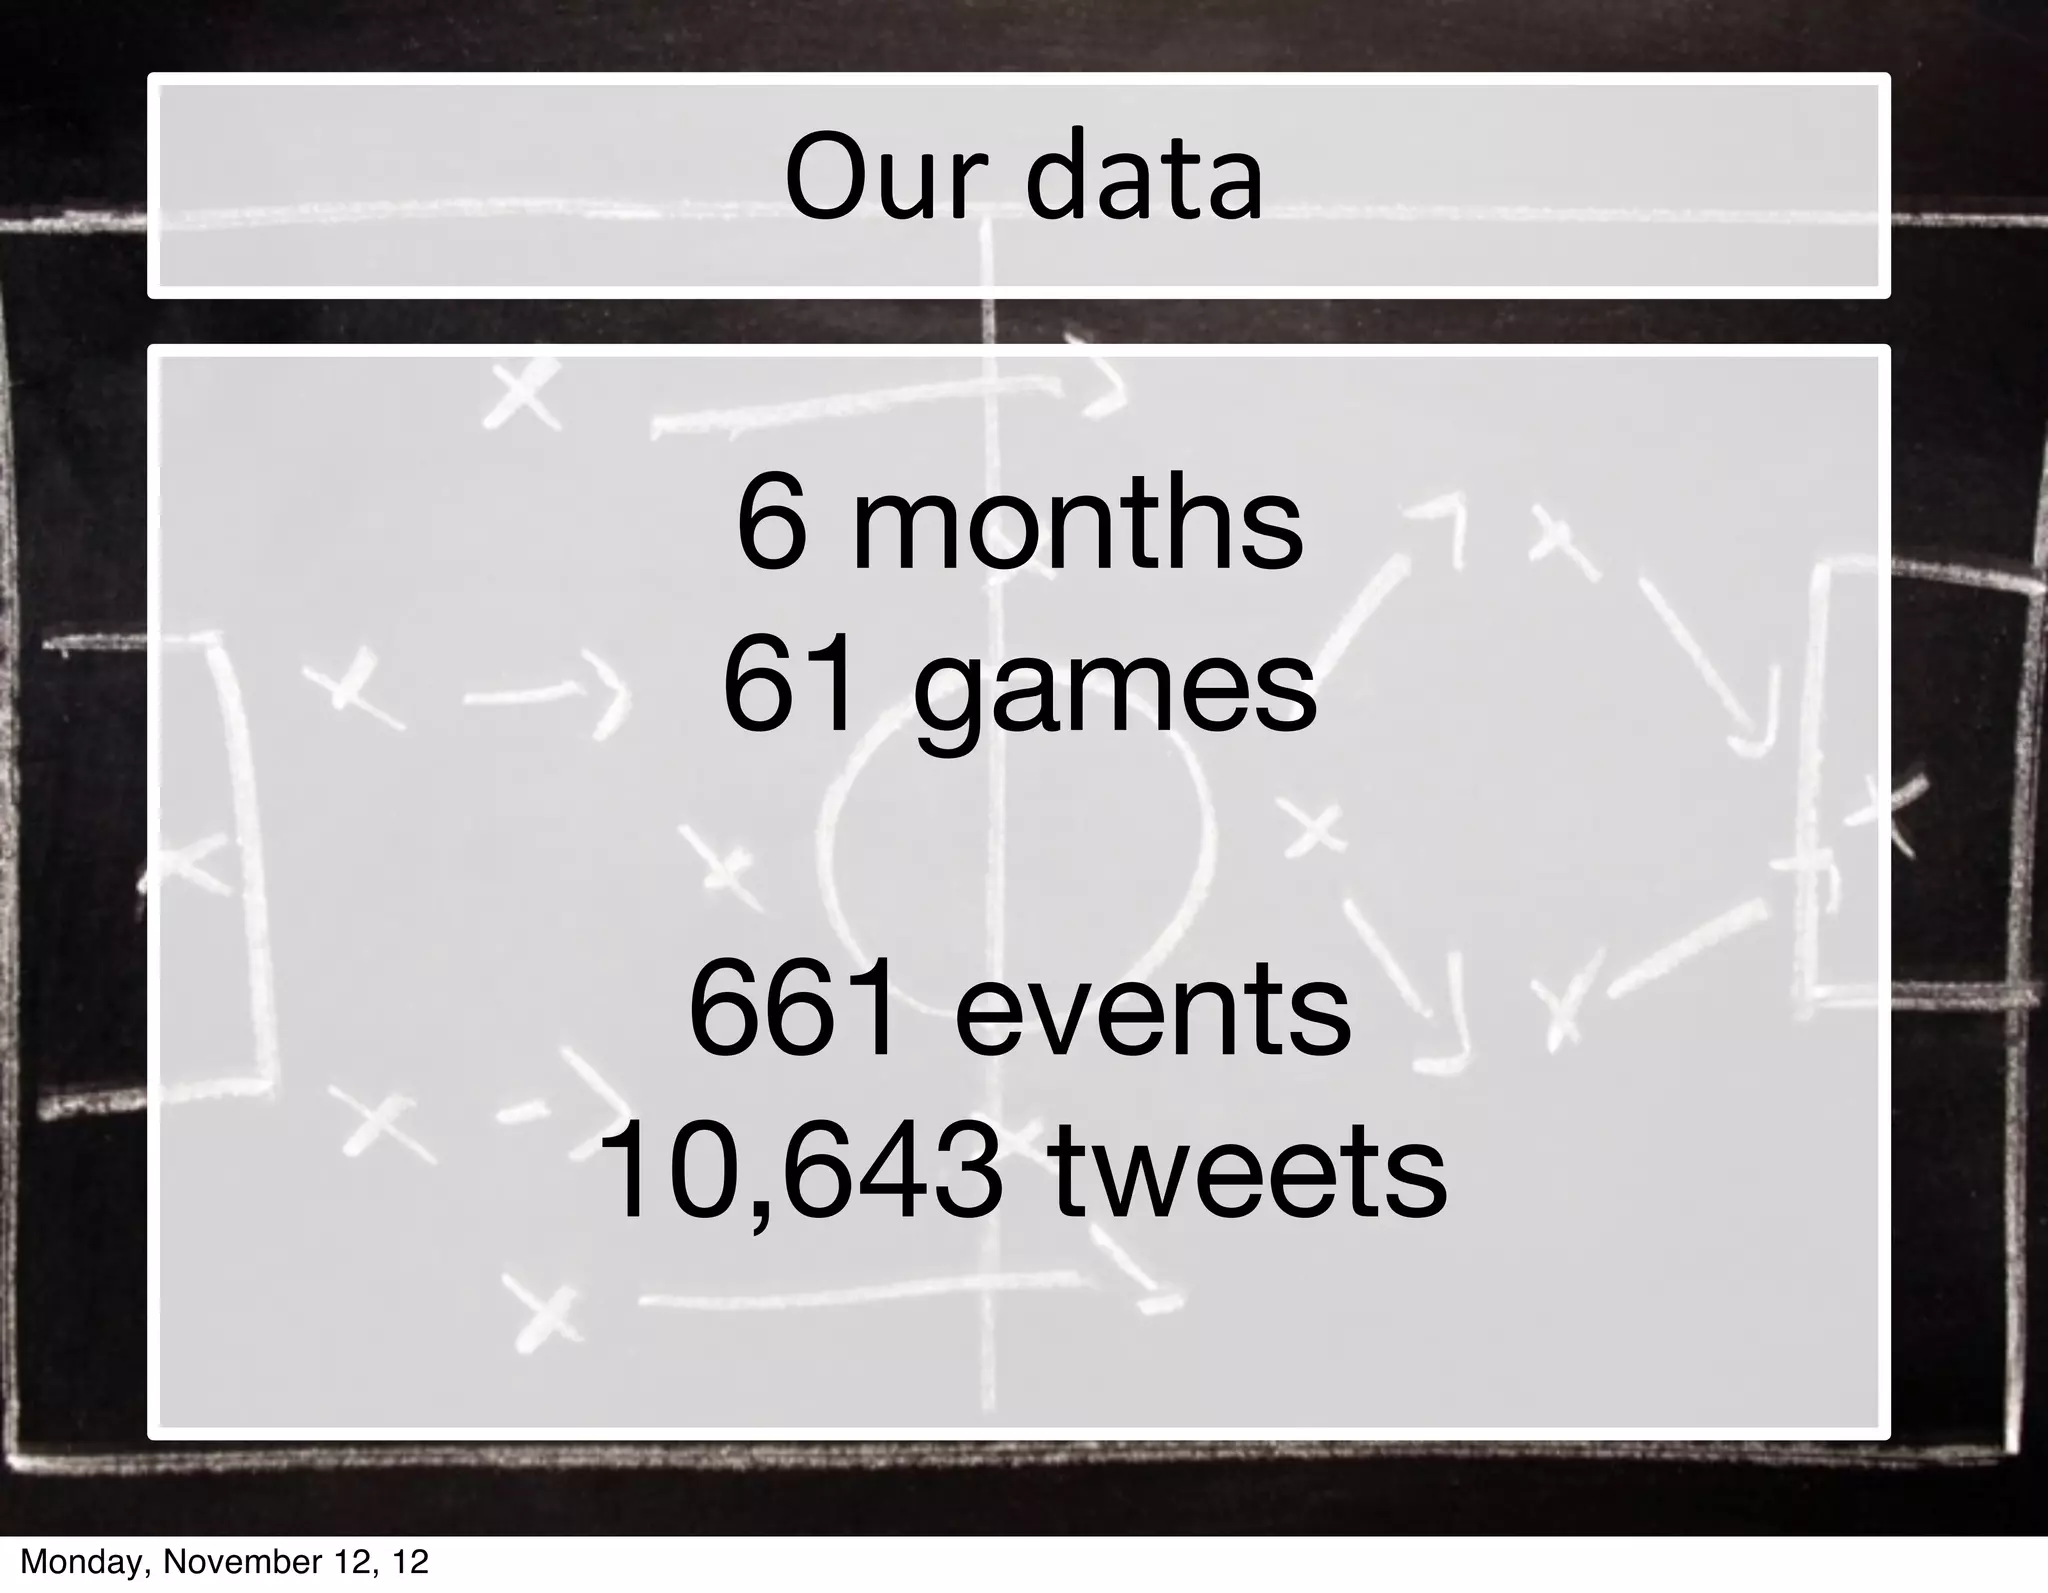
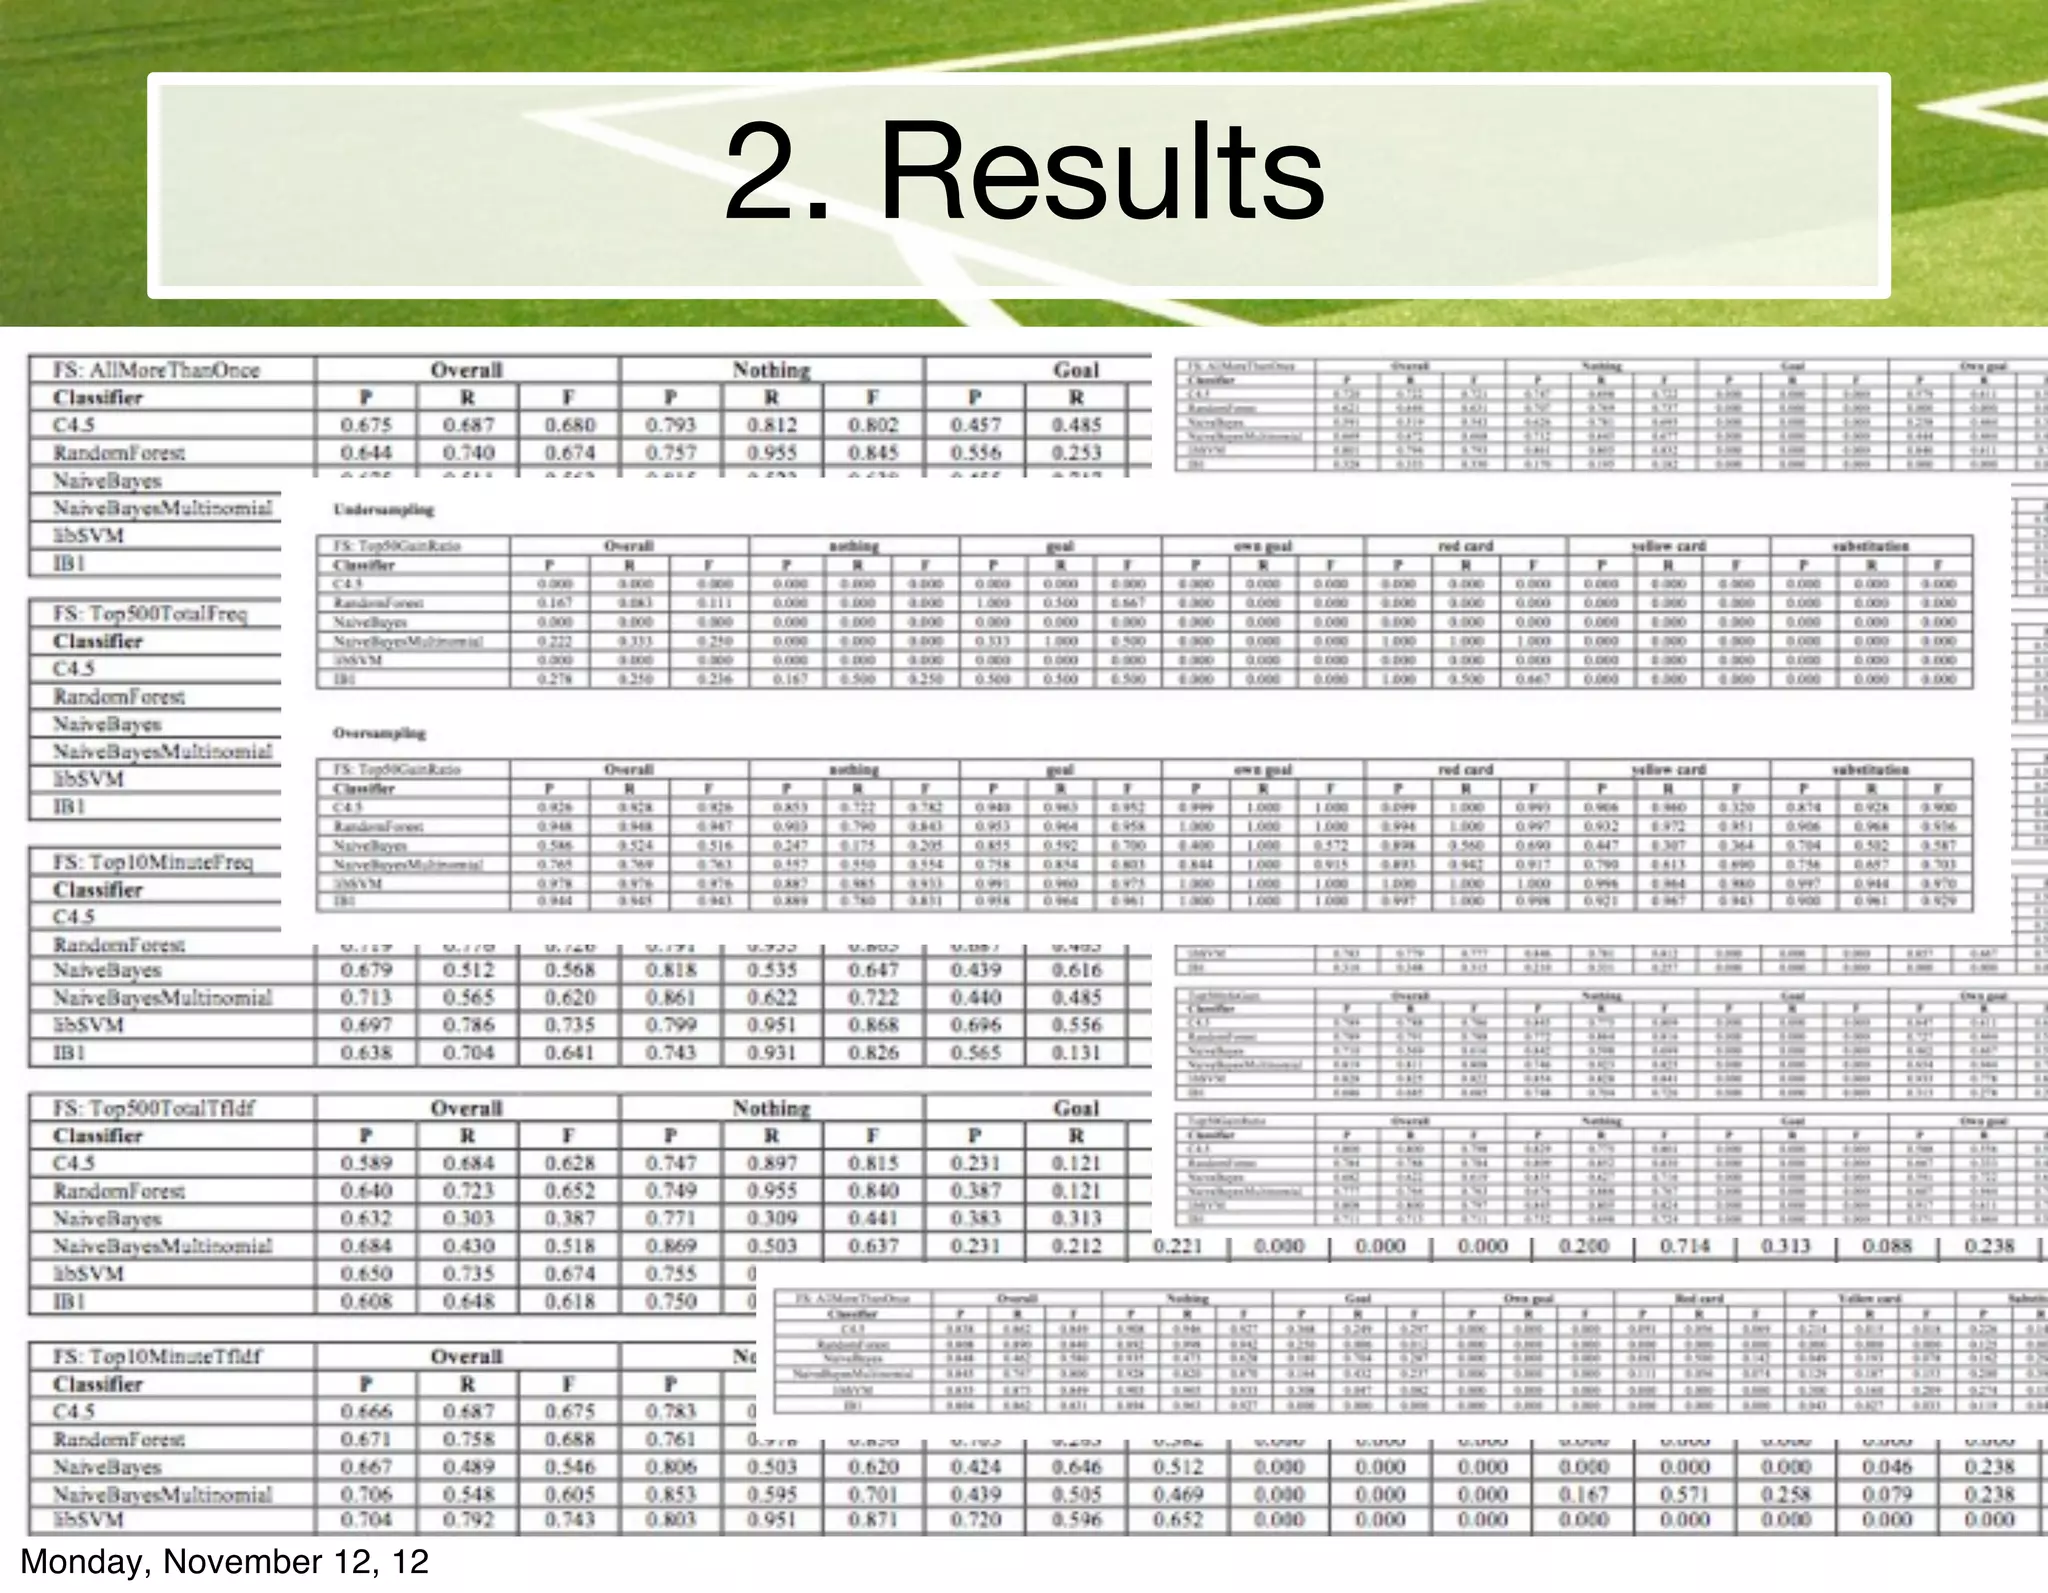
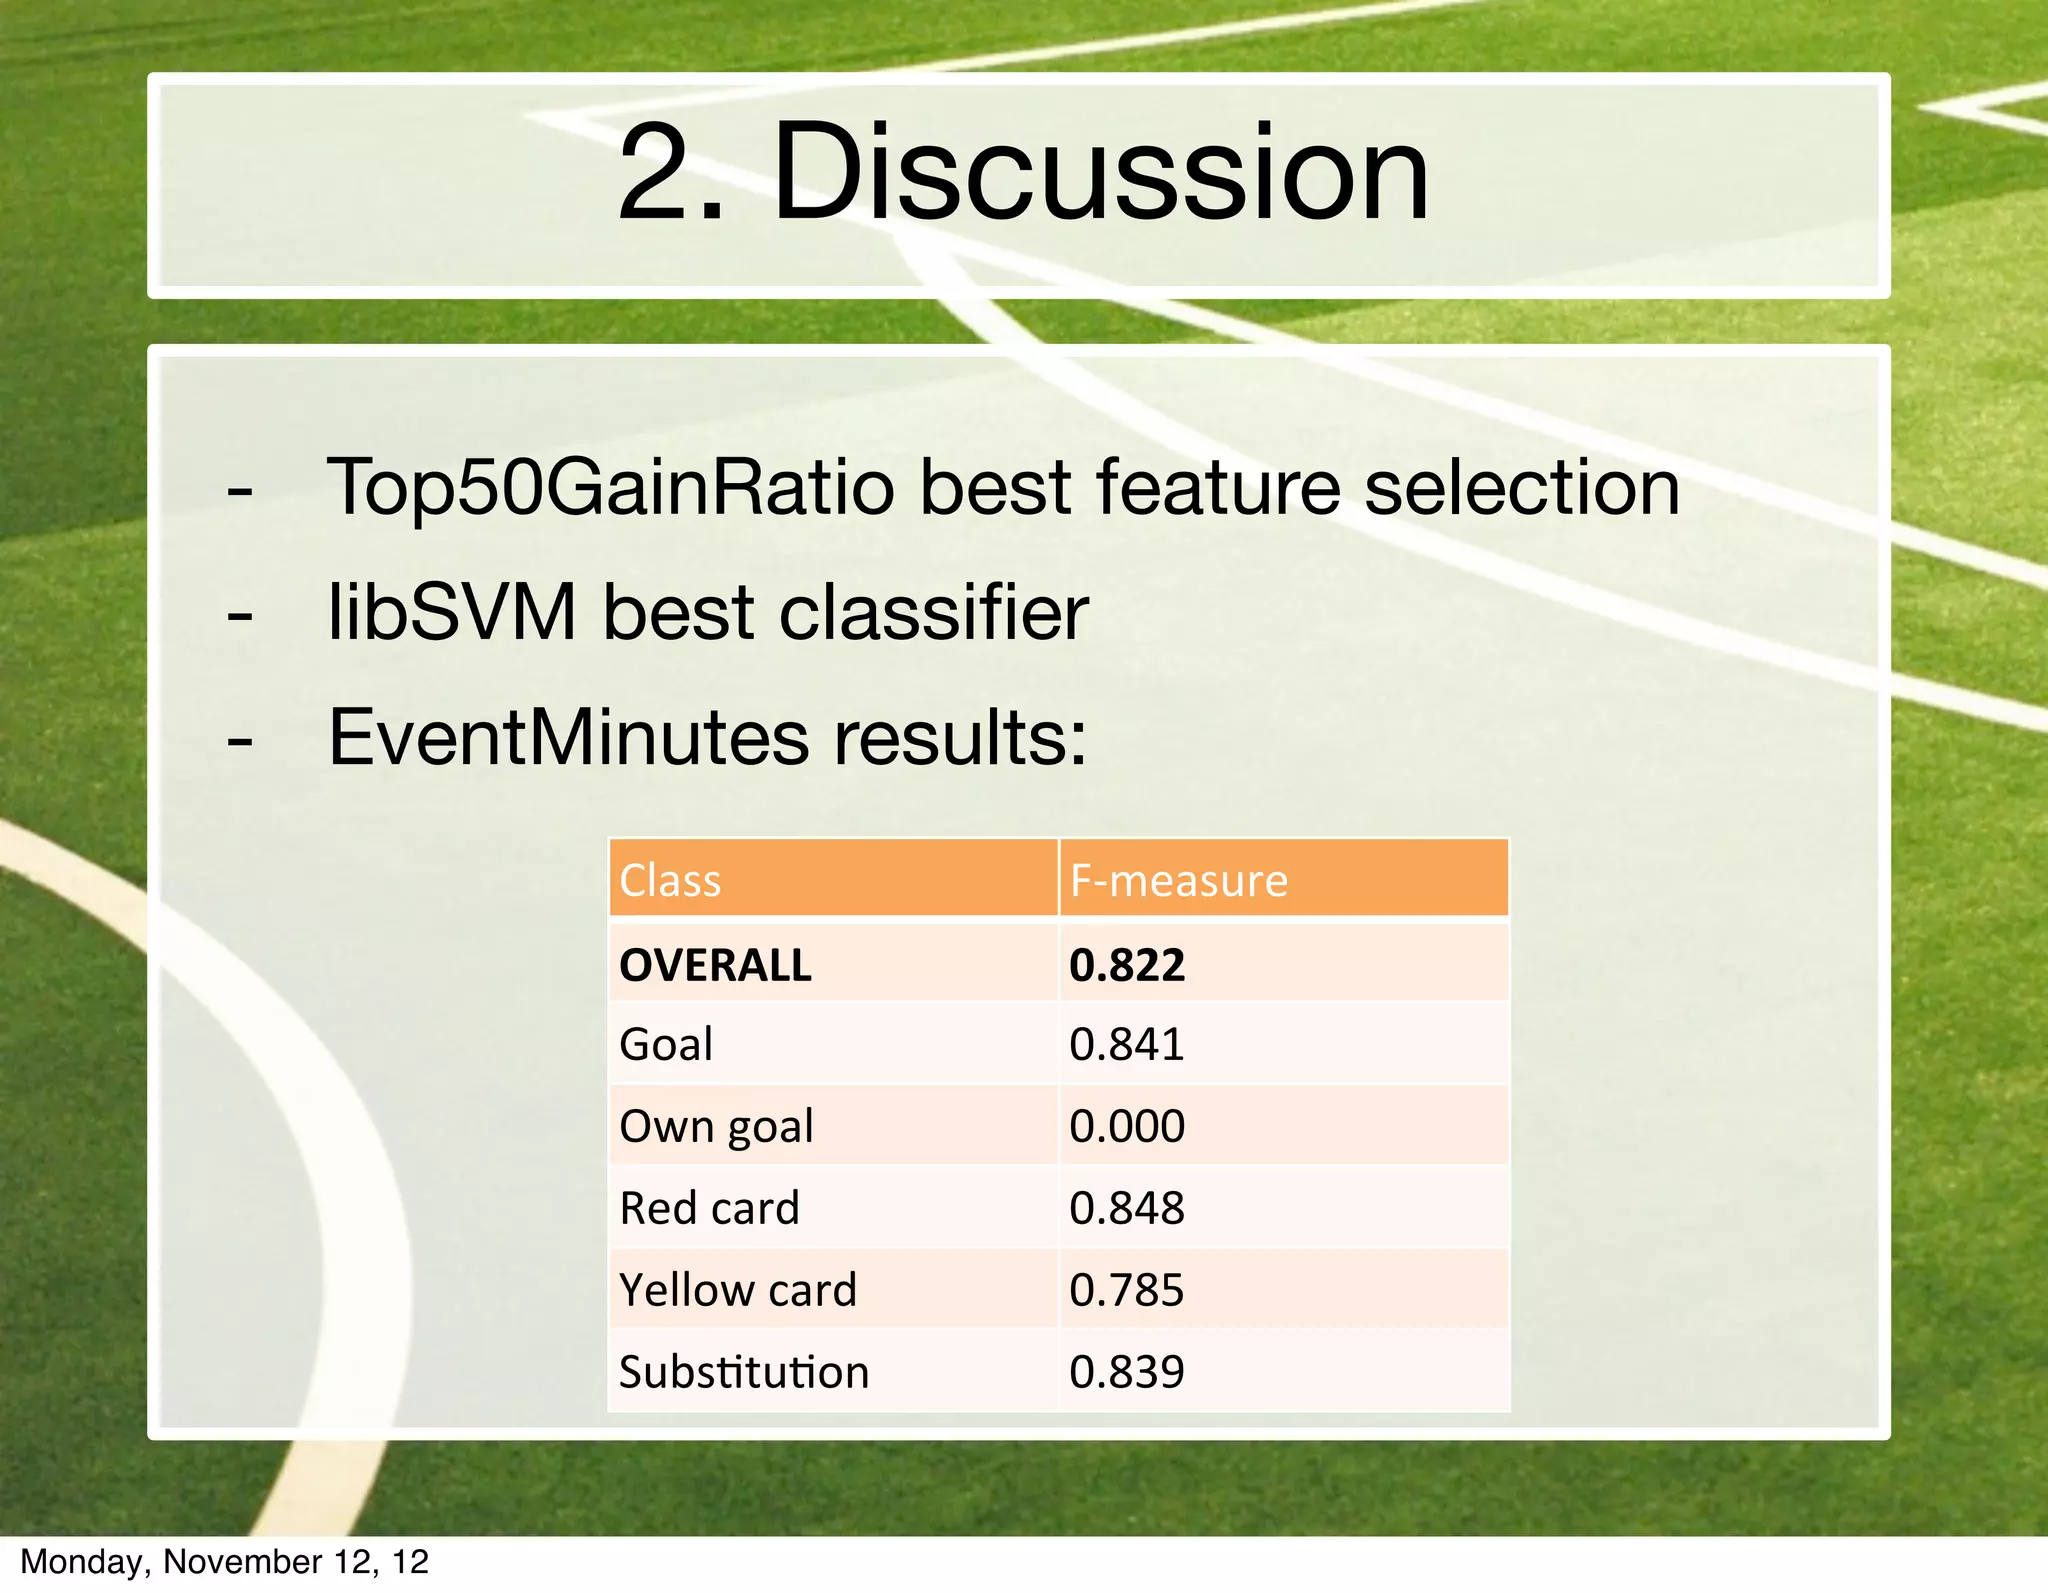
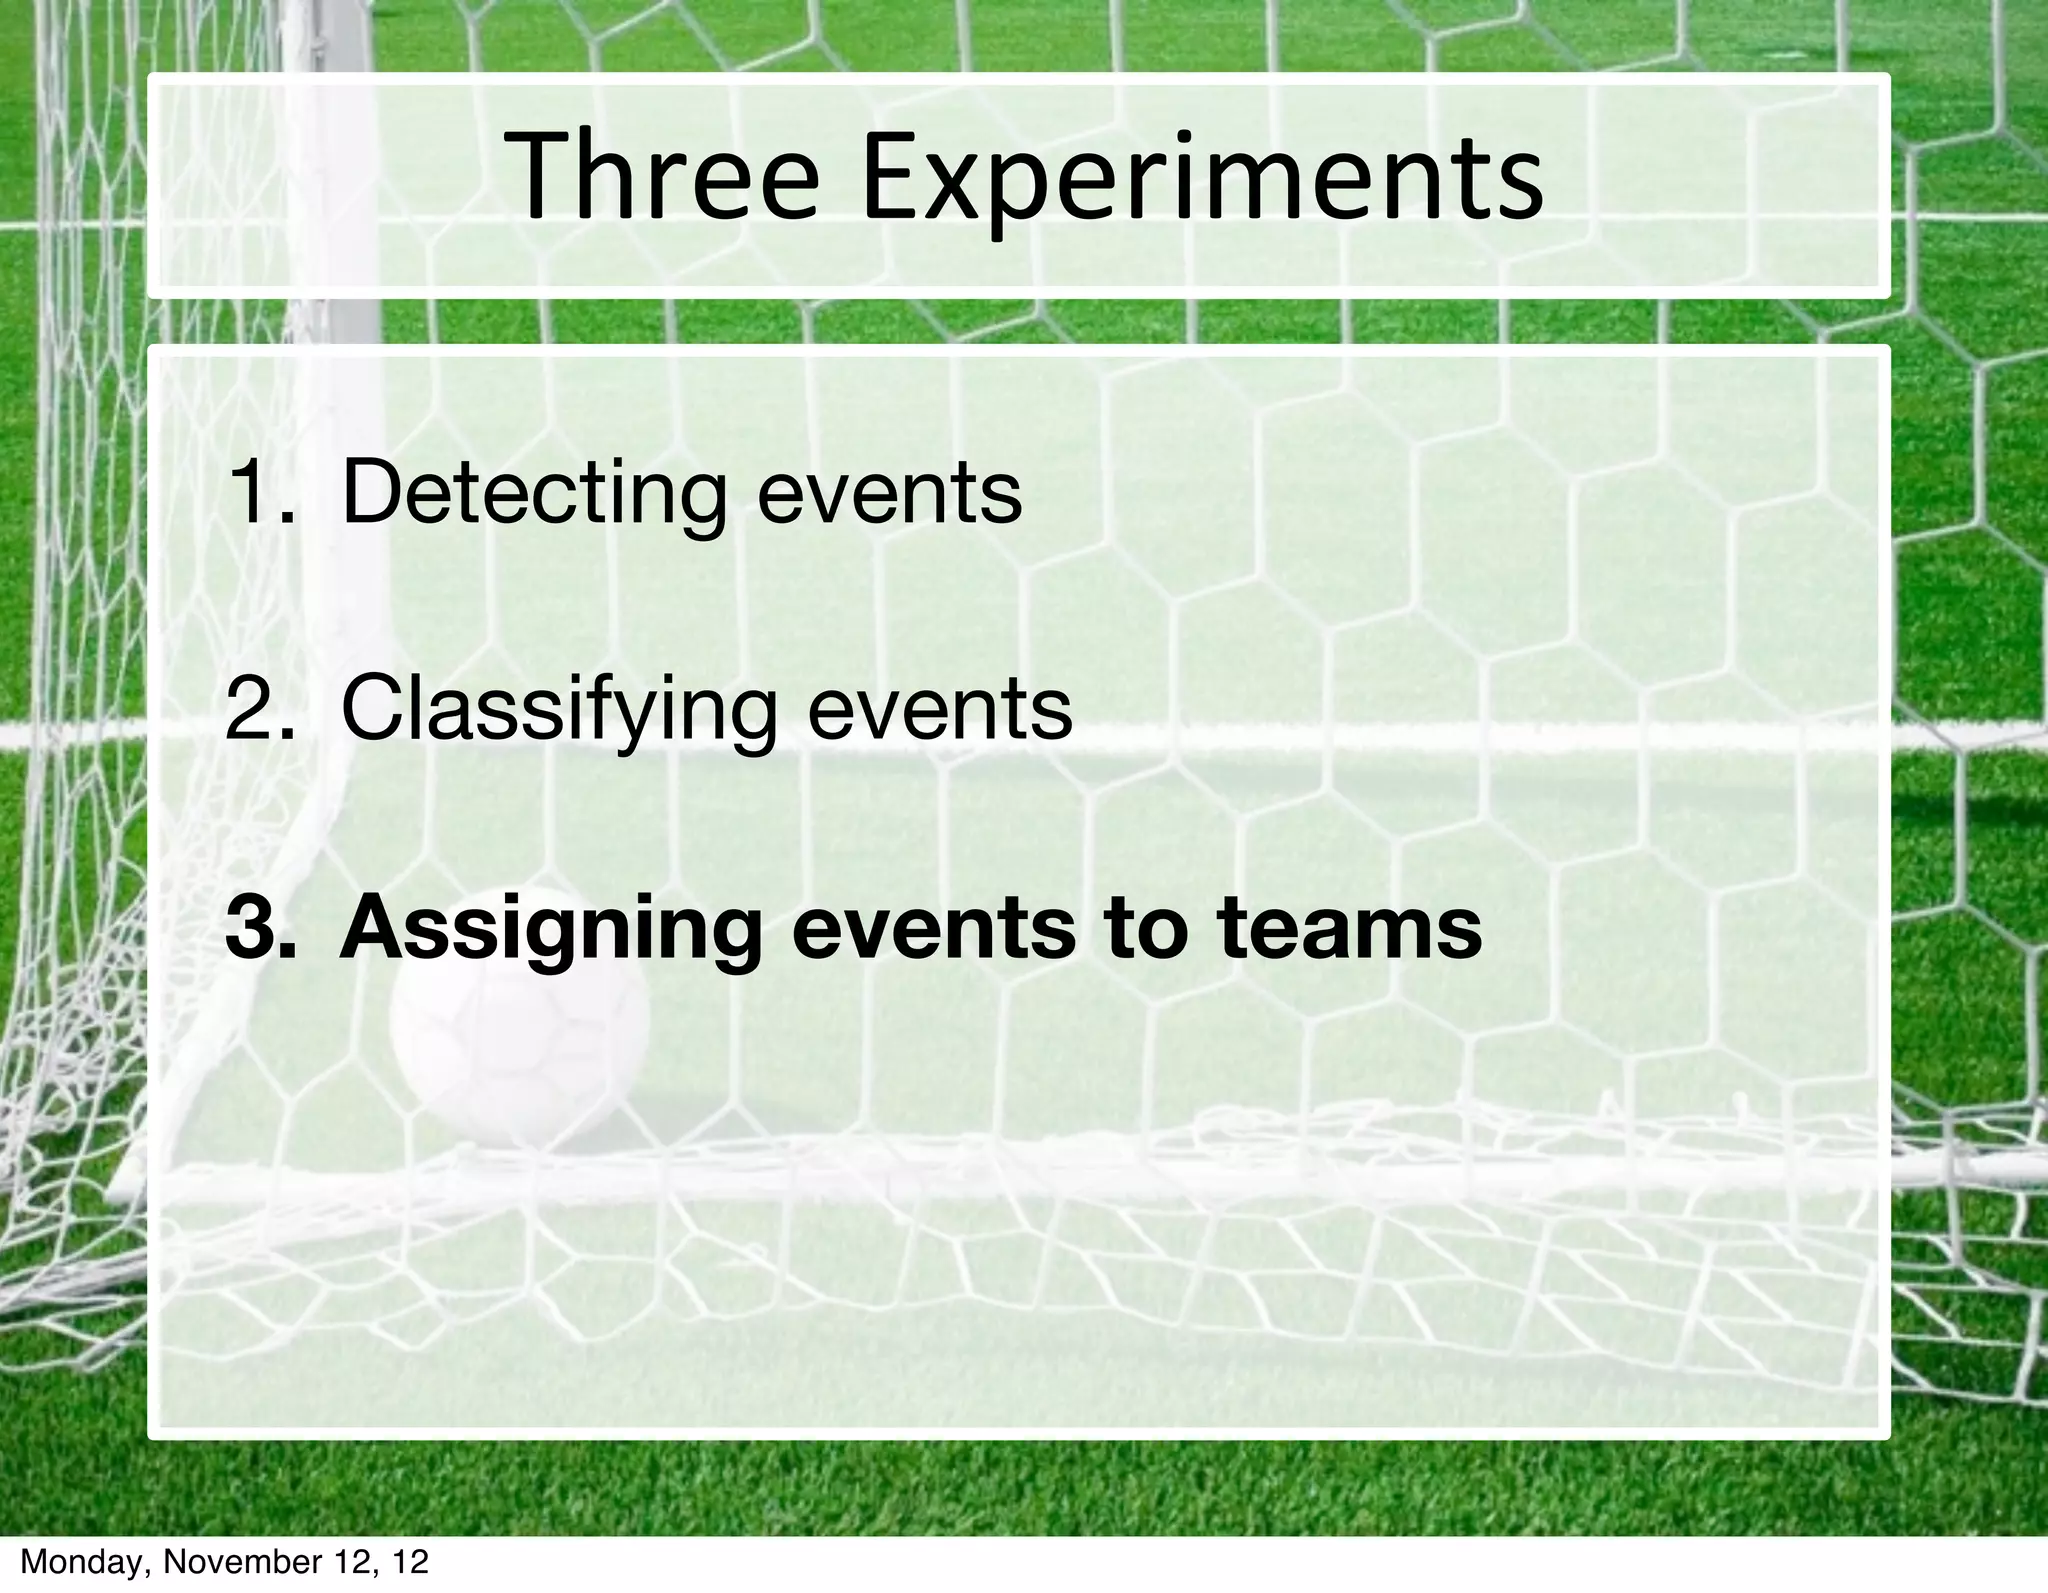
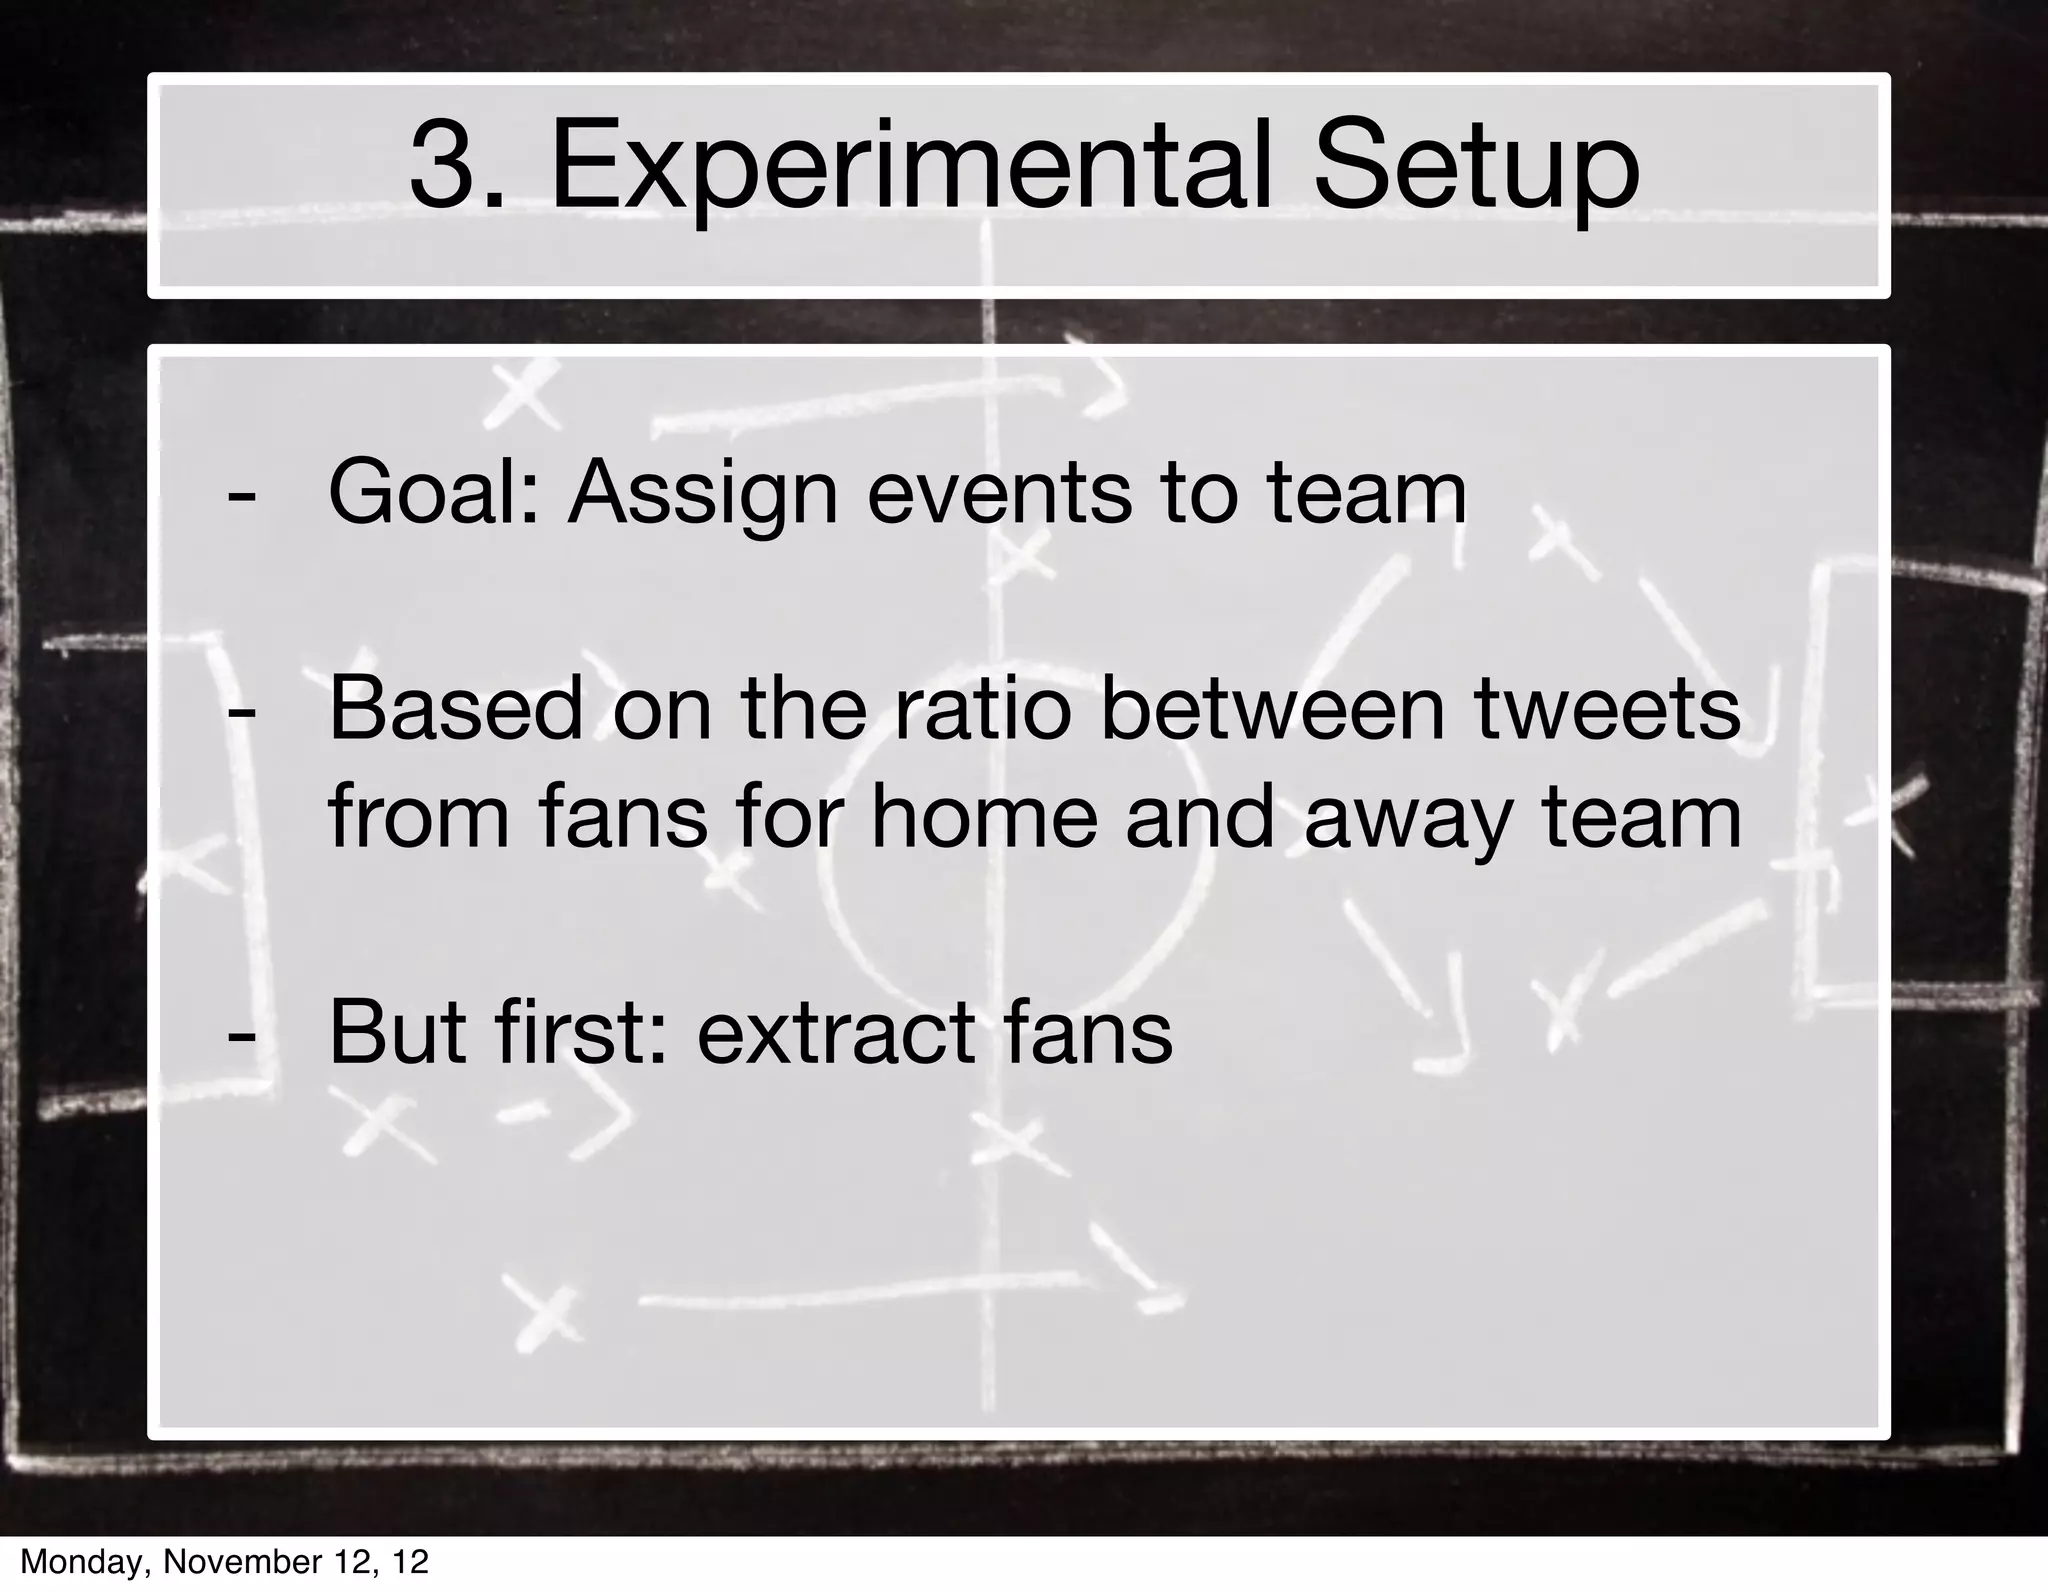
Automa'c	
  extrac'on	
  of	
  
                  soccer	
  game	
  event	
  data	
  
                       from	
  Twi6er	
  

            Guido	
  van	
  Oorschot,	
  Marieke	
  van	
  Erp	
  
                       and	
  Chris	
  Dijkshoorn

Monday, November 12, 12
Soccer	
  data


Monday, November 12, 12
Theory

           1. Fair body of research on automated
              sports highlight extraction

           2. Twitter data can offer interesting
              insights in real world phenomena


Monday, November 12, 12
Automated	
  highlight	
  detec@on


             Let’s Use Twitter data!

Monday, November 12, 12
3	
  Tasks

           1.	Detecting events
                  What minutes did events occur?


           2.	Classifying events
           	      Is the event a goal, card or substitution?


           3.	Assigning events to teams
                  Is the event for the home team or away team?


Monday, November 12, 12
5	
  types	
  of	
  events
                                        - Goal

                                        - Own Goal

                                        - Red Card

                                        - Yellow Card

                                        - Substitution


Monday, November 12, 12
Methodology

           1. Gathering the data


           2. Exploring and
              cleaning the data

           3. Classifying interesting
              data points


Monday, November 12, 12
Gathering	
  data

         - Collect all tweets with game hashtags

                      #ajafey   #nacgro #psvutr

         - Collect official data for each match

                  Goals, cards, substitutions


Monday, November 12, 12
Our	
  data

                           6 months
                           61 games

                           661 events
                          10,643 tweets

Monday, November 12, 12
Three	
  Experiments

           1. Detecting events

           2. Classifying events

           3. Assigning events to teams


Monday, November 12, 12
1. Detecting events


Monday, November 12, 12
1. Detecting events


Monday, November 12, 12
1. Experimental Setup

           - Goal: detect peaks in # tweets per
             minute signal to extract events
           - Setup: Test three peak detection
             methods:
                 1. LocMaxNoBaseLineCorr
                 2. IntThresNoBaseLineCorr
                 3. IntThresWithBaseLineCorr


Monday, November 12, 12
1. Results


Monday, November 12, 12
1. Findings

       - Goals and red cards are detected better
         than yellow cards and substitutions

       - None of the three peak selection
         methods works well.

       - Highlights can be extracted, but not
         precise enough


Monday, November 12, 12
Three	
  Experiments

           1. Detecting events

           2. Classifying events

           3. Assigning events to teams


Monday, November 12, 12
2. Classifying Events

           - Goal: Classify minutes into event
             classes

               minute     “goal”   “1”   “red”   “card”   “boring”     class

                  34        0      2      0        1        20       nothing

                  35       23      34     0        0         0         goal

                  12        1      2      0        0         5       nothing

                  13        1      0      22      11         0       red	
  card


Monday, November 12, 12
Issues

         Problem: Huge, sparse matrix

         1. Reduce features
                   Choose words/features smartly

         2. Reduce instances
         	         Choose minutes smartly

Monday, November 12, 12
2. Experimental Setup

           - 3 Instance selection settings

                 1. AllMinutes
                 2. PeakMinutes
                 3. Eventminutes


Monday, November 12, 12
2. Experimental Setup

           - 7 Feature selection settings
                 1.       AllMoreThanOnce
                 2.       Top500TotalFreq
                 3.       Top10MinuteFreq
                 4.       Top500TotalTfIdf
                 5.       Top10MinuteTfIdf
                 6.       Top50Infogain
                 7.       Top50GainRatio


Monday, November 12, 12
2. Experimental Setup

           - 6 types of classifiers
                 1.       C4.5
                 2.       RandomForest
                 3.       NaiveBayes
                 4.       NaiveBayesMultinomial
                 5.       libSVM
                 6.       IB1


Monday, November 12, 12
2. Results


Monday, November 12, 12
2. Discussion

           - Top50GainRatio best feature selection
           - libSVM best classifier
           - EventMinutes results:
                                  Class            F-­‐measure
                                  OVERALL          0.822
                                  Goal             0.841
                                  Own	
  goal      0.000


     Red	
  card      0.848
                                  Yellow	
  card   0.785
                                  Subs@tu@on       0.839


Monday, November 12, 12
Three	
  Experiments

           1. Detecting events

           2. Classifying events

           3. Assigning events to teams


Monday, November 12, 12
3. Experimental Setup

           - Goal: Assign events to team

           - Based on the ratio between tweets
             from fans for home and away team

           - But first: extract fans


Monday, November 12, 12
3. Extracting fans

           - Hypothesis:

           People that tweet for the same team
           each week are probably fan of that
           team


Monday, November 12, 12
3. Extracting fans

         - Extracted 38,527 fans 	 rom 146,326
                                 f
           users (26%)

         - This method of extracting fans works
           well:
                          Right	
  team   Not	
  clear   Wrong	
  team
                             88%             10%             2%


Monday, November 12, 12
3. Results


Monday, November 12, 12
3. Results

         - Performance of assigning events to teams
           above baseline performance:

                             Class         Baseline   Performance
                           OVERALL          52%          58%
                              Goal          58%          69%
                           Red	
  card      50%          62%
                          Yellow	
  card    63%          63%
                          Subs@tu@on        52%          57%


Monday, November 12, 12
Conclusion

           1. Detecting events
              => difficult

           2. Classifying events
              => good results

           3. Assigning events to teams
              => promising results


Monday, November 12, 12
Future Work

         - Use sentiment in tweets
         	     (for detecting events and assigning events to teams)


         - Player detection

         - Other sports


Monday, November 12, 12
Ques@ons?
Monday, November 12, 12

Automatic Extraction of Soccer Game Event Data from Twitter

  • 1.
    Automa'c  extrac'on  of   soccer  game  event  data   from  Twi6er   Guido  van  Oorschot,  Marieke  van  Erp   and  Chris  Dijkshoorn Monday, November 12, 12
  • 2.
  • 3.
    Theory 1. Fair body of research on automated sports highlight extraction 2. Twitter data can offer interesting insights in real world phenomena Monday, November 12, 12
  • 4.
    Automated  highlight  detec@on Let’s Use Twitter data! Monday, November 12, 12
  • 5.
    3  Tasks 1. Detecting events What minutes did events occur? 2. Classifying events Is the event a goal, card or substitution? 3. Assigning events to teams Is the event for the home team or away team? Monday, November 12, 12
  • 6.
    5  types  of  events - Goal - Own Goal - Red Card - Yellow Card - Substitution Monday, November 12, 12
  • 7.
    Methodology 1. Gathering the data 2. Exploring and cleaning the data 3. Classifying interesting data points Monday, November 12, 12
  • 8.
    Gathering  data - Collect all tweets with game hashtags #ajafey #nacgro #psvutr - Collect official data for each match Goals, cards, substitutions Monday, November 12, 12
  • 9.
    Our  data 6 months 61 games 661 events 10,643 tweets Monday, November 12, 12
  • 10.
    Three  Experiments 1. Detecting events 2. Classifying events 3. Assigning events to teams Monday, November 12, 12
  • 11.
  • 12.
  • 13.
    1. Experimental Setup - Goal: detect peaks in # tweets per minute signal to extract events - Setup: Test three peak detection methods: 1. LocMaxNoBaseLineCorr 2. IntThresNoBaseLineCorr 3. IntThresWithBaseLineCorr Monday, November 12, 12
  • 14.
  • 15.
    1. Findings - Goals and red cards are detected better than yellow cards and substitutions - None of the three peak selection methods works well. - Highlights can be extracted, but not precise enough Monday, November 12, 12
  • 16.
    Three  Experiments 1. Detecting events 2. Classifying events 3. Assigning events to teams Monday, November 12, 12
  • 17.
    2. Classifying Events - Goal: Classify minutes into event classes minute “goal” “1” “red” “card” “boring” class 34 0 2 0 1 20 nothing 35 23 34 0 0 0 goal 12 1 2 0 0 5 nothing 13 1 0 22 11 0 red  card Monday, November 12, 12
  • 18.
    Issues Problem: Huge, sparse matrix 1. Reduce features Choose words/features smartly 2. Reduce instances Choose minutes smartly Monday, November 12, 12
  • 19.
    2. Experimental Setup - 3 Instance selection settings 1. AllMinutes 2. PeakMinutes 3. Eventminutes Monday, November 12, 12
  • 20.
    2. Experimental Setup - 7 Feature selection settings 1. AllMoreThanOnce 2. Top500TotalFreq 3. Top10MinuteFreq 4. Top500TotalTfIdf 5. Top10MinuteTfIdf 6. Top50Infogain 7. Top50GainRatio Monday, November 12, 12
  • 21.
    2. Experimental Setup - 6 types of classifiers 1. C4.5 2. RandomForest 3. NaiveBayes 4. NaiveBayesMultinomial 5. libSVM 6. IB1 Monday, November 12, 12
  • 22.
  • 23.
    2. Discussion - Top50GainRatio best feature selection - libSVM best classifier - EventMinutes results: Class F-­‐measure OVERALL 0.822 Goal 0.841 Own  goal 0.000           Red  card 0.848 Yellow  card 0.785 Subs@tu@on 0.839 Monday, November 12, 12
  • 24.
    Three  Experiments 1. Detecting events 2. Classifying events 3. Assigning events to teams Monday, November 12, 12
  • 25.
    3. Experimental Setup - Goal: Assign events to team - Based on the ratio between tweets from fans for home and away team - But first: extract fans Monday, November 12, 12
  • 26.
    3. Extracting fans - Hypothesis: People that tweet for the same team each week are probably fan of that team Monday, November 12, 12
  • 27.
    3. Extracting fans - Extracted 38,527 fans rom 146,326 f users (26%) - This method of extracting fans works well: Right  team Not  clear Wrong  team 88% 10% 2% Monday, November 12, 12
  • 28.
  • 29.
    3. Results - Performance of assigning events to teams above baseline performance: Class Baseline Performance OVERALL 52% 58% Goal 58% 69% Red  card 50% 62% Yellow  card 63% 63% Subs@tu@on 52% 57% Monday, November 12, 12
  • 30.
    Conclusion 1. Detecting events => difficult 2. Classifying events => good results 3. Assigning events to teams => promising results Monday, November 12, 12
  • 31.
    Future Work - Use sentiment in tweets (for detecting events and assigning events to teams) - Player detection - Other sports Monday, November 12, 12
  • 32.