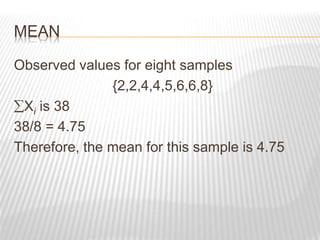
SUBJECT. POPULATION GENETICS
TOPIC. COUNTITATIVE TRAITS OF
POPPULATION
Presented by
Muhammad Qasim
Roll no 36
5/21/2023
1
QK36
DEFINITION
 Quantitative traits in population genetics refer
to traits that can be measured on a
continuous scale, such as height, weight,
blood pressure, or cholesterol levels. These
traits are influenced by multiple genes as
well as environmental factors and can show
a range of variation within a population
5/21/2023
QK36
2
GENETIC ARCHITECTURE
: This refers to the number and effect sizes of
the genes that contribute to a trait. Some
traits are controlled by a few genes with large
effects, while others are controlled by many
genes with small effect
5/21/2023
QK36
3
STATISTICAL TERMS
Mean:
The distribution of two sets
of phenotypic
measurements cluster
around a central value.
The mean is the arithmetic
average of the set of
measurements, the sum
of all of the individuals
divided by the number of
individuals.
MEAN
The mean is arithmetically calculated as
Mean = Xi/n
Where Xi is the sum of all the individual
values
and n is the number of individual values
MEAN
Observed values for eight samples
{2,2,4,4,5,6,6,8}
Xi is 38
38/8 = 4.75
Therefore, the mean for this sample is 4.75
MEDIAN
If the data are arranged from smallest to
largest value, the median value is the central
number.
{2,2,4,4,5,6,6,7,8}
So the median value for this data set is 5.
RANGE
Range is the distance between the smallest
value in a set and the largest value in a set.
{2,2,4,4,5,6,6,7,8}
The range for this set is 2 to 8.
FREQUENCY DISTRIBUTION
Median and range give information about the
frequency distribution, or shape of the curve.
The values of two different data sets may have
the same mean, but be distributed around
that mean differently.
VARIANCE
Variance is a value that describes the degree
to which the values in a data set diverge from
the mean.
The variance within the data set is used to
make inferences or estimate the variation in
the population as a whole.
CALCULATE VARIANCE (S2)
s2 = (Xi-mean)2/n - 1
5/21/2023
QK36
12

POPPULATION GENETICS 5TH.pptx

  • 1.
    SUBJECT. POPULATION GENETICS TOPIC.COUNTITATIVE TRAITS OF POPPULATION Presented by Muhammad Qasim Roll no 36 5/21/2023 1 QK36
  • 2.
    DEFINITION  Quantitative traitsin population genetics refer to traits that can be measured on a continuous scale, such as height, weight, blood pressure, or cholesterol levels. These traits are influenced by multiple genes as well as environmental factors and can show a range of variation within a population 5/21/2023 QK36 2
  • 3.
    GENETIC ARCHITECTURE : Thisrefers to the number and effect sizes of the genes that contribute to a trait. Some traits are controlled by a few genes with large effects, while others are controlled by many genes with small effect 5/21/2023 QK36 3
  • 4.
    STATISTICAL TERMS Mean: The distributionof two sets of phenotypic measurements cluster around a central value. The mean is the arithmetic average of the set of measurements, the sum of all of the individuals divided by the number of individuals.
  • 5.
    MEAN The mean isarithmetically calculated as Mean = Xi/n Where Xi is the sum of all the individual values and n is the number of individual values
  • 6.
    MEAN Observed values foreight samples {2,2,4,4,5,6,6,8} Xi is 38 38/8 = 4.75 Therefore, the mean for this sample is 4.75
  • 7.
    MEDIAN If the dataare arranged from smallest to largest value, the median value is the central number. {2,2,4,4,5,6,6,7,8} So the median value for this data set is 5.
  • 8.
    RANGE Range is thedistance between the smallest value in a set and the largest value in a set. {2,2,4,4,5,6,6,7,8} The range for this set is 2 to 8.
  • 9.
    FREQUENCY DISTRIBUTION Median andrange give information about the frequency distribution, or shape of the curve. The values of two different data sets may have the same mean, but be distributed around that mean differently.
  • 10.
    VARIANCE Variance is avalue that describes the degree to which the values in a data set diverge from the mean. The variance within the data set is used to make inferences or estimate the variation in the population as a whole.
  • 11.
    CALCULATE VARIANCE (S2) s2= (Xi-mean)2/n - 1
  • 12.