Flow Cytometric Analysis of Antigen Expression in Myelodysplastic Syndrome Patients
1. Med J Malaysia Vol 67 No 1 February 2012 79
SUMMARY
Myelodysplastic syndromes (MDS) are a group of
haematological malignancies categorized by ineffective
hematopoiesis that result in dysplasia. Although
morphological diagnosis is a traditional and standard
technique that is used for the diagnosis of MDS, the
heterogeneous blood and bone marrow characteristics of
MDS patients can potentially obscure the right diagnosis.
Thus, we have utilized flow cytometric immunophenotyping
as a supportive mechanism to obtain a more accurate and
faster method for detection of abnormal markers in MDS.
Flow cytometry was used for analyzing bone marrow
samples from newly diagnosed MDS patients to investigate
the abnormal antigen expression patterns in granulocytic,
monocytic, erythroid, lymphoid lineages and myeloid
precursors. The results were compared with those obtained
from cases that had Idiopathic Thrombocytopenic Purpura
(ITP) as a control. The most common abnormality found in
the granulocytic lineage was the decrease of CD10. Low
expressions of CD13 were the most frequent abnormality in
the monocytic lineage. The erythroid lineage was found to
have low expression of CD235A+/CD71+, reduce of CD71and
decreased CD235a. In conclusion, this method is useful for
confirming cases in which it is difficult to make a diagnosis
by morphology.
KEY WORDS:
Myelodysplastic Syndromes, Flow cytometry, Immunophenotyping
INTRODUCTION
MDS is one of the main bone marrow (BM) disorders;
occurring particularly in older people with incidences of
approximately 3.5–4 per 100,000 person year 1
. MDS
encompasses a heterogeneous cluster of clonal hematopoietic
malignancies which show ineffective hematopoiesis with an
increased danger of change to acute myeloid leukaemia
(AML). Development of MDS starts with abnormal clones
which are characterized by morphological dysplasia and
impaired differentiations. Ineffective haematopoiesis will lead
to the cytopenic peripheral blood that forms all three blood
cell lineages namely erythroid, granulocytic, and
megakaryocytic2
.
The gold standard for diagnosis of MDS is morphological
examination of blood film and BM. Morphological findings
in MDS can differ highly and be complicated due to
limitations in morphological analysis. For instance, different
interpretations of BM features3
which are result from
suboptimal aspirate smears due to hemodilution, air-dried or
badly stained smears, and/or an insufficient biopsy specimen4
prevent accurate diagnosis. In recent times, numerous
approaches have been used to analyze pathological
characteristics of BM in MDS. Analysis of the cell lineages
and expression pattern of antigens will lead to discovery of
abnormal co-expression and maturation asynchrony. This
information could provide a characteristic model of the
disease which will assist in accurate diagnosis of the
malignancy and support the morphological analysis. In line
with this, identification of MDS phenotype using flow
cytometric immunophenotyping has greatly improved the
diagnostic process, mainly as a consequence of increase of
available monoclonal antibodies. Undoubtedly,
immunophenotyping has become the foundation of many
haematological related diagnoses in conjunction with
supportive morphological and cytochemical analysis. The last
decades have seen progress in flow cytometric
immunophenotyping which has enhanced our capability to
recognize various phenotypic abnormalities5
. Although
several studies have previously investigated the antigenic
expression pattern in MDS patients, this is the first report of
Ag expression pattern in the Malaysian population. Our flow
cytometric immunophenotyping study in MDS patients
depicts a common abnormality in granulocytic, monocytic
and erythroid.
MATERIALS AND METHODS
We examined 30 patients with newly diagnosed MDS (as
diagnosed by morphological assessment of the initial PB and
BM sample according to the FAB criteria independently by
two haematopathologist, without knowledge of the flow
cytometric analysis, cytogenetic and FISH findings. For each
individual case, routine haematoxylin and eosin (H&E)
histologic section and well-prepared Wright-Giemsa-stained
smears were evaluated) 6
whereby the samples were collected
from February 2009 to November 2010 at Hospital Kuala
Lumpur (HKL) after written informed consent from patients
and ethical clearance by the Faculty of Medicine and Health
Sciences, University Putra Malaysia (no: UPM/FPSK/PADS/T7-
MJKEtikaPer/F01(LECT(JPAT)_MAC(10)02) and Hospital KL
(HKL) (no: HKL /PAT/180/1). Patients group included: (4
patients) Refractory Anaemia (RA), (11 patients) Refractory
Anaemia with Ringed Sideroblasts (RARS) and (15 patients)
Refractory Anaemia with Excess Blasts (RAEB). There were 20
males and 10 females, median age 52 years (range 34 to 71).
There were 9 Malays and 21 Chinese. The results obtained
were compared with the BM samples of cases affected by
Qualitative Flow Cytometric Analysis of Malaysian
Myelodysplastic Syndromes (MDS) Patients
Mohadese Hashem Broojerdi, MSc, Rajesh Ramasamy, PhD, Sabariah Md Noor, PhD, Zainina Binti Seman, PhD
Pathology Department, Faculty of Medicine and Health Sciences, University Putra Malaysia
ORIGINAL ARTICLE
This article was accepted: 29 November 2011
Corresponding Author: Mohadese Hashem Broojerdi,Pathology Department, Faculty of Medicine and Health Sciences, University Putra Malaysia
Email: mohadese_b84@yahoo.com
2. Original Article
80 Med J Malaysia Vol 67 No 1 February 2012
disorders with no BM involvement, ITP 7
. 30 controls were
used for statistical comparisons. The median age of this
control group was 40 years (range 21 to 54) with 13 male and
17 female. There were 12 Malays and 18 Chinese. BM samples
(approximately 500x10³ cells/ test) were stained as per
manufacturer instruction (BD Bioscience). The pattern
recognition approach that we adopted in this study was the
method suggested by van Lochem et al (2004)8
. The
monoclonal antibody-panel used in this study is listed in
table 1.
The method for labelling the cells was carried out according
to Li et al., with some modifications according to the
recommendation of the manufacturer to optimise the
technique9
. In brief, bone marrow samples were incubated for
15 min in the existence of 3 µl of FITC, PE, PerCP-Cy5.5 and
2 µl of APC conjugated antibodies at room temperature.
Following Lysing of non-nucleated red cells with FACS Lysing
solution (Becton Dickinson Biosciences, San Jose, CA, USA)-
the cells were centrifuged (5 min at 300g) and resuspended in
500 µl of FACS Flow (Becton Dickinson Biosciences, San Jose,
CA, USA) for the flow cytometer analysis. Cell analysis was
performed in FACSCanto (BD Biosciences, San Jose, CA, USA)
immediately. For each combination of antibodies, a
minimum total of 10,000 events were recorded. The data were
analysed with FACSDiva Software V.6.1.1 (BD Biosciences, San
Jose, CA, USA). Isotype controls for FITC Mouse IgG1, PE
Mouse IgG1, PerCP/Cy5.5 Mouse IgG1 and APC Mouse
IgG1were used for non specific background staining.
Gating on CD45/SSC (Side Scatter) plot was used for choosing
the population of interest. CD45 together with right angle
light scatter was used to effectively identify the lymphocytes,
monocytes, maturing myeloid cells and myeloblasts in
marrow aspirates and serves as a reference for gating the
different populations which are present in every tube10
. The
different subsets of cells that were recognised by this method
were blast cells (CD45low/SSClow), lymphocytes
(CD45high/SSClow), monocytes (CD45high/
SSCintermediate), granulocytes (CD45high SSChigh) 11
. The
nucleated red cells were investigated as a (CD45low to
negative/SSClow) population6
.
A descriptive analysis was done for all variables studied. The
student’s t-test was used for statistical analysis of differences
among groups. The Mann–Whitney U-test was employed for
nonparametric variables. Statistical significance was distinct
by a p value of 0.05 or less for all statistical tests. Actually, the
assessment of antigenic low expression or aberrancy was done
by comparing mean gated population fluorescence with that
of control.
RESULTS
In flow cytometric analysis of granulocytic lineage 13
(43.33%) MDS cases showed decreased SSC (hypo granularity)
in the granulocytic gate (p=0.005). Generally, the percentage
of HLA-DR positive granulocytes was higher (p=0.029) in
patients with MDS than controls as 6 (20.00%) cases showed
presence of HLA-DR on granulocytes. Six cases (20.00%)
showed a reduced expression of CD11b; however the
difference was not statistically significant (p=0.210). Presence
of CD34 was seen in 4 (13.33%) cases. Additionally, in mature
granulocytes low expression of CD10 was seen in 14 (46.66%)
MDS cases. The percentage of the CD10+
mature granulocytes
was much lower in MDS patients than in controls.
Furthermore, the proportion of CD13 and CD33 were
significantly lower in MDS cases (p=0.000) (figure 1).
Analysis of the monocytic lineage, showed 13 (3.33%) cases
with minimal expressions of CD13 (p=0.005) compared to
controls. Absence of CD33 was seen in 3 (10%) of MDS cases.
Eight (26.66%) MDS patients showed decrease of CD14
expression (p=0.337) and 6 (20%) MDS cases showed CD34+
monocyte (CD14+
/CD34+
) (p=0.037). The percentage of HLA-
DR+/CD11b+
monocytes was higher in MDS. Seven (23.33%)
cases showed HLA-DR+
/CD11b+
monocytes (p=0.024) (table
2).
Flow cytometric analysis of myeloid precursors showed
enhanced HLA-DR+
/CD11b+
in 13 (43.33%) MDS cases as
compared to control. Eight (26.66%) MDS patients
demonstrated lower percentage of CD13 and 4 cases (13.33%)
with higher CD11b percentages.
Analysis of erythroid lineage by flow cytometry showed
decrease of CD71 expression in 16 (53.33%) cases (p=0.000);
in addition, there were 12 (40.00%) cases that showed the low
expression of CD235a (p=0.000). Presence of CD235a+
/CD71+
was lower in 18 (60%) of MDS cases (figure 2). There were no
differences in antigen presentation on lymphoid lineages
between MDS and controls.
Statistical significance was distinct by a p value of 0.05 for all
statistical tests.
DISCUSSION
MDSs are a mixed cluster of myeloid neoplasia categorized by
an aberrant maturation and differentiation of myeloid cells
with a high danger of transformation to AML.
Haematological and morphological findings can be unreliable
and complicated in diagnosis of MDS cases 10
. The standard
criteria for the MDS diagnosis are rely upon subjective
morphological interpretation and demonstration of clonal
cytogenetic abnormalities12-15
. Recent studies have showed
that flow cytometric immunophenotyping is less subjective
and more reproducible in comparison to morphological
assessment 16
. In recent times, a number of attempts have
done to examine the immunophenotypic characteristics of
BM in MDS11,17-26
.
Flow cytometric immunophenotyping of bone marrow
aspirates resulted in detection of myeloid, erythroid, and
megakaryocytic aberrancies in 30 cases with MDS (table 2).
Previous studies showed that erythroid cells aberrancies such
as low levels of CD71, low expression of CD235a and lower
proportions of CD235a+
/CD71+
in MDS patients. Importantly,
the main immunophenotypic aberration noted was the
extremely low CD71 expression on CD235a positive
erythroid progenitors6,23
. In addition to current literature, our
study also showed the low level of CD71 expression and low
percentages of CD235a. It is worth noting that the low
expression of CD235a+
/CD71+
was the most frequent
abnormality found in our MDS cases.
3. Qualitative Flow Cytometric Analysis of Malaysian Myelodysplastic Syndromes (MDS) Patients
Med J Malaysia Vol 67 No 1 February 2012 81
Hematopoietic Compartment Antibody Combination
Erythroid lineage CD71/CD235a/CD45/CD10
Granulocytic lineage HLA-DR/CD13/CD45/CD11b
Monocytic lineage CD14/CD33/CD45/CD34
Lymphoid lineage CD19/CD20/CD45/CD10
Table I: Monoclonal antibodies for flow cytometry analysis
Flow Cytometric Abnormality MDS % (n= 30 ) P values
Granulocytes (no) (%):
Abnormal Granularity 43.33 (13) 0.005
Presence of HLA-DR 20 (6) 0.029
Low expression of CD11b 20 (6) 0.210
Presence of CD34 13.33 (4) 0.218
Low expression of CD10 46.66 (14) 0.000
Monocytes:
Abnormal CD11b or HLA-DR expression 23.33 (7) 0.024
Low expression of CD13 43.33 (13) 0.005
Low expression of CD33 10 (3) 0.099
Low expression of CD14 20 (6) 0.337
Presence of CD14/CD34 20 (6) 0.037
Erythroid Lineage:
Low expression of CD71 53.33 (16) 0.000
Low expression of CD235a 40 (12) 0.000
Abnormal level of CD71 vs. CD235a 60 (18) 0.000
Table II: Immunophenotype abnormalities in haematopoietic cells of MDS cases
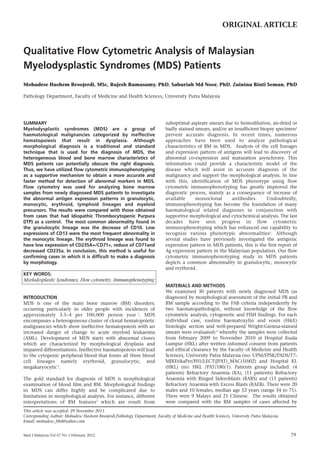
Fig. 1: Flow cytometric analysis of granulocytic population in
MDS and control cases: CD10 expression on granulocytic
population in control (A) and in MDS cases (B). Reduced
expression of CD10 on granulocyte populations can be
seen in MDS patients (p=0.000). Proportion of CD34+
granulocytes in control (C) and in MDS cases (D).
Expression of CD34+ granulocytes was higher (p=0.218) in
MDS cases as compared to control (Normally CD34 is
appeared on the surface of immature cells but in MDS
can be seen on mature cells).
Fig. 2: Flow cytometric analysis of erythroid population in MDS
and control cases: CD71 expression on CD235a+ cells in
control (A) and MDS cases (B). Lower proportion of
CD235a +/ CD71+ nucleated red cells can be seen in MDS
patients as compared to non-MDS (p=0.000). Proportion
of CD71 on nucleated red cells in control (C) and in MDS
cases (D). Lower expression of CD71 can be observed in
MDS cases as compared to control (p=0.000).
4. Original Article
82 Med J Malaysia Vol 67 No 1 February 2012
Veltroni et al. reported that 78% of MDS patients had
abnormalities either in myeloid or monocytic compartments
27
. Abnormal granularity was one of the aberrancies observed
in granulocytic lineages16
that was detected in about half of
the cases in our study. Kussick and Stachurski observed a
reduced CD33 and CD13 expression on the surface of all
granulocytes and monocytes16,28
. In line with this, the low
expression of CD13 and CD33 on granulocytes and
monocytes was also detected in our study. However the
decrease of CD33 and CD13 between the two groups of
monocytes was not significantly different (table 2). In
addition, a lower proportion of CD10+
granulocytes seen in
our study is also strongly supported by previous studies 5,11,16,24
.
Decreased expression of CD11b on granulocytes5, 30
and
monocytes24
was another characteristic of MDS cases.
Similarly, we found the decreased expression of CD11b on
granulocytes as well yet the difference between two groups
was not statistically significant.
In our study, as in previous literature, the low expression of
CD14 on monocytes was observed16,24
. However the main
abnormality of the monocytic lineage was reduce of CD13
expression. The aberrant presence of homogeneous HLA-DR
and CD11b on the myeloid blasts is another abnormality
found in MDS 28
. The increase of mature CD markers such as
CD11b was the similar to the survey by Kussick28
. The most
common abnormality in myeloid precursors was the
asynchronous expression of HLA-DR/CD11b. There were no
differences in antigen presence on lymphoid lineages
between MDS and controls.
CONCLUSION
In conclusion, although the combination of morphology and
cytogenetic methods is sufficient to render a diagnosis in
most MDS cases, yet it could be complicated when the cell
morphology is indeterminate. In cases where morphology
and cytogenetic analysis are not straight forward, flow
cytometric immunophenotyping could be used as tool in
establishing the diagnosis of MDS.
ACKNOWLEDGMENT
We would like to thank Dr Raudhawati Osman as the head of
haematology unit in Hospital Kuala Lumpur for allowing us
collecting and conducting this study and Madam Lee Siew
Moi, for the assistance in sample collection.
REFERENCES
1. Cazzola M, Malcovati L. Myelodysplastic syndromes-coping with
ineffective hematopoiesis. N Engl J Med. 2005.
2. Mufti GJ, Galton DA. Myelodysplastic syndromes: natural history and
features of prognostic importance. Clinical Haematology. 1986; 15: 953-71.
3. Stetler-Stevenson M. Flow cytometric immunophenotyping: Emerging as
an important diagnostic tool in the evaluation of cytopenic patients.
Leukemia Research. 2009; 33: 1020-1.
4. Truong F, Smith BR, Stachurski D, Cerny J, Medeiros LJ, Woda BA. The
utility of flow cytometric immunophenotyping in cytopenic patients with
a non diagnostic bone marrow: A prospective study. Leukemia Research.
2009; 33: 1039–46.
5. Craig FE, Foon KA. Flow cytometric immunophenotyping from
hematologic neoplasms. Blood. 2008; 111(8): 3941-67.
6. Stetler-Stevenson M, Arthur D, Jabbour, Xie XY, Molldrem J, Barrett J.
Diagnostic utility of flow cytometric immunophenotyping in
myelodysplastic syndrome. Blood. 2001; 98(4): 979-87.
7. Lorand-Metze I, Ribeiro E, Limaa CSP, Batista LS, Metze K. Detection of
hematopoietic maturation abnormalities by flow cytometry in
myelodysplastic syndromes and its utility for the differential diagnosis
with non-clonal disorders. Leukemia Research. 2007; 31: 147-55.
8. Van Lochem EG, Van der Velden VHJ, Wind HK, Te Marvelde JG,
Westerdaal NAC, Van Dongen JM. Immunophenotypic Differentiation
Patterns of Normal Hematopoiesis in Human Bone Marrow: Reference
Patterns for Age-Related Changes and Disease-Induced Shifts. Cytometry
Part B (Clinical Cytometry). 2004; 60B: 1-13.
9. Li C, Loken MR, Kao R, Wang T, Tsai S, Hsu S. Multidimensional Flow
Cytometry for Detection of Rare Populations in Hematological
Malignancies. TZU CHI MED J. 2009; 21(1).
10. Loken MR, van de Loosdrecht A, Ogata K, Orfao A, Wells DA. Flow
cytometry in myelodysplastic syndromes: Report from a working
conference. Leukemia Research. 2008; 32: 5-17.
11. Malcovati L, Della Porta MG, Lunghi M, Pascutto C, Vanelli L, Travaglino
E. Flow cytometry evaluation of erythroid and myeloid dysplasia in
patients with myelodysplastic syndrome. Leukemia Research. 2005; 19:
776-83.
12. Bennett JM, Catovsky D, Daniel MT. Proposals for the classification of the
myelodysplastic syndromes. Br J Haematol. 1982; 51: 189-99.
13. Kampmeier P, Anastasi J, Vardiman JW. Issues in the pathology of the
myelodysplastic syndromes. Hematol Oncol Clin North Am. 1992; 6: 501-
22.
14. Ost A, Reizenstein P. Minimal diagnostic criteria for the myelodysplastic
syndrome. Leuk Res. 1992; 16: 9-11.
15. Tricot GJ. Minimal diagnostic criteria for the myelodysplastic syndrome in
clinical practice. Leuk Res. 1992; 16: 5-9.
16. Stachurski D, Smith BR, Pozdnyakova O, Andersen M, Xiao Z, Raza A. Flow
cytometric analysis of myelomonocytic cells by a pattern recognition
approach is sensitive and specific in diagnosing myelodysplastic syndrome
and related marrow diseases: Emphasis on a global evaluation and
recognition of diagnostic pitfalls. Leukemia Research. 2008; 32: 215-24.
17. Della Porta MG, Malcovati L, Invernizzi R. Flowcytometry evaluation of
erythroid dysplasia in patients with myelodysplastic syndrome. Leukemia
Research. 2006; 20(4): 549-55.
18. Kussick SJ, Wood BL. Using 4-color flow cytometry to identify abnormal
myeloid populations. Arch Pathol Lab Med. 2003; 127: 1140-7.
19. Maynadie M, Picard F, Husson B. Immunophenotypic clustering of
myelodysplastic syndromes. Blood. 2002; 100: 2349-56.
20. Monreal MB, Pardo ML, Pavlovsky MA. Increased immature hematopoietic
progenitor cells CD34+/CD38dim in myelodysplasia. Cytometry B Clin
Cytom 2006; 70(2): 63-70.
21. Ogata K, Kishikawa Y, Satoh C. Diagnostic application of flow cytometric
characteristics of CD34+ cells in low-grade myelodysplastic syndromes.
Blood. 2006; 108(3): 1037-44.
22. Ogata K, Nakamura K, Yokose N. Clinical significance of phenotypic
features of blasts in patients with myelodysplastic syndrome. Blood. 2002;
100(12): 3887-96.
23. Schlesinger M, Silverman LR, Jiang JD. Analysis of myeloid and lymphoid
markers on the surface and in the cytoplasm of mononuclear bone marrow
cells in patients with myelodysplastic syndrome. J Clin Lab Immunol.
1996; 48: 149-66.
24. Wells DA, Benesch M, Loken MR, Vallejo C, Myerson D, Leisenring WM.
Myeloid and monocytic dyspoiesis as determined by flow cytometric
scoring in myelodysplastic syndrome correlates with the IPSS and with
outcome after hematopoietic stem cell transplantation. Blood. 2003;
102(1).
25. Wood BL. Flow cytometric diagnosis of myelodysplasia and
myeloproliferative disorders. J Biol Regul Homeost Agents. 2004; 18: 141-
5.
26. Xu D, Schultz C, Akker Y. Evidence for expression of early myeloid
antigens in mature, non-blast myeloid cells in myelodysplasia. Am J
Hematol. 2003; 74: 9-16.
27. Veltroni M, Sainati L, Zecca M, Fenu S, Tridello G, Testi AM. Advanced
Pediatric Myelodysplastic Syndromes: Can Immunophenotypic
Characterization of Blast Cells be a Diagnostic and Prognostic Tool?.
Pediatr Blood Cancer. 2009; 52: 357-63.
28. Kussick SJ, Fromm JR, Rossini A, Li Y, Chang A, Norwood TH. Four-Color
Flow Cytometry Shows Strong Concordance With Bone Marrow
Morphology and Cytogenetics in the Evaluation for Myelodysplasia. Am J
Clin Pathol. 2005; 124: 170-81.
29. Del Canizo MC, Fernandez E, Lopez A, Vidriales B, Villaron E, Arroyo JL.
Immunophenotypic analysis of myelodysplastic syndromes.
Hematologica. 2003; 88(04).
30. Valent P, Horny H, Bennett JM, Fonatsch C, Germing U, Greenberg P.
Definitions and standards in the diagnosis and treatment of the
myelodysplastic syndromes: Consensus statements and report from a
working conference. Leukemia Research. 2007; 31: 727-36.