
Recommended
More Related Content
Similar to giao-trinh-tu-hoc-matlab.pdf
Similar to giao-trinh-tu-hoc-matlab.pdf (20)
giao-trinh-tu-hoc-matlab.pdf
- 1. Pikachu – Vietdown.org Ch−¬ng 1 C¬ së Matlab 1.1 Tæng quan vÒ Matlab 1.1.1 Kh¸i niÖm vÒ Matlab Matlab lμ mét ng«n ng÷ lËp tr×nh thùc hμnh bËc cao ®−îc sö dông ®Ó gi¶i c¸c bμi to¸n vÒ kü thuËt.Matlab tÝch hîp ®−îc viÖc tÝnh to¸n, thÓ hiÖn kÕt qu¶, cho phÐp lËp tr×nh, giao diÖn lμm viÖc rÊt dÔ dμng cho ng−êi sö dông. D÷ liÖu cïng víi th− viÖn ®−îc lËp tr×nh s½n cho phÐp ng−êi sö dông cã thÓ cã ®−îc nh÷ng øng dông sau ®©y. • Sö dông c¸c hμm cã s½n trong th− viÖn, c¸c phÐp tÝnh to¸n häc th«ng th−êng • Cho phÐp lËp tr×nh t¹o ra nh÷ng øng dông míi. • Cho phÐp m« pháng c¸c m« h×nh thùc tÕ. • Ph©n tÝch, kh¶o s¸t vμ hiÓn thÞ d÷ liÖu. • Víi phÇn mÒm ®å ho¹ cùc m¹nh • Cho phÐp ph¸t triÓn,giao tiÕp víi mét sè phÇn mÒm kh¸c nh− C++, Fortran. 1.1.2 Tæng quan vÒ cÊu tróc d÷ liÖu cña MATLAB, c¸c øng dông Matlab lμ mét hÖ thèng t−¬ng giao,c¸c phÇn tö d÷ liÖu lμ mét m¶ng( m¶ng nμy kh«ng ®ßi hái vÒ kÝch th−íc ). Chóng cho phÐp gi¶i quyÕt c¸c vÊn ®Ò liªn quan ®Õn lËp tr×nh b»ng m¸y tÝnh,®Æc biÖt sö dông c¸c phÐp tÝnh vÒ ma trËn hay vÐc tor vμ cã thÓ sö dông ng«n ng÷ C häc Fortran lËp tr×nh råi thùc hiÖn øng dông lËp tr×nh ®ã b»ng c¸c c©u lÖnh goÞ tõ MATLAB .MATLAB ®−îc viÕt t¾t tõ ch÷ matrix laboratory tøc lμ th− viÖn vÒ ma trËn, tõ ®ã phÇn mÒm MATLAB ®−îc viÕt nh»m cung cÊp cho viÖc truy cËp vμo phÇn mÒm ma trËn mét c¸h dÔ dμng, phÇn mÒm ma trËn nμy ®−îc ph¸t triÓn bëi c¸c c«ng tr×nh Linpack vμ Eispack . Ngμy nay MATLAB ®−îc ph¸t triÓn bëi Lapack vμ Artpack t¹o nªn mét nghÖ thuËt phÇn mÒm cho ma trËn. a.D÷ liÖu D÷ liÖu cña MATLAB thÓ hiÖn d−íi d¹ng ma trËn( hoÆc m¶ng –tæng qu¸t), vμ cã c¸c kiÓu d÷ liÖu ®−îc liÖt kª sau ®©y • KiÓu ®¬n single , kiÓu nμy cã lîi vÒ bé nhí d÷ liÖu v× nã ®ßi hái Ýt byte nhí h¬n, kiÓu d÷ liÖu nμy kh«ng ®−îc sö dông trong c¸c phÐp tÝnh to¸n häc, ®é chÝnh x¸c kÐm h¬n • KiÓu double kiÓu nμy lμ kiÓu th«ng dông nhÊt cña c¸c biÕn trong MATLAB • KiÓu Sparse. • KiÓu int8, uint8, int16 . . . Trang 1
- 2. • KiÓu char vÝ dô ‘Hello’ • KiÓu cell. • KiÓu Structure. Trong MATLAB kiÓu d÷ liÖu double lμ kiÓu mÆc ®Þnh sö dông trong c¸c phÐp tÝnh sè häc. C¸c b¹n cã thÓ tham kh¶o c¸c kiÓu d÷ liÖu kh¸c trong ®Üa CD Help MATLAB 6.0 b. øng dông MATLAB t¹o ®iÒu kiÖn thuËn lîi cho: • C¸c kho¸ häc vÒ to¸n häc • C¸c kü s−, c¸c nhμ nghiªn cøu khoa häc • Dïng MATLAB ®Ó tÝnh to¸n ,nghiªn cøu t¹o ra c¸c s¶n phÈm tèt nhÊt trong s¶n xuÊt. c.Toolbox lμ mét c«ng cô quan träng trong Matlab C«ng cô nμy ®−îc MATLAB cung cÊp cho phÐp b¹n øng dông c¸c kü thuËt ®Ó ph©n tÝch, thiÕt kÕ , m« pháng c¸c m« h×nh . Ta cã thÓ t×m thÊy toolbox ë trong m« tr−êng lμm viÖc cña . • M¹ng n¬ron • Logic mê • Simulink 1.1.3 HÖ thèng MATLAB HÖ thèng giao diÖn cña MATLAB ®−îc chia thμnh 5 phÇn • M«i tr−êng ph¸t triÓn. §©y lμ n¬i ®Æt c¸c thanh c«ng cô, c¸c ph−¬ng tiÖn gióp chóng ta sö dông c¸c lÖnh vμ c¸c file, ta cã thÓ liÖt kª mét sè nh− sau. + Desktop + Command Window + Command History + Browsers for viewinghelp • Th− viÖn, c¸c hμm to¸n häc Bao gåm c¸c cÊu tróc nh− tÝnh tæng, sin cosin atan, atan2 etc.., c¸c phÐp tÝnh ®¬n gi¶n ®Õn c¸c phÐp tÝnh phøc t¹p nh− tÝnh ma trËn nghich ®¶o, trÞ riªng, chuyÓn ®æi furier ,laplace , symbolic library • Ng«n ng÷ MATLAB §ã lμ c¸c ng«n ng÷ cao vÒ ma trËn vμ m¶ng, víi c¸c dßng lÖnh, c¸c hμm, cÊu tróc d÷ liÖu vμo , cã thÓ lËp tr×nh h−íng ®èi t−îng. • §å ho¹ trong MATLAB Trang 2
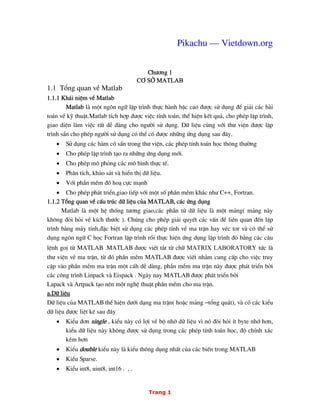
- 3. Bao gåm c¸c c©u lÖnh thÓ hiÖn ®å h¹o trong m«i tr−êng 2D vμ 3D, t¹o c¸c h×nh ¶nh chuyÓn ®éng, cung cÊp c¸c giao diÖn t−¬ng t¸c gi÷a ng−êi sö dông vμ m¸y tÝnh . • Giao tiÕp víi c¸c ng«n ng÷ kh¸c. MATLAB cho phÐp t−¬ng t¸c víi c¸c ng«n ng÷ kh¸c nh− C , Fortran 1.1.4 Lμm quen víi matlab Tr−íc tiªn ®Ó khëi ®éng MATLAB b¹n kÝch ®óp (hoÆc ®¬n) vμ biÓu t−îng file MATLAB.exe ,trªn mμn h×nh xuÊt hiÖn cöa sæ sau.( Xem h×nh vÏ 1.1 ) Cöa sæ ®ã chøa c¸c thanh c«ng cô( giao diÖn ng−êi vμ m¸y) cÇn thiÕt cho viÖc qu¶n lý c¸c files, c¸c biÕn ,cöa sæ lÖnh, cã thÓ coi desktop lμ c¸c panel gåm c¸c «, vïng, qu¶n lý vμ t¸c dông cña tõng cöa sæ nhá ®−îc qu¶n lý bëi desktop H×nh vÏ 1.1 Trang 3
- 4. Trªn h×nh vÏ ta thÊy cöa sæ desktop(cöa sæ lín nhÊt), vμ c¸c cöa sæ phô cña nã 1.1.5 Lμm viÖc víi c¸c cöa sæ cña MATLAB ®−îc qu¶n lý bëi desktop a. Cöa sæ Command window : Lμ cöa sæ giao tiÕp chÝnh cña Matlab bëi ®©y lμ n¬i nhËp gi¸ trÞ c¸c biÕn, hiÓn thÞ gi¸ trÞ,tÝnh to¸n gi¸ trÞ cña biÓu thøc, thùc thi c¸c hμm cã s½n trong th− viÖn (d¹ng lÖnh), hoÆc c¸c hμm(d¹ng function) do ng−êi dïng lËp tr×nh ra trong M-files. C¸c lÖnh ®−îc ®−îc nhËp sau dÊu nh¾c ‘ >> ‘, vμ nÕu cã sai sãt trong qu¸ tr×nh gâ(nhËp) lÖnh th× h·y nhÊn phÝm Enter cho ®Õn khi nhËn ®−îc dÊu nh¾c >>. Thùc thi lÖnh b»ng nhÊn phÝm Enter. Gâ c¸c lÖnh sau: >> A= pi/2 ; >> B= sin(A) B= 1 HoÆc ch−¬ng tr×nh so¹n th¶o trong M-file d−íi ®©y: % Chuong trinh trong M-file x= 0:pi/6:2*pi; y=sin(x); plot(x,y); % chuong trinh ®−îc l−u víi tªn file lμ ve_sin.m thùc thi ch−¬ng tr×nh trªn trong cöa sæ Command window b»ng dßng lÖnh sau >> ve_sin Chóng ta thÊy râ h¬n trong môc “ Sö dông lÖnh trùc tiÕp “ ë phÇn sau. b. Cöa sæ command History C¸c dßng mμ b¹n nhËp vμo trong cöa sæ Command window ( c¸c dßng nμy cã thÓ lμ dßng nhËp biÕn ,hoÆc cã thÓ lμ dßng lÖnh thùc hiÖn hμm nμo ®ã ) ®−îc gi÷ l¹i trong cöa sæ Command History ,vμ cöa sæ nμy cho phÐp ta sö dông l¹i nh÷ng lÖnh ®ã b»ng c¸ch kÝch Trang 4
- 5. ®«i chuét lªn c¸c lÖnh ®ã hoÆc c¸c biÕn, nÕu nh− b¹n muèn sö dông l¹i biÕn ®ã. Xem h×nh 1.2 KÝch ®«i chuét lªn lªnh hoÆc biÕn ®Ó sö dông l¹i H×nh 1.2 c. Cöa sæ Workspace: Lμ cöa sæ thÓ hiÖn tªn c¸c biÕn b¹n sö dông cïng víi kÝch th−¬c vïng nhí(sè bytes), kiÓu d÷ liÖu(líp) ,c¸c biÕn ®−îc gi¶i phãng sau mçi lÇn t¾t ch−¬ng tr×nh.(xem h×nh 1.3) Yªu KÝch ®«i chuét lªn biÕn ®Ó xem d÷ liÖu(hoÆc thay ®æi gi¸ trÞ) H×nh 1.3 Ngoμi ra nã cho phÐp thay ®æi gi¸ tri , còng nh− kÝch th−íc cña biÕn b»ng c¸ch kÝch ®«i chuét lªn c¸c biÕn. HoÆc kÝch vμo nót bªn tr¸i ngay c¹nh nót save VÝ dô khi chän biÕn(gi¶ thö lμ biÕn b) råi kÝch ®óp(hoÆc kÝch chuét vμo nót c¹nh nót save) ta ®−¬c cöa sæ sau gäi lμ Array Editor: xem h×nh 1.4 Trang 5
- 6. Tiªu ®Ò lμ tªn biÕn b , ®Þnh d¹ng d÷ liÖu ë « cã tªn lμ: Numeric format, mÆc ®Þnh lμ d¹ng short, KÝch th−íc size lμ 1 by 3 (tøc lμ mét hμng vμ 3 cét) ta cã thÓ thay ®æi kÝch th−íc nμy b»ng c¸ch thay ®æi sè cã trong « kÝch th−íc size. + Dïng cöa sæ nμy ®Ó l−u c¸c biÕn ë d−íi lμ d÷ liÖu cña biÕn b, ta cã thÓ thay ®æi chóng b»ng c¸ch thay ®æi gi¸ trÞ trong c¸c « ®ã H×nh 1.4 VÝ dô NhËp biÕn >>b=[1 2 3 ]; >>x=pi; TÊt c¶ c¸c biÕn ®Òu ®−îc l−u trong Workspace trong ®ã thÓ hiÖn c¶ kÝch th−íc (Size), sè Bytes vμ kiÓu d÷ liÖu(class) (8 bytes cho mçi phÇn tö d÷ liÖu kiÓu double cô thÓ lμ 24 bytes dμnh cho b vμ 8 bytes dμnh cho a) d. Cöa sæ M-file Lμ mét cöa sæ dïng ®Ó so¹n th¶o ch−¬ng tr×nh øng dông, ®Ó thùc thi ch−¬ng tr×nh viÕt trong M-file b»ng c¸ch gâ tªn cña file chøa ch−¬ng tr×nh ®ã trong cöa sæ Commandwindow. Khi mét ch−¬ng tr×nh viÕt trong M-file, th× tuú theo øng dông cô thÓ, tuú theo ng−êi lËp tr×nh mμ ch−¬ng tr×nh cã thÓ viÕt d−íi d¹ng sau +D¹ng Script file :Tøc lμ ch−¬ng tr×nh gåm tËp hîp c¸c c©u lÖnh viÕt d−íi d¹ng liÖt kª ,kh«ng cã biÕn d÷ liÖu vμo vμ biÕn lÊy gi¸ trÞ ra +D¹ng hμm function cã biÕn d÷ liÖu vμo vμ biÕn ra. e. §−êng dÉn th− môc: N¬i l−u gi÷ c¸c file ch−¬ng tr×nh 1.2 NhËp biÕn,lÖnh trùc tiÕp tõ cöa sæ Command Window: Sau khi xuÊt hiÖn dÊu nh¾c >> trong cöa sæ command window ®iÒu ®ã ®ång nghÜa cho phÐp b¹n nhËp biÕn hoÆc thùc hiÖn c¸c c©u lÖnh mong muèn. Trang 6
- 7. Do d÷ liÖu cña MATLAB ®−îc thÓ hiÖn d−íi d¹ng matrËn cho nªn c¸c biÕn dïng trong MATLAB d÷ liÖu cña nã còng thÓ hiÖn d−íi d¹ng ma trËn, viÖc ®Æt tªn biÕn kh«ng ®−îc ®Æt mét c¸h tuú tiÖn mμ ph¶i ®Æt theo mét quy ®Þnh • Tªn ma trËn(biÕn) ph¶i b¾t ®Çu b»ng mét ch÷ c¸i, vμ cã thÓ chøa ®Õn 19 ký tù lμ sè hoÆc ch÷. • Bªn ph¶i dÊu b»ng lμ c¸c gi¸ trÞ cña ma trËn • DÊu chÊm phÈy(; )lμ ®Ó ph©n c¸ch c¸c hμng, cßn c¸c gi¸ trÞ trong hμng ®−îc ph©n c¸ch nhau bëi dÊu phÈy(,) hoÆc dÊu c¸ch( phÝm space). • KÕt thóc nhËp ma trËn th−êng cã dÊu chÊm phÈy hoÆc kh«ng tuú theo b¹n muèn thÓ hiÖn kÕt qu¶ cña nã hay kh«ng. a. NhËp c¸c biÕn, matrËn, c¸c lÖnh liÖt kª trùc tiÕp Th«ng th−êng Matlab sö dông 4 vÞ trÝ sau dÊu phÈy cho c¸c sè thËp ph©n cã dÊu phÈy chÊm ®éng, vμ sö dông biÕn “ ans “ cho kÕt qu¶ cña phÐp tÝnh. Ta cã thÓ ®¨ng ký biÕn thÓ hiÖn kÕt qu¶ nμy cña riªng m×nh . XÐt tËp c¸c lÖnh sau: VÝ dô tr−êng hîp kh«ng sö dông biÕn l−u kÕt qu¶, biÕn ans tù ®éng ®−îc g¸n >> 8+9 ans = 17 NhËp biÕn r = 8/10 trong cöa sæ CommandWindow nh− sau: >> r = 8/10 r=0.8000 B¹n cã thÓ sö dông c¸c biÕn nμy cho c¸c phÐp tÝnh tiÕp theo vÝ dô nh−: >> s=10*r s= 8 VÝ dô nhËp trùc tiÕp c¸c sè liÖu nh− sau >> a=[1 2;3 4] a = 1 2 3 4 Matlab cã hμng tr¨m hμm ®−îc ®Þnh nghÜa s½n vÝ dô nh− hμm tÝnh sin .. . >> x=pi; %nhËp biÕn x >> sin(x) % nhËp lÖnh sin(x), Ên enter ®Ó thùc hiÖn lÖnh tÝnh sin(x) ans = 1.2246e-016 + C¸c phÐp tÝnh sö dông trong Matlab : Trang 7
- 8. Trong MATLAB còng sö dông c¸c phÐp to¸n th«ng th−êng ®−îc liÖt kª trong b¶ngsau Ký tù ý nghÜa LÖnh Matlab + Céng a + b a+b - Trõ a - b a-b * Nh©n ab a*b / Chia ph¶i a/b= b a a/b Chia tr¸i ba = b a b/a ^ Mò a^b a^2 Thø tù −u tiªn c¸c phÐp to¸n: TÊt c¶ c¸c biÓu thøc to¸n häc ®Òu ®−îc thùc hiÖn tõ tr¸i qua ph¶i, ta cã b¶ng thø tù −u tiªn nh− sau: Thø tù −u tiªn C¸c phÐp 1 DÊu ngoÆc trong biÓu thøc 2 To¸n tö mò ^ , thùc thi tõ tr¸i qua ph¶i 3 To¸n tö nh©n, chia cã cïng møc −u tiªn,thùc hiÖn tõ tr¸i sang ph¶i . 4 Céng , trõ VÝ dô1 : >> a=[1 2;3 4]; >> b=[5 6;7 8]; >> a+b^2 ans = 68 80 94 110 VÝ dô2 Gi¶i ph−¬ng tr×nh bËc hai, c¸c lÖnh nhËp trong cña sæ CommandWindow >>a= 1; >>b=-2; >>c=1; >>delta= b^2- 4*a*c; >>x1=(-b+ sqrt(delta) )/(4*a); >>x2=(-b- sqrt(delta) )/(4*a); Trang 8
- 9. Chó ý : + C¸c lÖnh ®−îc kÕt thóc b»ng dÊu chÊm phÈy, Matlab sÏ kh«ng thÓ hiÖn kÕt qu¶ trªn mμn h×nh, ng−îc l¹i kh«ng cã dÊu chÊm phÈy Matlab sÏ thÓ hiÖn kÕt qu¶. + Trong qu¸ tr×nh nhËp ma trËn nÕu c¸c phÇn tö trªn mét hμng dμi qu¸ ta cã thÓ xuèng dßng b»ng to¸n tö ba chÊm( . . . ) VÝ dô >>Number_apples=10;Number_Oranges=25,Number_bananas=34; >>Fruit_Purchased= Number_apples+ Number_Oranges+ ... Number_bananas 1.3 Sö dông c¸c lÖnh gi¸n tiÕp tõ c¸c file d÷ liÖu Nh− ®· tr×nh bμy trong phÇn cöa sæ M-file, tËp hîp c¸c lÖnh cña MATLAB ®−îc so¹n th¶o trong cöa sæ M-file d−íi d¹ng Script file hoÆc d¹ng hμm function(cã biÕn ®Çu vμo vμ ra), vμ ®−îc ghi (l−u)vμo file d÷ liÖu cã phÇn më réng lμ .m (Th«ng th−êng c¸c ch−¬ng tr×nh so¹n th¶o trong M-file th−êng ®−îc l−u theo ®−êng dÉn C:matlab workTªn_file ), muèn thùc thi ch−¬ng tr×nh so¹n th¶o ®ã ta gäi lÖnh trong cöa sæ Commandwindow, tuú theo ch−¬ng tr×nh viÕt d¹ng Script file hay function mμ trong cöa sæ ta cã 2 c¸ch gäi nh− sau: • §èi víi ch−¬ng tr×nh viÕt d¹ng Script file >> tªn_file ; a=1; b=-2; c=1; delta=b^2-4*a*c; x1=(-b+sqrt(delta))/(2*a) x2=(-b-sqrt(delta))/(2*a) % l−u vμo file GPTB2.m VÝ dô gi¶i ph−¬ng tr×nh bËc hai t×m nghiÖm x1 vμ x2 viÕt trong M-file d¹ng Scriptfile: Thùc thi ch−¬ng tr×nh trªn trong cöa sæ CommandWindow b»ng lÖnh >>GPTB2 • §èi víi ch−¬ng tr×nh viÕt d¹ng function ,cã tham sè ®Çu vμo vμ ra,ta ph¶i truyÒn ®ñ c¸c tham sè cÇn thiÕt. VÝ dô : Gi¶i ph−¬ng tr×nh bËc hai víi ba tham sè ®Çu vμo lμ c¸c hÖ sè a , b, c vμ hai biÕn ®Çu ra lμ nghiÖm cña ph−¬ng tr×nh x1 vμ x2 (Xem c¸ch viÕt hμm function ë môc sau) Trang 9 function [x1, x2] =GPTB2(a,b,c) x1=(-b+sqrt(delta))/(2*a); %Tinh nghiem x1 x2=(-b- sqrt(delta))/(2*a);
- 10. Thùc hiÖn bμi to¸n trªn trong Command window nh− sau: >>[x1,x2]=GPTB2 (a,b,c) % cÊu tróc chung lμ [x1,x2]=Tªn_file (a,b,c) ( hoÆc [x1,x2]=GPTB2(1,-2,1) ) >>a= 1; >>b=-2; >>c=1; L−u ý r»ng khi viÕt ch−¬ng tr×nh trong M-file, b¹n muèn ghi chó thÝch ta dïng ký tù % ®Æt tr−íc dßng chó thÝch nh− sau %----------dßng chó thÝch -------------- %ViÕt trong M-file(d¹ng Script file) x=0:0.1:10 ; %T¹o vector x y=cos(x); plot(x,y); % VÏ ®å thÞ hμm cosin %l−u vμo file cã tªn lμ dai1.m VÝ dô 2 Thùc thi hμm trªn cöa sæ commandwindow b»ng lÖnh >> dai1 ViÕt ch−¬ng tr×nh trong M-file ®−îc dïng lμ chñ yÕu ,®Æc biÖt ®èi víi nh÷ng ch−¬ng tr×nh dμi , phøc t¹p th× b¹n nªn viÕt trong M-file. 1.4 Dßng nh¾c g¸n gi¸ trÞ biªn §èi víi b¹n ®· häc lËp tr×nh Pascal, b¹n muèn nhËp gi¸ trÞ khi thùc thi ch−¬ng tr×nh b¹n dïng cÆp lÖnh: writeln( 'NhËp gi¸ trÞ cña a='); readln(a); Nh−ng ®èi víi MATLAB th× b¹n sÏ thÊy rÊt ®¬n gi¶n chØ dïng mét lÖnh duy nhÊt ®ã lμ : a=input(‘Nhap gia tri cua a=’); VÝ dô: Trong cöa sæ Commandwindow ta gâ lÖnh >> a =input(‘nhap a=’); Trang 10
- 11. NhÊn Enter cho kÕt qu¶ d−íi d¹ng nhap a= 3; ®ång nghÜa víi viÖc g¸n a=3. Sö dông dßng nh¾c g¸n gi¸ trÞ biªn trong tr−êng hîp ta muèn thay ®æi gi¸ trÞ c¸c biÕn lóc thùc thi ch−¬ng tr×nh. VÝ dô : sö dông dßng nh¾c g¸n gi¸ trÞ biªn ®Ó gi¶i ph−¬ng tr×nh bËc hai % Ch−¬ng tr×nh viÕt trong M-file, b¹n cã thÓ viÕt trong CommandWindow a=input(‘nhap he so a=’); b=input(‘nhap he so b=’); c=input(‘nhap he so c-=’); Delta=b^2-4*a*c; x1=(-b+ sqrt(Delta))/(2*a) x2=(-b+ sqrt(Delta))/(2*a) 1.5 C¸ch t¹o mét hμm function Tr−íc hÕt ta thèng nhÊt r»ng, ®Ó t¹o mét hμm function ta ph¶i so¹n th¶o nã trong M- file. CÊu tróc hμm nh− sau: c©u lÖnh 2; c©u lÖnh 3; ……….... c©u lÖnh n; %kÕt thóc ch−¬ng tr×nh khi kÕt thóc c©u lÖnh %Khai b¸o hμm cã tõ kho¸ function function[danh s¸ch tªn kÕt qu¶]= Tªn_hμm(danh s¸ch c¸c biÕn ®Çu vμo) % Th©n ch−¬ng tr×nh c©u lÖnh 1; Chó ý: • Danh s¸ch tªn kÕt qu¶, vμ tham sè ®Çu vμo ®−îc c¸ch nhau b»ng dÊu phÈy. VÝ dô : function[x1,x2,x3]=dai2(a,b,c,d) • Th©n ch−¬ng tr×nh kh«ng b¾t ®Çu b»ng tõ kho¸ Begin vμ kh«ng kÕt thóc b»ng tõ kho¸ End nh− Ng«n ng÷ lËp tr×nh Pascal. • Ta nªn l−u vμo file cã tªn trïng víi tªn hμm VÝ dô: Cho s¬ ®å khèi cña hÖ thèng ®iÒu khiÓn tù ®éng nh− h×nh d−íi ®©y 2 2 den num 1 1 den num y u (- Trang 11
- 12. NhiÖm vô: TÝnh hμm truyÒn kÝn cña hÖ thèng Ch−¬ng tr×nh cã thÓ ®−îc viÕt nh− sau: function[numk, denk]=ham_truyen(num1, den1, num2, den2) numh=conv(num1, num2);% conv lμ hμm nh©n, hμm nμy ®−îc ®Þnh nghÜa s½n denh=conv(den1,den2); numk=numh; m=length(denh)- length(numh); numh1=[zeros(:,m), numh]; denk= numh1+denh; %kÕt thóc ch−¬ng tr×nh t¹i ®©y b¹n nªn l−u vμo file cã tªn lμ ham_truyen. Thùc thi hμm: >> num1=[1 1]; >>den1=[1 2 1]; >>num2=[1 2]; >>den2=[1 2 1 4]; >>[numk,denk]=ham_truyen(num1,den1,num2,den2); 1.6 Sö dông hμm cã s½n Cã rÊt nhiÒu hμm cã s½n, ®ã lμ c¸c hμm ®· ®−îc lËp tr×nh s½n,vμ ®−îc ®−a vμo th− viÖn, ®Ó xem mét hμm còng nh− cÊu tróc, c¸ch sö dông ta dïng lÖnh >>help tªn_hμm VÝ dô Ta muèn xem cÊu tróc hμm ode23 >>help ode23 1.7 VÏ c¸c hμm Dïng lÖnh fplot ®Ó vÏ c¸c hμm, hμm nμy cã thÓ cã s½n(vÝ dô nh− sin, cos . . .), hoÆc c¸c hμm t¹o bëi ng−êi dïng viÕt trong M-file d¹ng function CÊu tróc: fplot(‘Tªn_hμm’,[Xmin ,Xmax] ,tol,N,’LineSpec’);hoÆc fplot( @Tªn_hμm,[Xmin ,Xmax] ,tol,N,’LineSpec’); L−u ý:§èi víi c¸c hμm to¸n häc cã s½n(kh«ng ph¶i ®Þnh nghÜa) vÝ dô nh− sin, cos ,... th× cã thÓ thùc hiÖn nh− sau: + fplot(‘sin(x)’,2*pi*[-1 1] ) %vÏ y=sin(x) víi x=[-2*pi 2*pi]; + fplot([sin(x),tan(x),cos(x)]’, 2*pi*[-1 1] ); Trang 12
- 13. %vÏ ba ®å thÞ trªn cïng mét cöa sæ víi x=[-2*pi 2*pi] ; • Dïng hμm inline vÝ dô : f=inline(‘x+2’); fplot(f,[0 2] ); • §èi víi c¸c hμm trong M-file cã thÓ sö dông c¸c c¸ch sau VÝ dô: TÝnh f1, f2, f3 Hμm FUNC sÏ tr¶ vÒ mét vector hμng øng víi mçi gi¸ trÞ cña x, vÝ dô x=[x1;x2] th× hμm FUNC sÏ tr¶ vÒ ma trËn sau ®©y. f1(x1) ,f2(x1), f3(x1) f1(x2) ,f2(x2), f3(x2) Lîi dông ®Æc ®iÓm nμy ta cã thÓ vÏ nhiÒu ®å thÞ trªn cïng mét cöa sæ th«ng qua vÝ dô sau: f1= x+3; f2=x; f3=x.^2; %l−u vμo file FUNC.m %T¹o hμm Y function Y=myfun(x) Y(:,1)=200*sin(x(:))./(x(:); Y(:,2)=x(:).^2; %l−u vμo file cã tªn lμ myfun.m function [f1,f2,f3]= FUNC(x) Thùc thi ch−¬ng tr×nh trªn trong Commandwindow >>fplot( ‘myfun’,[-20 20] ); (hoÆc dïng >>fplot(@myfun ,[-20 20] ) C¸c th«ng sè tol, N , LineSpec lÇn lùot lμ sai sè liªn quan(t−¬ng ®èi), sè ®iÓm Ýt nhÊt, biÓu diÔn thuéc tÝnh cña ®−êng. Chó ý:Khi b¹n muèn h¹n chÕ kho¶ng biÓu diÔn c¶ trôc x vμ y th× dïng [Xmin Xmax Ymin Ymax] . 1.8 L−u vμ lÊy d÷ liÖu Víi Matlab khi tho¸t khái ch−¬ng tr×nh(t¾t),c¸c biÕn d÷ liÖu(trongWorkspace) sÏ bÞ mÊt,do vËy khi thùc hiÖn l¹i ch−¬ng tr×nh b¹n ph¶i khai b¸o l¹i c¸c biÕn cÇn thiÕt trªn, Trang 13
- 14. ®iÒu nμy g©y mÊt thêi gian, vμ biÖn ph¸p tèt lμ b¹n l−u tÊt c¶ c¸c biÕn cÇn thiÕt cho ch−¬ng tr×nh cña b¹n vμo file riªng, vμ khi cÇn chóng ta gäi chóng ra b»ng mét lÖnh L−u d÷ liÖu cã thÓ lμ : • L−u tÊt c¶ c¸c biÕn trong vïng lμm viÖc( Workspace) hoÆc • Mét sè biÕn nhÊt ®Þnh tuú theo nhu cÇu . Sau ®©y lμ c¸c c¸ch l−u c¸c biÕn d÷ liÖu: 1.8.1 L−u vμ lÊy d÷ liÖu d−íi file nhi ph©n(binary) L−u d÷ liÖu: >>save('C:matlabR12workten_file') %l−u toμn bé biÕn trong Workspace >>save('C:matlabR12workten_file', 'x','y')% chØ l−u biÕn x vμ y Chó ý: C:matlabR12workten_file lμ ®−êng dÉn tíi file, th«ng th−êng khi cμi ®Æt ch−¬ng tr×nh th× mÆc ®Þnh lμ cμi vμo æ C (nÕu b¹n cμi vμo æ D, khi sö dông lÖnh save, b¹n chØ cÇn thay ®æi thμnh :D:matlabR12workten_file) VÝ dô: Kh«i phôc l¹i d÷ liÖu dïng lÖnh sau: load ('C:matlabR12workten_file') % lÊy d÷ liÖu VÝ dô: B©y giê ta xo¸ hai biÕn a vμ b ra khái ch−¬ng tr×nh vμ thùc hiÖn lÖnh load ®Ó lÊy l¹i d÷ liÖu: %ViÕt trong Command Window >>a=1; >>b=1; >>c=-2; >>save('C:matlabR12workBien', 'x','y') >>clear a ; %xo¸ biÕn a >>clear b ; %xo¸ biÕn b >> load ('C:matlabR12workten_file') >>a %kiÓm tra xem a ®· kh«i phôc l¹i ch−a a=1 >>b%kiÓm tra xem b ®· kh«i phôc l¹i ch−a b=1 1.8.2 L−u vμ lÊy d÷ liÖu d−íi file ASCII >>save('C:matlabR12workten_file','-ASCII'). L−u toμn bé biÕn trong workspace vμo file Trang 14
- 15. >>save('C:matlabR12workten_file','x','y','-ASCII'). L−u hai biÕn x vμ y vμo file >>load ('C:matlabR12workten_file', '-ASCII '). khi thùc hiÖn lÖnh nμy th× trong Workspace sÏ xuÊt hiÖn biÕn cã tªn lμ tªn cña file , kÝch ®óp chuét lªn biÕn nμy sÏ xuÊt hiÖn d÷ liÖu cña toμn bé biÕn ®−îc l−u gi÷, viÖc truy nhËp ®Õn biÕn l−u gi÷ th«ng qua viÖc truy nhËp kiÓu MatrËn VÝ dô Command window >>a=2; >>b=3; >>c=4; >>save('C:matlabR12work save')%l−u 3 biÕn trong file tªn save >> load('C:matlabR12work save')%kh«i phôc d÷ liÖu hoÆc >> save('C:matlabR12work save', 'a','b')%l−u hai biÕn a vμ b trong file %tªn save T−¬ng tù: >>a=3; >>b=4; >>save('C:matlabR12worksave','a','b','-ASCII') >>load('C:matlabR12worksave','-ASCII') %kh«i phôc d÷ liÖu Trong workspace sÏ cã biÕn save nh− sau: KÝch ®óp vμo save sÏ xuÊt hiÖn d÷ liÖu cña hai biÕn a vμ b HoÆc ®¬n gi¶n ®Ó l−u biÕn b¹n cã thÓ chän biÕn råi kÝch vμo nót save trong cöa sæ Workspace 1.9 C¸c to¸n tö logic vμ c¸c lÖnh ®iÒu kiÖn Trang 15
- 16. 1.9.1 C¸c to¸n tö quan hÖ Mét biÓu thøc logic trong MATLAB cã ®−îc tõ sù so s¸nh c¸c ®¹i l−îng kh¸c nhau(vÝ dô hai ®¹i l−îng A vμ B). Nh÷ng ký hiÖu thÓ hiÖn sù so s¸nh ®−îc gäi lμ c¸c to¸n tö quan hÖ , sau ®©y lμ liÖt kª c¸c to¸n tö B¶ng liÖt kª c¸c to¸n tö quan hÖ To¸n tö quan hÖ ý nghÜa < Nhá h¬n vd A<B > Lín h¬n vd A>B <= Nhá h¬n hoÆc b»ng A<=B >= Lín h¬n hoÆc b»ng A>=B == B»ng vd A==B ~= Kh«ng b»ng vd A~=B C¸c to¸n tö quan hÖ thùc hiÖn viÖc sã s¸nh tõng phÇn tö cña m¶ng, chóng tr¶ l¹i mét m¶ng cã cïng kÝch th−íc víi hai m¶ng trªn( hai m¶ng ban ®Çu ph¶i cã cïng kÝch th−íc nÕu kh«ng sÏ g©y ra lçi),víi c¸c phÇn tö trong m¶ng lμ 0 hoÆc 1 t−¬ng øng víi c¸c quan hÖ so s¸nh lμ sai hay ®óng Tr−êng hîp ®Æc biÖt so s¸nh hai sè phøc: + Khi dïng c¸c to¸n tö quan hÖ lμ < hoÆc > th× chØ so s¸nh phÇn thùc cña nã mμ th«i . + Khi dïng c¸c to¸n tö quan hÖ <= hoÆc >= th× so s¸nh c¶ phÇn thùc lÉn phÇn ¶o Khi so s¸nh hai chuçi . Dïng to¸n tö strcmp CÊu tróc: strcmp( chuçi1, chuçi2) VÝ dô : >>Chuoi1= ‘Pham Duc Dai’; >>Chuoi2=’Vu van van’; >>ss=strcmp(Chuoi1, Chuoi2); ss=0 Chó ý : Khi so s¸nh mét sè v« h−ãng víi mét ma trËn th× sè ®ã ®−îc nh©n víi mét m tr¹n ones(size(ma trËn so s¸nh)) sao cho nã cã kÝch th−íc gièng víi ma trËn cÇn so s¸nh råi míi so s¸nh . VÝ dô: X=5; X>=[1 2 3 ; 4 5 6; 7 8 9] Ù X=5*ones(3,3); X>[1 2 3 ; 4 5 6; 7 8 9] KÕt qu¶ tr¶ vÒ : ans= Trang 16
- 17. 1 1 1 1 1 0 0 0 0 1.9.2 C¸c to¸n tö logic (Logical Operator & | ~) CÊu tróc: To¸n tö logic ý nghÜa & Vμ vd A&B | HoÆc vd A|B ~ §¶o vd ~A C¸c ký hiÖu & , | ,~ lμ c¸c to¸n tö logic vμ hoÆc ®¶o. Chóng thùc hiÖn trªn tõng phÇn tö cña cña c¸c m¶ng so s¸nh( to¸n tö logic cho phÐp thùc hiÖn trªn nhiÒu m¶ng víi yªu cÇu lμ c¸c m¶ng ph¶i cã cïng kÝch th−íc), kÕt qu¶ tr¶ vÒ lμ mét ma trËn cã cïng kÝch th−íc víi c¸c ma tr¹n so s¸nh trªn. C¸c to¸n tö logic th−êng dïng ®Ó liªn kÕt c¸c biÓu thøc quan hÖ. B¶ng ch©n lý: §Çu vμo And Or Xor Not A B A&B A|B xor(A,B) ~A 0 0 0 0 0 1 0 1 0 1 1 1 1 0 0 1 1 0 1 1 1 1 0 0 Møc −u tiªn cao nhÊt ®èi víi to¸n tö logic ®¶o( not ,~) , hai to¸n tö and vμ | cã cïng møc −u tiªn , trong mét biÓu thøc to¸n häc th× chóng ®−îc thùc hiÖn theo thø tù tõ tr¸i sang ph¶i. Ta cã thÓ sö dông c¸c to¸n tö ‘and’ , ‘or’ ,’not’ ⇔ & , | , ~ nh− b¶ng sau: A&B and(A,B) A|B or(A,B) ~A not(A) >>X=5; >>X >=[1 2 3 ; 4 5 6; 7 8 9] ans 1 1 1 1 1 0 0 0 0 Trang 17
- 18. Chó ý trong c¸c biÓu thøc sö dông c¸c to¸n tö locgic th× ta nªn dïng dÊu ngoÆc ®Ó x¸c ®Þnh râ rμng ,vμ ®¶m b¶o tÝnh t−¬ng thÝch trong c¸c phiªn b¶n míi cña Matlab Tæng kÕt: • C¸c phÐp tÝnh sè häc sÏ ®−îc thùc hiÖn tr−íc khi thùc hiÖn c¸c biÓu thøc logic. • Khi tÝnh to¸n ta nªn thªm dÊu ngoÆc ®¬n ®Ó lμm biÓu thøc trë nªn s¸ng sña h¬n. • GÆp nh÷ng biÓu thøc phøc t¹p sÏ sö lý c¸c tÝnh to¸n sè häc tr−íc, sau ®ã c¸c to¸n tö logic ®−îc xem xÐt tõ tr¸i qua ph¶i . 1.10 C¸c c©u lÖnh ®iÒu kiÖn, rÏ nh¸nh 1.10.1 C©u lÖnh ®iÒu kiÖn if. CÊu tróc % §©y lμ cÊu tróc ®¬n gi¶n nhÊt. if expression Statements; end; % CÊu tróc sö dông lÖnh elseif ,else vμ if ®−îc viÕt liÒn if expression1 Statements; elseif expression2 Statement; else Statements; end BiÓu thøc expression bao gåm c¸c to¸n tö quan hÖ vÝ dô nh− (count<limit) hoÆc (height- offset)>0 ), Ngoμi ra nã cßn kÕt hîp víi c¸c to¸n tö logic ®Ó liªn kÕt c¸c biÓu thøc quan hÖ. VÝ dô 1: if (count<limit)&((height-offset)>0) function v= lnearspace(a,b,n) if n<2 error(‘Ban nhap sai, it nhat n phai lon hon 1’); end; h=(b-a)/(n-1); v=a:h:b; VÝ dô 2: Cho kho¶ng [a b], viÕt ch−¬ng tr×nh chia kho¶ng nμy thμnh n kho¶ng b»ng nhau víi n cho tr−íc. -------------------------------------------------------------------------- Thùc thi ch−¬ng tr×nh trªn trong Command window nh− sau: >> v=Soan1(5,1,5) v = Trang 18 5 4 3 2 1
- 19. VÝ dô 3: Ch−¬ng tr×nh x¸c ®Þnh dÊu cña sè nhËp vμo : function s= sign(x) if x>0 s=1; % so duong elseif x<0 s=-1; % so am else s=0; % so =0 end; Nguyªn t¾c lμm viÖc cña lÖnh if nh− sau :Khi biÓu thøc expression ®óng th× c©u lÖnh ngay sau lÖnh if ®−îc thùc hiÖn nÕu sai c©u lÖnh ®ã sÏ ®−îc bá qua ®Õn lÖnh elseif Mét biÓu thøc sã s¸nh lμ ®óng nÕu tÊt c¶ c¸c phÇn tö so s¸nh cña hai m¶ng (hoÆc hai ma trËn) tr¶ vÒ gÝa trÞ 1 VÝ dô: A=[ 1 0; 2 3]; B=[1 1; 3 4]; Th× : + A<B lμ sai v× A(1,1) kh«ng nhá h¬n B(1,1); + A<(B+1) lμ ®óng bëi v× kh«ng phÇn tö nμo trong A lín h¬n phÇn tö trong B t−¬ng øng % CÊu tróc khi sö dông lÖnh else if if expression1 statements1; else if expression2 statements2; end end Ta thÊy trong cÊu tróc trªn th× cã hai lÖnh if riªng biÖt cho nªn ph¶i cã hai tõ kÕt thóc lμ end. Bμi tËp vÝ dô: NhËp vμo bμn phÝm ®iÓm cña mét häc sinh råi in ra ®¸nh gi¸ : Trang 19 Diem= input(‘nhap diem vao=’); if ( Diem< 5) fprintf(‘Hoc luc yeu’); elseif( Diem>=5)&(Diem<7) fprintf(‘Hoc luc trung binh’);
- 20. 1.10.2 Vßng lÆp for CÊu tróc: for i= imin :Δi: imax statements; end Δi : Lμ b−íc nh¶y cña vßng lÆp for, gi¸ trÞ mÆc ®Þnh lμ =1; VÝ dô: TÝnh tæng s= 1+2^p +3^p+ ... n^p ; ( p lμ sè mò ) function s= Sump(n , p) s=0; for i=1:n ; s=s+i^p ;end; Hai ch−¬ng tr×nh sau ®©y lμ gièng nhau for i=1:100; y(i)=sin(i); end; x=1:100; y=sin(x); ⇔ 1.10.3 Vßng lÆp while CÊu tróc: while( bieu_thuc_logic) statements; end; Tr−íc hÕt vßng lÆp kiÓm tra xem nÕu biÓu thøc logic ®óng th× thùc hiÖn c¸c c©u lÖnh statements. n=input(‘Nhap n=’); s=0; i=0; while( i<n) s=s+i; end; VÝ dô: 1.10.4 LÖnh ng¾t break , error, return Trang 20
- 21. • LÖnh break :T¸c dông ®iÒu khiÓn ch−¬ng tr×nh nh¶y ra khái vßng lÆp for hay while gÇn nã nhÊt. VÝ dô:NhËp mét sè d−¬ng nÕu ©m th× nhËp l¹i 1.10.5 LÖnh error vμ lÖnh return - LÖnh error: Dïng ®Ó th«ng b¸o lçi , hiÓn thÞ cho ng−êi lËp tr×nh biÕt ®ã lμ lçi g× ? VÝ dô: error(‘error message’); hiÓn thÞ th«ng ®iÖp lçi khi thùc hiÖn c©u lÖnh nμy. while 1 n= input(‘nhap n=’); while(n<0) %Vong lap while2 break; %Thoat khoi vong lap while2 end if n>0 break; %Thoat khoi vongwhile chinh end end a=input(‘Nhap a=’); b=input(‘Nhap b=’); % Thuc hien a: b if b==0 error(‘divide by zeros’); end; Khi thùc thi ch−¬ng tr×nh trªn ( nhËp b=0) th× xuÊt hiÖn dßng ch÷ ®á Nh− sau: ??? Error using ==> soan1 divide by zeros Chó ý r»ng soan1 lμ tªn file l−u ch−¬ng tr×nh trªn - LÖnh return: Th−êng ®−îc sö dông trong c¸c hμm cña MATLAB. LÖnh return sÏ cho phÐp quay trë vÒ thùc thi nh÷ng lÖnh n»m trong t¸c dông cña lÖnh return. 1.10.6 BiÕn toμn côc BiÕn toμn côc ®−îc dïng trong ph¹m vi toμn bé c¸c ch−¬ng tr×nh, nÕu c¸c ch−¬ng tr×nh ®ã khai b¸o biÕn toμn côc ®ã. CÊu tróc: global x y z % khai b¸o ba biÕn toμn côc x y z Trang 21
- 22. VÝ dô ®¬n gi¶n sau: %Ch−¬ng tr×nh con tÝnh hμm function[ u,v]=Main(x,y) global a b; Tinhham(x,y,z); u=a;v=b; function Tinhham(x,y,z) global a b; a=x^2 +y^2+ z^2; b=x^3 +y^3+ z^3; Thùc thi ch−¬ng tr×nh: >> x=2,y=3,z=4; >> [u,v]=Main(x,y,z); 1.10.6 §Þnh d¹ng d÷ liÖu ra C¸c phÐp tÝnh trong MATLAB ®−îc thùc hiÖn víi ®é chÝnh x¸c cao, ta cã thÓ ®Þnh d¹ng cho c¸c sè xuÊt ra mμn h×nh tuú tõng yªu cÇu cô thÓ: VÝ dô sè a= 4/3 víi • format short (®©y lμ chÕ ®é mÆc ®Þnh gåm 4 sè sau dÊu phÈy) a=1.3333 • format short e a= 1.3333e+00 • format long a=1.3333333333333 • format lang e a=1.3333333333333e+000 Ngoμi c¸ch nμy ra ta ®Þnh d¹ng d÷ liÖu b»ng thanh tool c«ng cô trªn mμn h×nh VÝ dô: Gâ c¸c lÖnh sau trong cöa sæ CommandWindow >>format long >>a=4/3 a= 1.3333333333333 1.10.7 Mét sè hμm to¸n häc th«ng th−êng hay sö dông Trang 22
- 23. Tªn hμm ý nghÜa Sin Hμm sin Cos Hμm cos Tan Hμm tan Asin Hμm acsin Acos Hμm accos Atan Hμm tÝnh arctg Angle LÊy gãc pha Fix Lμm trßn h−íng 0 Floor Lμm trßn h−êng -∞ Exp Hμm e mò Ceil Lμm trßn h−íng -∞ Log Logarit c¬ sè e log10 Logarit c¬ sè 10 sqrt(x) C¨n bËc hai 1.11 C¸c h»ng sè ®−îc sö dông trong Matlab • Ký tù inf thay thÕ cho ∞ trong to¸n häc Inf : lμ sè v« cïng lín mμ Matlab kh«ng thÓ hiÖn ®−îc vÝ dô: >> 5/0 ans = inf • Ký tù NaN thay thÕ cho mét sè kh«ng x¸c ®Þnh vÝ dô: >> 0/0 ans= NaN • Ký tù pi thÓ hiÖn lμ sè π =3.14159.. • Ký tù eps 1.12 Sè phøc trong Matlab Sö dông i vμ j ®Ó thÓ hiÖn phÇn ¶o víi i= j= sqrt(-1) VÝ dô: >> 5+6i ans = Trang 23
- 24. 5.0000 + 6.0000i >> 5+6j ans = 5.0000 + 6.0000i Chó ý khi lμm víi sè phøc cÇn ph©n biÖt : y= 7/2*i vμ x= 7/2i cho hai kÕt qu¶ kh¸c nhau >> y= 7/2*i y = 3.5*i >> x=7/2i x= -3.5i VÝ dô c¸c phÐp tÝnh vÒ sè phøc: >> s=3+7i >>w=5-9i >>w+s >>w-s >>w*s >>w/s 1.13 C¸c lÖnh tho¸t khái ch−¬ng tr×nh,liÖt kª c¸c biÕn, xo¸ biÕn . • LÖnh exit : T¸c dông tho¸t khái ch−¬ng tr×nh . • LÖnh clc (clear command) xo¸ tÊt c¶ c¸c lÖnh trong cöa sæ CommandWindow • LÖnh clear xo¸ toμn bé c¸c biÕn trong bé nhí hiÖn thêi . • LÖnh clear <danh s¸ch biÕn> Xo¸ danh s¸ch biÕn ®−îc liÖt kª ra. • LÖnh whos cho biÕt tÊt c¶ c¸c biÕn hiÖn thêi, kÝch th−íc « nhí biÕn ®ã. • LÖnh quit còng gièng nh− lÖnh exit • C¸c phÝm mòi tªn lªn xuèng (trªn bμn phÝm) ®−îc dïng ®Ó gäi l¹i c¸c lÖnh ®· thùc hiÖn tr−íc ®ã. C©u hái& Bμi tËp cuèi ch−¬ng Nªu ®Æc ®iÓm cña c¸c cöa sæ ( CommandWindow, history .) 1. Sö dông LÖnh trùc tiÕp tõ cöa sæ command window vμ gi¸n tiÕp tõ c¸c file 2. C¸c c©u lÖnh ®iÒu kiÖn , vßng lÆp 3. L−u vμ lÊy d÷ liÖu cho mét hoÆc nhiÒu biÕn. Bμi tËp1 : Gi¶i hÖ ph−¬ng tr×nh bËc nhÊt dïng dßng nh¾c g¸n gi¸ trÞ biªn nhËp c¸c hÖ sè a,b,c,d,m,n hÖ cho nh− sau: ax +by=m Trang 24
- 25. cx+dy=n Bμi tËp 2: Sinh viªn vÏ c¸c hμm sau a. VÏ ®Æc tÝnh ®iode víi quan hÖ dßng ®iÖn vμ ®iÖn ¸p trªn ®iode nh− sau i=I0*(exp(40*v)-1)(A); I0=1.E-6; vector v=[-10:0.005:0.8] . Sinh viªn thùc hiÖn theo hai c¸ch viÕt trùc tiÕp trong CommadWindow vμ viÕt hμm trong M-file. b. VÏ c¸c hμm c¬ b¶n sin(x) ,cos(x) ,tan(x)... dïng lÖnh fplot . c. VÏ hμm y= sin(x)/x , y=x, y=sin(x) trªn cïng mét ®å thÞ . Bμi tËp3 : L−u tÊt c¶ c¸c biÕn b¹n ®· dïng trong qu¸ tr×nh thùc hμnh vμo file riªng cña m×nh, ®Ó lÇn sau lÊy ra dïng l¹i. Bμi 4:LËp ch−¬ng tr×nh d¹ng hμm function ®Ó gi¶i ph−¬ng tr×nh bËc hai Bμi 5:LËp hμm tÝnh hμm truyÒn kÝn c¸c s¬ ®å hÖ thèng ®iÒu khiÓn trong s¸ch lý thuyÕt ®iÒu khiÓn tù ®éng Bμi 5:LËp hμm function [Q, R]=divide (a,b) t×m th−¬ng vμ sè chia hai sè a vμ b Trang 25
- 26. Ch−¬ng 2 Th− viÖn to¸n häc kiÓu ký tù (symbolic matlab) 2.1 Giíi thiÖu vÒ th− viÖn to¸n häc kiÓu ký tù Symbolic matlab lμ th− viÖn c¸c phÐp to¸n kiÓu ký tù ®−îc ®−a vμo m«i tr−êng tÝnh sè häc cña matlab , th− viÖn nμy lμm phong phó vμ tiÖn Ých thªm víi nhiÒu kiÓu tÝnh to¸n vÒ to¸n häc kh¸c cho phÇn tÝnh sè häc vμ ®å ho¹ ®· cã tr−íc ®©y trong th− viÖn Matlab. 2.2 C¸c lÖnh c¬ b¶n khai b¸o biÕn symbolic 2.2.1 LÖnh syms vμ lÖnh sym + NhiÖm vô t¹o ®èi t−îng (bao gåm c¶ biÕn) symbolic CÊu tróc: syms arg1 arg2 ... syms arg1 arg2 ... real syms arg1 arg2 ... unreal M« t¶ Khai b¸o c¸c biÕn arg1 , arg2 lμ c¸c biÕn symbolic cã hai c¸ch khai b¸o dïng lÖnh syms hoÆc lÖnh sym nh− sau: syms arg1 arg2 ... Khai b¸o c¸c th«ng sè arg1, arg2 lμ c¸c biÕn symbolic , ta cã thÓ khai b¸o nh− sau arg1 = sym('arg1'); arg2 = sym('arg2'); ... T−¬ng tù : syms arg1 arg2 ... real lμ ký hiÖu ng¾n gän cho arg1 = sym('arg1','real'); arg2 = sym('arg2','real'); ... C¸c biÕn khai b¸o nh− trªn lμ c¸c biÕn thùc kiÓu symbolic .VËy th× c¸c biÕn nμy kh¸c g× c¸c biÕn khai b¸o kh«ng cã ®Æc tÝnh real? Ta ph©n biÖt nh− sau: §èi víi mét biÕn thùc symbolic th× nã cã c¸c tÝnh chÊt cña sè thùc vÝ dô nh− (arg)2 >0 (khi khai b¸o lμ syms arg real) cßn khi b¹n khai b¸o lμ syms arg th× c¸c biÕn nμy chØ ®¬n thuÇn lμ biÕn symbolic kh«ng cã c¸c tÝnh chÊt cña sè thùc tøc lμ (arg)2 sÏ kh«ng cã dÊu ,mμ chØ coi lμ c¸c ký tù symbolic mμ th«i TiÕp tôc Trang 1
- 27. syms arg1 arg2 ... unreal lμ ký hiÖu ng¾n gän cho arg1 = sym('arg1','unreal'); arg2 = sym('arg2','unreal'); ... VÝ dô: syms x beta real gièng nh− viÖc khai b¸o x = sym('x','real'); beta = sym('beta','real'); §Ó xo¸ ®èi t−îng symbolic x vμ beta khái (tr¹ng th¸i) 'real' ta lμm nh− sau syms x beta unreal Chó ý : clear x sÏ kh«ng xo¸ ®èi t−îng symbolic x khái tr¹ng th¸i 'real'. B¹n cã thÓ thùc hiÖn ®−îc ®iÒu trªn(tøc lμ xo¸ x khái tr¹ng th¸i sè thùc) b»ng c¸ch sö dông c¸c lÖnh syms x unreal or clear mex or clear all. 2.2.2.LÖnh sym T¹o mét sè, mét biÕn vμ mét ®èi t−îng symbolic CÊu tróc nh− sau S = sym(A) x = sym('x') x = sym('x','real') x = sym('x','unreal') S = sym(A,flag) where flag is one of 'r', 'd', 'e', or 'f'. M« t¶: S = sym(A) T¹o mét ®èi t−îng S cña líp 'sym' tõ A.NÕu th«ng sè ®Çu vμo lμ mét chuçi , kÕt qu¶ lμ mét sè ,mét biÕn symbolic.NÕu th«ng sè ®Çu vμo lμ mét sè v« h−íng hay mét matrËn, kÕt qu¶ lμ mét thÓ hiÖn cña c¸c sè ®· cho d−íi d¹ng symbolic x = sym('x') T¹o biÕn symbolic víi tªn lμ x chøa kÕt qu¶ trong x x = sym('x','real') cho r»ng x lμ thùc cho nªn conj(x) b»ng víi x(cã thÓ coi ®©y lμ ph−¬ng ph¸p kiÓm tra sè thùc ) VÝ dô: x = sym('x','unreal') lμm cho biÕn x(trong s¹ch) vμ kh«ng cã ®Æc tÝnh nμo thªm(®¶m b¶o r»ng x kh«ng ph¶i lμ biÕn thùc) VÝ dô + pi= sym('pi') kÕt qu¶ cho l¹i gi¸ trÞ sè pi (®Çu vμo lμ mét chuçi) + LÖnh pi = sym('pi') vμ delta = sym('1/10') KÕt qu¶ delta= 1/10 ; CÊu tróc sau cho phÐp chuyÓn ®æi sè symbolic sang c¸c d¹ng sè thùc vμ c¸c d¹ng sè kh¸c tuú thuéc vμo flag lμ ' r ' , ' d ' ,' e ' hoÆc ' f ' Trang 2
- 28. S = sym(A,flag) ë ®ã flag lμ mét trong 'r', 'd', 'e', or 'f'. VÝ dô : T¹o ma trËn symbolic A A=[ 1 2 3 ; 4 5 6]; >>A=[ 1 2 3; 4 5 6]; >>A=sym(A) KÕt qu¶ tr¶ vÒ ma trËn A= [ 1 2 3] [ 4 4 6] VÝ dô: T¹o biÕn symbolic x ,y, z >> syms x y z ;% hoÆc sym('x' ) hoÆc sym('y') . . . >> f= x^2 + y^2 +z^2; VÝ dô T¹o sè symbolic a= 5 >> a= sym('5') a = 5 Th«ng th−êng hiÖu qu¶ cña viÖc sö dông lÖnh sym lμ ®Ó chuyÓn ®æi mét ma trËn tõ sè sang d¹ng phom symbolic .LÖnh A = hilb(3) T¹o ma trËn Hilbert A = 1.0000 0.5000 0.3333 0.5000 0.3333 0.2500 0.3333 0.2500 0.2000 ¸p dông sym cho A A = sym(A) B¹n cã thÓ ®¹t ®−îc matrËn symbolic Hilbert cã kÝch th−íc 3-by-3 A = [ 1, 1/2, 1/3] [ 1/2, 1/3, 1/4] [ 1/3, 1/4, 1/5] Ta thÊy r»ng khi ¸p dông lÖnh symbolic cho sè hoÆc ma trËn th× kÕt qu¶ thu l¹i sÏ chÝnh x¸c h¬n 2.2.3 PhÐp TÝnh víi c¸c biÕn vμ sè symbolic C¸c phÐp tÝnh c¬ b¶n vÒ ma trËn ®Òu ®−îc dïng ®èi víi c¸c sè vμ biÕn symbolic. VÝ dô vÒ phÐp céng hai Ma trËn symbolic(hoÆc víi mét ma trËn kh«ng ph¶i lμ symbolic) >> syms a b c; >> a=[a b c ; b c a]; >> d=[1 2 3 ;4 5 6]; Trang 3
- 29. >> a+d ans = [ a+1, b+2, c+3] [ b+4, c+5, a+6] >> A=sym([1 2 3 ; 4 5 6]); >> B=sym([2 3 4 ;5 6 7]); >> A+B ans = [ 3, 5, 7] [ 9, 11, 13] T−¬ng tù cho phÐp nh©n vμ phÐp chia ( * / ./ .) 2.3 T¹o hμm symbolic Th«ng th−êng cã hai c¸ch t¹o hμm Symbolic • T¹o hμm b»ng biÓu thøc symbolic f= f(x,y,z...) trong ®ã x, y z ®−îc khai b¸o lμ c¸c biÕn symbolic • T¹o trong M-file • T¹o trùc tiÕp c¸c hμm . 2.3.1 T¹o hμm tõ c¸c biÓu thøc symbolic Hμm t¹o ra chøa c¸c biÕn ph¶i lμ biÕn symbolic VÝ dô t¹o hμm f= 3*x^2 + 2*x + 1 ta lμm nh− sau >> syms x % khai b¸o x lμ biÕn symbolic >> f= 3* x^2 + 2*x +1 % f lμ hμm symbolic vÝ dô: syms x y z r = sqrt(x^2 + y^2 + z^2) t = atan(y/x) f = sin(x*y)/(x*y) T¹o biÓu thøc symbolic r vμ t vμ f . Chó ý ChØ khi t¹o mét hμm symbolic th× B¹n míi ®−îc phÐp sö dông lÖnh limit ,diff, int, subs, vμ c¸c hμm to¸n häc symbolic kh¸c 2.3.2 T¹o Hμm Symbolic tõ M-file T¹o mét hμm b»ng cÊu tróc function , trong ®ã ®Çu vμo lμ c¸c biÕn cÇn ®Ó thiÕt lËp hμm , ®Çu ra lμ biÕn chøa hμm nh− vËy c¸ch t¹o hμm gièng víi t¹o hμm th«ng th−êng ,V× thÕ ®Ó Trang 4
- 30. Matlab hiÓu r»ng ®©y lμ hμm symbolic th× ta pahØ l−u vμo file cã ®−êng dÉn nh− sau C:matlabR12toolboxsymbolic@symten_ham VÝ dô t¹o hμm symbolic z= sin(x)/x function z = sinc(x) %SINC The symbolic sinc function % sin(x)/x. This function % accepts a sym as the input argument. if isequal(x,sym(0)) z = 1; else z = sin(x)/x; end VÝ dô : Muèn t¹o hμm symbolic f= 3*x^2 + 2*x + 1 function f= tao_ham( x) f= 3*x^2 + 2*x + 1 %L−u vμo ®−êng dÉn C:matlabR12toolboxsymbolic@symtao_ham %------------gäi hμm trong command window--------- >> syms x >>f= tao_ham(x) f= 3*x^2 + 2*x + 1 2.3.3 T¹o hμm trùc tiÕp Ta cã thÓ t¹o hμm trùc tiÕp nh− sau f= 3*x^2+ 2*x+1 >> f=sym('3*x^2 + 2*x +1') Tuy nhiªn t¹o hμm nh− trªn th× f lμ hμm symbolic, nh−ng b¶n th©n biÕn x l¹i kh«ng ph¶i lμ biÕn symbolic Khi khai b¸o hμm kiÓu nμy ,muèn sö dông biÕn x ta thªm hai dÊu ' x ' >> f= sym('3*x^2+ 2*x +1'); >> g=subs(f,'x','x+h') g = 3*(x+h)^2+ 2*(x+h) +1 >> df=(subs(f,'x','x+h')-f)/'h' df = (3*(x+h)^2+2*h-3*x^2)/h >> diff(f,'x') ans = 6*x+2 VÝ dô : TÝnh 6! Ta t¹o hμm tÝnh trùc tiÕp nh− sau >> f=sym('x!'); Trang 5
- 31. >> subs(f,'x',6) ans = 720 VÝ dô t¹o hμm 1/ x! >> f=1/sym('x!'); >> subs(f,'x',n) >> subs(f,'x','n') ans = 1/(n)! 2.4 T¹o biÕn thùc vμ biÕn phøc T¹o biÕn phøc vÝ dô z= x+ i* y th× ta ph¶i khai b¸o x vμ y lμ c¸c biÕn symbolic thùc tøc lμ: syms x y real z = x + i*y I. Gi¶i thÝch T¹o biÕn symbolic x vμ y ,c¸c biÕn nμy cã ®−îc sù c«ng thªm c¸c tÝnh chÊt to¸n häc cña mét biÕn thùc .Cô thÓ nã cã ý nghÜa r»ng biÓu thøc f = x^2 + y^2 f >=0. Cho nªn, z lμ mét biÕn phøc conj(x)= x;conj(z)=x-i*y;expand(z*conj(z))=x^2+y^2 §Ó xo¸ x khái lμ mét biÕn thùc ,b¹n ph¶i dïng lÖnh nh− sau syms x unreal hoÆc x = sym('x','unreal') LÖnh sau clear x kh«ng lμm cho x khái lμ mét sè thùc 2.5 LÖnh findsym T×m c¸c biÕn trong biÓu thøc symbolic hoÆc matrËn Syntax r = findsym(S) r = findsym(S,n) M« t¶ findsym(S) Tr¶ vÒ tÊt c¶ c¸c biÕn symbolic trong S ®−îc c¸ch nhau bëi dÊu phÈy(trong in alphabetical order).NÕu S kh«ng chøa bÊt kú mét biÕn nμo findsym tr¶ vÒ mét chuçi rçng findsym(S,n) tr¶ vÒ n biÕn alphabetically gÇn x nhÊt VÝ dô syms a x y z t findsym(sin(pi*t)) returns pi, t. Trang 6
- 32. findsym(x+i*y-j*z) returns x, y, z. findsym(a+y,1) returns y. 2.6 TÝnh to¸n C«ng cô to¸n däc symbolic cung cÊp c¸c hμm ®Ó thùc hiÖn c¸c to¸n tö c¬ b¶n cña phÐp to¸n §¹o hμm , giíi h¹n , tÝch ph©n, tæng vμ më r«ng chuçi Taylor. 2.5.1 LÖnh symsum Symbolic summation. Syntax r = symsum(s) r = symsum(s,v) r = symsum(s,a,b) r = symsum(s,v,a,b) M« t¶ *symsum(s) lμ tæng cña biÓu thøc symbolic s theo biÕn symbolic cña nã lμ k ®−îc x¸c ®Þnh bëi lÖnh findsym tõ 0 ®Õn k-1 *symsum(s,v) lμ tæng cña biÓu thøc symbolic theo biÕn symbolic v ®−îc x¸c ®Þnh tõ 0 ®Õn v-1 *symsum(s,a,b) and symsum(s,v,a,b) §Þnh nghÜa tæng cña biÓu thøc symbolic theo biÕn v tõ v=a ®Õn v=b VÝ dô C¸c lÖnh sau: syms k n x symsum(k^2) tr¶ vÒ kÕt qu¶ 1/3*k^3-1/2*k^2+1/6*k symsum(k) tr¶ vÒ 1/2*k^2-1/2*k symsum(sin(k*pi)/k,0,n) tr¶ vÒ -1/2*sin(k*(n+1))/k+1/2*sin(k)/k/(cos(k)-1)*cos(k*(n+1))- 1/2*sin(k)/k/(cos(k)-1) symsum(k^2,0,10) tr¶ vÒ kÕt qu¶ sau 385 VÝ dô: >> syms x k; >> symsum(x^k/sym('k!'), k, 0,inf)%inf la +vo cung ans = Trang 7
- 33. exp(x) >> symsum(x^k/sym('k!'), k, 0,5) ans = 1+x+1/2*x^2+1/6*x^3+1/24*x^4+1/120*x^5 Chó ý : C¸c vÝ dô tr−íc sö dông sym ®Ó t¹o biÓu thøc symbolic .k! 2.5.2 TÝnh ®¹o hμm B©y giê chóng ta t¹o c¸c biÕn vμ hμm syms a x f = sin(a*x) sau ®ã diff(f) LÖnh nμy sÏ tÝnh ®¹o hμm cña f víi biÕn symbolic cña nã (trong tr−êng hîp nμy lμ x), nh− ®−îc ®Þnh nghÜa bëi lÖnh findsym ans = cos(a*x)*a §Ó tÝnh ®¹o hμm víi biÕn a ta lμm nh− sau diff(f,a) Nã tr¶ vÒ df/da. ans = cos(a*x)*x §Ó tÝnh ®¹o hμm bËc hao víi biÕn x vμ a ta lμm nh− sau diff(f,2) hoÆc diff(f,x,2) Tr¶ vÒ ans = -sin(a*x)*a^2 vμ diff(f,a,2) Nã tr¶ vÒ ans = -sin(a*x)*x^2 §Þnh nghÜa a,b,x,n,t vμ theta trong Matlab workspace, sö dông lÖnh sym. B¶ng sau cho thÊy t¸c dông cña lÖnh diff f diff(f) Trang 8
- 34. X^n x^n*n/x Sin(a*t+b) cos(a*t+b)*a Exp(i*theta) i*exp(i*theta) Example: syms a x A = [cos(a*x),sin(a*x);-sin(a*x),cos(a*x)] Nã tr¶ l¹i A = [ cos(a*x), sin(a*x)] [ -sin(a*x), cos(a*x)] LÖnh diff(A) Tr¶ vÒ ans = [ -sin(a*x)*a, cos(a*x)*a] [ -cos(a*x)*a, -sin(a*x)*a] 2.5.3 sym2poly BiÕn ®æi ®a thøc symbolic sang vec t¬ hÖ sè ®a thøc cña ®ã CÊu tróc c = sym2poly(s) M« t¶ sym2poly tr¶ vÒ mét vector hμng, vÐc t¬ nμy chøa hÖ sè cña ®a thøc symbolic. C¸c hÖ sè nμy ®−îc xÕp theo thø tù t−¬ng øng víi sè mò cña biÕn ®éc lËp cña ®a thøc VÝ Dô C¸c lÖnh sau ®©y: syms x u v; sym2poly(x^3 - 2*x - 5) Tr¶ vÒ 1 0 -2 -5 trong khi sym2poly(u^4 - 3 + 5*u^2) Tr¶ vÒ 1 0 5 0 -3 vμ sym2poly(sin(pi/6)*v + exp(1)*v^2) tr¶ vÒ Trang 9
- 35. 2.7183 0.5000 0 2.5.4 TÝnh giíi h¹n Limit C«ng cô to¸n häc symbolic cho phÐp b¹n tÝnh giíi h¹n cña hμm theo c¸ch th«ng th−êng .C¸c lÖnh sau syms h n x limit( (cos(x+h) - cos(x))/h,h,0 ) Tr¶ vÒ kÕt qu¶ ans = -sin(x) vμ limit( (1 + x/n)^n,n,inf ) % n tiÕn tíi v« cïng Nã tr¶ vÒ kÕt qu¶ ans = exp(x) ThÓ hiÖn hai trong tÊt c¶ giíi h¹n quan trong nhÊt trong to¸n häc,®¹o hμm (trong tr−êng hîp nμy lμ cos(x)) vμ hμm e mò x giíi h¹ntån t¹i khi cho biÕn tiÕn tíi hai phÝa (®ã lμ, kÕt qu¶ lμ gièng nhau bÊt kÓ tiÕn bªn ph¶i hay bªn tr¸i ).NÕu kÕt qu¶ kh¸c nhau hai phÝa th× ®¹o hμm ®ã kh«ng tån t¹i Cho nªn ®¹o hμm sau kÕt qu¶lμ kh«ng x¸c ®Þnh vμ C«ng cô to¸n häc symbolic tr¶ vÒ gi¸ trÞ lμ NaN LÖnh limit(1/x,x,0) hoÆc limit(1/x) returns ans =NaN LÖnh limit(1/x,x,0,'left') Tr¶ vÒ ans = -inf Trong khi lÖnh. limit(1/x,x,0,'right') Tr¶ vÒ: ans = inf Quan s¸t thÊy r»ng tr−êng hîp mÆc ®Þnh, limit(f) gièng víi limit(f,x,0). Trang 10
- 36. Lùa chän cho lÖnh limit trong b¶ng trªn, chóng ta gi¶ sö r»ng f lμ mét hμm symbolic víi ®èi t−îng x II. 2.5.5 TÝnh TÝch ph©n NÕu f lμ mét biÓu thøc symbolic th× tÝch ph©n cña hμm f lμ int(f) T×m mét biÓu thøc symbolic F tho¶ m·n diff(F)=f, th× F lμ gi¸ trÞ tr¶ vÒ cña int(f) T−¬ng tù hμm int(f,v) int(f,v) Sö dông ®èi t−îng symbolic v nh− lμ biÕn cña tÝch ph©n, VÝ dô T¹o c¸c biÕn symbolic sau syms a b theta x y n x1 u F Int(f) x^n x^(n+1)/(n+1) y^(-1) Log(y) n^x 1/log(n)*n^x Sin(a*theta+b) -cos(a*theta+b)/a Exp(-x1^2) 1/2*pi^(1/2)*erf(x1) 1/(1+u^2) Atan(u) B¶ng thÓ hiÖn kÕt qu¶ tÝch ph©n cña mét sè hμm §Þnh nghÜa tÝch ph©n cßn ®−îc thÓ hiÖn nh− sau int(f,a,b) hoÆc int(f,v,a,b) % TÝnh tÝch ph©n f theo biÕn v tõ a ®Õn b 2.6 Gi¶i ph−¬ng tr×nh - HÖ ph−¬ng tr×nh ®¹i sè Gi¶i ph−¬ng tr×nh-hÖ ph−¬ng tr×nh dïng lÖnh solve Môc ®Ých: Gi¶i mét hoÆc nhiÒu ph−¬ng tr×nh ®¹i sè tuyÕn tÝnh symbolic CÊu tróc g = solve(eq) g = solve(eq,var) g = solve(eq1,eq2,...,eqn) g = solve(eq1,eq2,...,eqn,var1,var2,...,varn) Trang 11
- 37. M« t¶ Eq lμ biÓu thøc ®¬n hoÆc mét ph−¬ng tr×nh.§Çu vμo ®Ó gi¶i(t×m nghiÖm) cã thÓ lμ biÓu thøc hoÆc chuçi symbolic.NÕu eq lμmét biÓu thøc symbolic (x^2-2*x+1) hoÆc mét chuçi, chuçi nμy kh«ng chøa mét ph−¬ng tr×nh, nh− ('x^2-2*x+1'), th× solve(eq) lμ gi¶i ph−¬ng tr×nh eq=0 Víi biÕn mÆc ®Þnh cña nã ®−îc x¸c ®Þnh bëi hμm findsym.solve(eq,var) t−¬ng ®−¬ng víi viÖc gi¶i ph−¬ng tr×nh eq (hoÆc eq=0 trong hai tr−êng hîp ë trªn) ®èi víi biÕn var(gi¶i phu¬ng tr×nh víi biÕn lμ var) VÝ dô : >> solve(' x^2 + 2*x +1 ' , 'x' ) tøc lμ gi¶i ph−¬ng tr×nh x^2+2*x+1=0 víi biÕn lμ x >> solve(' y*x^2 + x *y+1 ' ,'y') HÖ ph−¬ng tr×nh. §Çu vμo lμ c¸c biÓu thøc symbolic hoÆc c¸c chuçi x¸c ®Þnh ph−¬ng tr×nh. solve(eq1,eq2,...,eqn) gi¶i hÖ c¸c ph−¬ng tr×nh t¹o bëi eq1,eq2,...,eqn trong n biÕn ®−îc x¸c ®Þnh b»ng c¸ch ¸p dông lÖnh findsym cho toμn hÖ (in the n variables determined by applying findsym to the system) Ba lo¹i kh¸c nhau cña ®Çu ra cã thÓ. + §èi víi mét ph−¬ng tr×nh vμ mét ®Çu ra, kÕt qu¶ (sau khi gi¶i ) ®−îc tr¶ vÒ víi nhiÒu kÕt qu¶ cho ph−¬ng tr×nh tuyÕn tÝnh (with multiple solutions for a nonlinear equation) + §èi víi hÖ thèng ph−¬ng tr×nh cã sè ®Çu ra c©n b»ng, kÕt qu¶ ®−îc chøa trong alphabetically vμ ®−îc ký hiÖu nh− lμ ®Çu ra.(chøa trong alphabetically tøc lμ chøa theo thø tù ch÷ c¸i) + §èi víi hÖ thèng ph−ong tr×nh cã sè ®Çu ra lμ ®¬n,kÕt qu¶ tr¶ vÒ lμ mét cÊu tróc VÝ dô solve('a*x^2 + b*x + c') tr¶ vÒ [ 1/2/a*(-b+(b^2-4*a*c)^(1/2)), 1/2/a*(-b-(b^2-4*a*c)^(1/2))] solve('a*x^2 + b*x + c','b') tr¶ vÒ -(a*x^2+c)/x >> n=solve('x + y = 1','x - 11*y = 5') n = x: [1x1 sym] y: [1x1 sym] >> n.y ans =. -1/3 >> n.x ans = Trang 12
- 38. 4/3 >> [x, y]=solve('x + y = 1','x - 11*y = 5') kÕt qu¶: x= 4/3 y=-1/3 >>A = solve('a*u^2 + v^2', 'u - v = 1', 'a^2 - 5*a + 6') Tr¶ vÒ d¹ng cÊu tróc A = a: [1x4 sym] u: [1x4 sym] v: [1x4 sym] ë ®ã A.a = [ 2, 2, 3, 3] A.u = [ 1/3+1/3*i*2^(1/2), 1/3-1/3*i*2^(1/2), 1/4+1/4*i*3^(1/2), 1/4-1/4*i*3^(1/2)] A.v = [ -2/3+1/3*i*2^(1/2), -2/3-1/3*i*2^(1/2), -3/4+1/4*i*3^(1/2), -3/4-1/4*i*3^(1/2)] 2.7 BiÕn ®æi laplace 2.7.1 BiÕn ®æi thuËn Laplace CÊu tróc laplace(F) laplace(F,t) M« t¶ L = laplace(F) lμ biÕn ®æi laplace cña F víi biÕn ®éc lËp mÆc ®Þnh lμ t. kÕt qu¶ mÆc ®Þnh tr¶ l¹i lμ hμm cña s. BiÕn ®æi laplace ®−îc ¸p dông cho mét hμm cña biÕn t vμ tr¶ l¹i mét hμm cña biÕn s NÕu F = F(s), laplace tr¶ l¹i mét hμm cña t B»ng c¸ch ®Þnh nghÜa t lμ biÕn kiÓu symbolic trong F ®−îc x¸c ®Þnh bëi hμm findsym. L = laplace(F,t) t¹o ra L,mét hμmcña t thay mÆc ®Þnh lμ hμm cña s. L = laplace(F,w,z) t¹o ra L,mét hμm cña z trong ®ã F,mét hμm cña w thay thÕ biÕn mÆc ®Þnh lμ s vμ t t−¬ng øng 2.7.2 BiÕn ®æi ng−îc laplace Môc ®Ých: BiÕn ®æi ng−îc laplace Trang 13
- 39. CÊu tróc F = ilaplace(L) F = ilaplace(L,y) F = ilaplace(L,y,x) M« t¶ F=ilaplace(L) lμ phÐp biÕn ®æi ng−îc Laplace cña ®èi t−îng v« h−íng symbolic Lvíi biÕn ®éc lËp lμ s. tr¶ l¹i mÆc ®Þnh lμ mét hμm cña t.BiÕn ®æi ng−îc laplace ®−îc ¸p dông cho mét hμm cña s vμ tr¶ vÒ mét hμm cña t .NÕu L = L(t), ilaplace tr¶ vÒ mét hμm cña x. B»ng c¸ch ®Þnh nghÜa ë ®ã c lμ mét sè thùc ®−îc chän cho nªn tÊt c¶ all singularities of L(s) are to the left of the line s = c, i. F = ilaplace(L,y) t¹o ra F lμ mét hμm cña y thay v× mÆc ®Þnh t. y lμ mét ®èi t−îng symbolic v« h−íng. F = ilaplace(L,y,x) F lμ mét hμm cña x vμ L lμ mét hμm of y thay v× mÆc ®Þnh lμ s vμ t. 2.8 VÊn ®Ò tÝch ph©n víi h»ng sè thùc Mét trong nh÷ng tinh tÕ liªn quan tíi ®¹o hμm c¸c hμm symbolic lμ dÊu cña c¸c biÕn(coi lμ h»ng sè) khi b¹n b×nh ph−¬ng biÕn ®ã .ë ®©y ta hiÓu r»ng khi b¹n coi mét biÕn nμo ®ã trong biÓu thøc lμ biÕn(vÝ dô biÕn lÊy tÝch ph©n) th× c¸c biÕn cßn l¹i ®−îc coi lμ h»ng sè vμ Matlab sÏ kh«ng hiÓu ®−îc lμ nã d−¬ng hay ©m(coi chØ lμ ký tù ). VÝ dô, biÓu thøc ã h×nh chu«ng cong tiÕn tíi 0 khi x tiÕn tíi ± inf víi mäi sè thùc k. ®−îc t¹o ra, sö dông nh÷ng lÖnh sau syms x (1/sqrt(2)); The rnel, kh«ng coi k2 hoÆc x2 lμ c¸c sè d−¬ng.Maple cho r»ng biÕn symbolic x g th−êng tÝnh tÝch ph©n hμm trªn ta lμm nh− sau Lμ d−¬ng,®å thÞ c Mét vÝ dô vÒ ®−êng cong ®−îc cho thÊy d−íi ®©y víi k = sym f = exp(-(k*x)^2); ezplot(f) Maple ke vμ k lμ kh«ng x¸c ®Þnh. Cã nghÜa r»ng,chóng lμ biÕn vμ kh«ng cã thªm ®Æc tÝnh to¸n häc nμo. Th«n Trang 14
- 40. Trong c«ng cô to¸n häc symbolic , sö dông hμm syms x k; f = exp(-(k*x)^2); int(f,x,-inf,inf) vμ kÕt qu¶ lμ Definite integration: Can't determine if the integral is convergent. Need to know the sign of --> k^2 Will now try indefinite integration and then take limits. Warning: Explicit integral could not be found. ans = int(exp(-k^2*x^2),x= -inf..inf) Trong lêi c¶nh b¸o trªn b¹n chó ý thÊy dßng lÖnh “ Need to know the sign of----> k2 “ t¹m dÞch lμ kh«ng hiÓu dÊu cña k2 . Mμ hîp lý to¸n häc lμ k2 ph¶i d−¬ng do vËy b¹n ph¶i khai b¸o sao cho k2 >0 b»ng c¸ch ---> T¹o biÕn Real sö dông lÖnh sym Chó ý r»ng Maple kh«ng thÓ ®Þnh nghÜa dÊu cña biÓu thøc k^2. B»ng c¸ch nμo cã thÓ v−ît qua trë ng¹i nμy? C©u tr¶ lêi lμ t¹o biÕn k biÕn thùc. Sö dông lÖnh sym. syms k real int(f,x,-inf,inf) tr¶ vÒ ans = signum(k)/k*pi^(1/2) 2.9 VÏ §å thÞ Dïng hμm ezplot cho c¸c biÕn, sè symbolic Cêu tróc: ezplot( y ,[ xo xm]): VÏ y theo biÕn x thuéc kho¶ng [ xo xm] VÝ dô: >> syms x y; >> y= x.^2; Trang 15
- 41. >> ezplot(y,[1 10]), grid on C¸c b¹n chó ý r»ng lÖnh ezplot trªn dïng ®Ó vÏ trong kh«ng gian 2D ( kh«ng gian 2 chiÒu ) , cßn ®Ó vÏ trong kh«ng gian 3D kh«ng cã g× khã kh¨n ta dïng lÖnh ezplot3 ,c¸c b¹n tù tham kh¶o thªm s¸ch . C©u hái «n tËp 1. Nh÷ng tiÖn Ých khi sö dông th− viÖn to¸n häc symbolic lμ g× ?. 2. lÖnh findsym cã t¸c dông g× ?. 3. Thø tù −u tiªn c¸c biÕn khi sö dông biÕn mÆc ®Þnh ? . 4. Cã mÊy c¸ch t¹o hμm symbolic? Em h·y so s¸nh c¸c c¸ch . 5. DÊu cña c¸c biÕn symbolic nh− thÕ nμo ? 6. VÏ ®å thÞ hμm symbolic, b»ng hμm vÏ th«ng th−êng plot cã ®−îc kh«ng ? Bμi tËp 1. T¹o hμm symbolic sau Y= x2 + x + y+ z + 1; B¹n h·y nªu thø tù −u tiªn c¸c biÕn . 2. T¹o hμm symbolic sau dïng c¸c c¸ch t¹o hμm kh¸c nhau råi tÝch ®¹o hμm , tÝch ph©n cña nã Y= 1/( 5+ 4* cos(x) ) 3. VÏ ®å thÞ hμm trªn, theo hai c¸ch th«ng th−êng vμ sö dông symbolic Trang 16
- 42. Ch−¬ng 3 Ma trËn vμ m¶ng trong Matlab 3.1 NhËp ma trËn trong Matlab 3.1.1 C¸c C¸ch nhËp matrËn trong Matlab Matlab cung cÊp mét vμi ph−¬ng tiÖn cho ng−êi sö dông ®Ó t¹o ra mét matrËn, mçi ph−¬ng tiÖn cã nh÷ng −u ®iÓm cña nã vμ ®−îc sö dông tuú theo tõng yªu cÇu bμi to¸n.Nãi chung Matlab cung cÊp ba ph−¬ng tiÖn. • NhËp MatrËn trùc tiÕp tõ cöa sæ command Window. • NhËp MatrËn tõ mét file( sö dông M-file hoÆc load) • NhËp matrËn tõ nh÷ng hμm cã s½n trong Matlab. a. NhËp MatrËn trùc tiÕp tõ cöa sæ command Window Trong m«n häc to¸n cao cÊp chóng ta ®· biÕt nhËp mét matrËn nh− sau A= §©y lμ mét ma trËn cã sè hμng m = 3 vμ sè cét n= 3 1 2 3 4 5 6 7 8 9 §Ó nhËp matrËn trªn trong Matlab ta nhËp trùc tiÕp nh− sau Tõ dßng nh¾c lÖnh trong cöa sæ command Window >> ta nhËp >> A=[ 1,2,3 ; 4 5 ,6;7 8 9]; hoÆc >>A=[ 1 2 3 4 5 6 7 8 9]; C¸c hμng ®−îc c¸ch nhau b»ng mét dÊu chÊm phÈy (;) nh− trªn,c¸c phÇn tö trong mét hμng ®−îc c¸ch nhau b»ng dÊu c¸ch(thanh space) hoÆc dÊu phÈy(,) . KÕt thóc dßng lÖnh cã hoÆc kh«ng cã dÊu ; NÕu kh«ng cã dÊu chÊm phÈy ë cuèi dßng th× Matlab sÏ in ra kÕt qu¶ matrËn võa nhËp Nh− vÝ dô trªn: >> A=[ 1,2,3 ; 4 5 ,6;7 8 9] nhÊn Enter sÏ cho kÕt qu¶ lμ A= 1 2 3 4 5 6 Trong tr−êng hîp sè phÇn tö trªn mét hμng qu¸ dμi ta cã thÓ xuèng dßng b»ng dÊu ba chÊm ... VÝ dô >> b=[1,2,3,4,... 5 6 7 8 9] % ®©y matrËn 9 hμng vμ mét cét Trang 1
- 43. L−u ý r»ng trong mét sè tr−êng hîp matrËn hoÆc m¶ng d÷ liÖu dμi th× viÖc kh«ng thªm dÊu chÊm phÈy sau c©u lÖnh nhËp, Matlab sÏ in ra sè liÖu dμi trong cöa sæ command Window, g©y khã nh×n cho ng−êi dïng b. NhËp MatrËn tõ M-file Ta cã thÓ nhËp mét matrËn b»ng cöa sæ so¹n th¶o M-file, më cöa sæ nμy b»ng c¸ch vμo File- New- M-file. Mét cöa sæ so¹n th¶o sÏ ®−îc hiÖn ra cho phÐp b¹n so¹n th¶o d−íi d¹ng text, do lμ cöa sæ so¹n th¶o d¹ng text cho nªn b¹n cã thÓ so¹n th¶o tõ file word sau ®ã copy vμo cöa sæ M-file.§Ó nhËp matrËn ta so¹n th¶o t−¬ng tù nh− trong cöa sæ command window sau ®ã l−u vμo file nh− sau: VÝ dô: A=[1 2 3 ; 4 5 6 ; 7, 8,9];% kh«ng cã dÊu chÊm phÈy sÏ in ra kÕt qu¶ Còng t−¬ng tù nh− trªn nÕu sè phÇn tö trªn mét hμng qu¸ nhiÒu th× ta cã thÓ xuèng dßng A=[1 2 3 4 ... 5 6 7 8 9 10]; Sau khi kÕt thóc so¹n th¶o ta l−u vμo tªn_file . §Ó thùc thi c¸c lÖnh nhËp trong M-file ta dïng lÖnh sau trong command window nh− sau: >> ten_file ; c. NhËp matrËn tõ c¸c hμm cã s½n Matlab cã mét th− viÖn c¸c hμm cho phÐp t¹o ma trËn.Sau ®©y lμ mét sè hμm • ones(m,n) t¹o ma trËn m hμng vμ n cét ,víi c¸c phÇn tö ®Òu b»ng 1, ones(m) t¹o ma trËn vu«ng cÊp m, víi c¸c phÇn tö ®Òu lμ 1. • zeros(m,n) t¹o ma trËn kÝch th−íc m x n, víi c¸c phÇn tö ®Òu b»ng 0, zeros(m) t¹o ma trËn vu«ng cÊp m. • eyes(m,n) t¹o ma trËn kÝch th−íc m xn víi c¸c phÇn tö ®Òu b»ng 1, eyes(m) t¹o ma trËn vu«ng cÊp m . vÝ dô: ones(2,3) ans= 1 1 1 1 1 1 eyes(2,3) ans= 1 0 0 0 1 0 zeros(2,3) ans= 0 0 0 Trang 2
- 44. 0 0 0 3.2 Ma trËn sè phøc Sè phøc trong matlab ®−îc viÕt nh− sau: VÝ dô sè phøc 3+4*i dïng i ®Ó chØ sè ¶o >> a=3+ 4*i a= 3+ 4*i NÕu muèn ii ®Ó chØ sè ¶o Ta ®Þnh nghÜa ii= sqrt(-1) Sau ®ã b¹n viÕt: >> a=3+ 4*ii a= 3+ 4*i >>A=[ 1+2*i , 3+4*i ; 5+6*i, 4+5*i ] A=[ 1+2*i 3+ 4*i 5+6*i 4+5*i ] 3.3 T¹o vec t¬ Khi ta cÇn kh¶o s¸t ®Æc tÝnh cña ®å thÞ nμo ®ã trong mét kho¶ng x¸c ®Þnh, kho¶ng x¸c ®Þnh nμy ®−îc biÓu diÔn d−íi d¹ng vect¬ VÝ dô kh¶o s¸t ®Æc tÝnh ®å thÞ trong kho¶ng x=1 ®ªn 100 >> x= 1:100; % x lÊy gi¸ trÞ tõ 1 ®ªn100, b−íc t¨ng cña x lμ 1 >>t=0: 0.1 : 10;% b−íc nh¶y lμ cña t lμ 0.1 C«ng thøc chung t¹o vec t¬ lμ X=Xmin : b−íc_t¨ng: Xmax 3.4 Truy nhËp c¸c phÇn tö cña ma trËn §ª truy nhËp c¸c phÇn tö cña ma trËn ta lμm nh− sau: Gi¶ sö ma trËn A= Th× >> A(i,j) ; sÏ truy nhËp ®Õn phÇn tö hμng thø i vμ cét thø j 1 2 3 4 5 6 7 8 9 VÝ dô ®Ó truy nhËp ®Õn phÇn tö thø nhÊt ta : >> A(1,1) ans= 1 §Æc biÖt ®Ó gäi toμn bé sè hμng hoÆc toμn bé sè cét dïng to¸n tö (:) >> A(:,1) % gäi toμn bé sè hμng t−¬ng øng víi cét 1 ans= Trang 3
- 45. 1 4 7 >>A(1,:) % gäi toμn bé sè cét t−¬ng øng hμng 1 ans= 2 3 >> A(1:2,1) % gäi hμng 1 ®Õn hμng 2 t−¬ng øng víi cét thø nhÊt ans= 1 4 >>A(1:2,:) % gäi hμng 1 ®Õn hμng 2 t−¬ng øng víi tÊt c¶ c¸c cét ans= 1 2 3 4 5 6 3.5 PhÐp tÝnh ma trËn vμ m¶ng a. PhÐp tÝnh ma trËn • PhÐp tÝnh céng , phÐp tÝnh trõ :§iÒu kiÖn hai ma trËn A vμ B ph¶i cã cïng kÝch th−íc hoÆc mét trong hai lμ sè v« h−íng vÝ dô: >>a=[1 2 3 ;4 5 6; 7 8 9]; >>b=[2 3 4; 5 6 7; 8 9 10]; >>a+b; ans= 5 7 9 11 13 15 17 19 • Nh©n hai ma trËn A*B l−u ý r»ng sè cét cña ma trËn A ph¶i b»ng sè cét cña ma trËn B, ngo¹i trõ mét trong hai lμ sè v« h−íng • Chia tr¸i ma trËn () X=AB t−¬ng ®−¬ng víi viÖc gi¶i hÖ ph−¬ng tr×nh tuyÕn tÝnh A*X=B, gÇn t−¬ng ®−¬ng víi X=inv(A)*B • Chia ph¶i ma trËn(/) X=B/A t−¬ng ®−¬ng víi viÖc gi¶i ph−¬ng tr×nh tuyÕn tÝnh X*A=B gÇn t−¬ng ®−¬ng víi X= B*inv(A) b. PhÐp tÝnh dÉy Trang 4
- 46. Cho hai m¶ng sau: >>x=[1 2 3]; >>y=[2 3 4]; • PhÐp tÝnh céng , trõ gièng nh− phÐp tÝnh ®èi víi ma trËn >>x+y ans= 5 7 • PhÐp tÝnh nh©n(.*) >>x.*y ans= 2 6 12 • PhÐp tÝnh chia(./ hoÆc .) >> x./y ans= 0.5 0.66 0.75 >>x .y ans= 2 1.5 0.75 3.6 Gi¶i hÖ ph−¬ng tr×nh tuyÕn tÝnh 3.6.1 HÖ ph−¬ng tr×nh tuyÕn tÝnh : XÐt hÖ ph−¬ng tr×nh sau: a11*x1 + a12*x2+ . . . +a1n*xn=b1 a21*x2 + a22*x2+ . . . +a2n*xn=b2 . . am1*x1 + am2*x2+ . . . +amn*xn=bm Bμi to¸n ®Æt ra lμ t×m vÐc tor x=[x1;x2;x3....;xn] sao cho tho¶ m·n bμi to¸n trªn 3.6.2 HÖ Ph−¬ng tr×nh tuyÕn tÝnh kh«ng ®ång nhÊt Ph−¬ng tr×nh nh− sau gäi lμ ph−¬ng tr×nh tuyÕn tÝnh K§N a1*x1 + a2*x2 + . . . + an*xn = b b ®øng ®éc lËp (nã kh«ng nh©n víi biÕn nμo c¶) XÐt hÖ thèng sau: a11*x1 + a12*x2+ . . . +a1n*xn=b1 a21*x2 + a22*x2+ . . . +a2n*xn=b2 . . am1*x1 + am2*x2+ . . . +amn*xn=bm ViÕt theo ma trËn A= [a11 a12...a1n; a21 a22...a2n,....am1 am2...amn] Trang 5
- 47. X=[x1 x2.... xn]; B=[b1 b2 ... bn]; Trong ®ã A ®−îc gäi lμ ma trËn hÖ sè, X lμ vector kÕt qu¶ 3.6.2.1 Gi¶i hÖ ph−¬ng tr×nh b»ng hμm nghÞch ®¶o inv NÕu m=n th× A lμ ma trËn vu«ng, vμ nÕu det(A) lμ kh¸c 0 th× tån t¹i A-1 vμ vector kÕt qu¶ X ®−îc cho bëi : A-1 *A*X=X=A-1 *B VÝ dô Gi¶i hÖ sau: 2*x1 - x2 = 2 x1 + x2 = 5 Matlab command >> A=[ 2 -1 ; 1 1 ]; >> B=[ 2 ; 5]; >> X= inv(A)*B >> X= 2.3333 2.667 >> X= rats(X) X= 7/3 8/3 Tuy nhiªn chóng ta kh«ng thÓ ¸p dông ph−¬ng ph¸p trªn cho 2*x1 - x2 = 2 2*x1 - x2 = 0 Ma trËn hÖ sè A=[ 2 -1 ; 2 -1]; V× det(A)=0 => kh«ng ¸p dông ®−îc hμm nghÞch ®¶o cho ma trËn A 3.6.3 HÖ ph−¬ng tr×nh tuyÕn tÝnh ®ång nhÊt BiÓu diÔn d−íi d¹ng ma trËn nh− sau A*x=0 • NÕu det(A)#0 hÖ cã nghiÖm duy nhÊt lμ X=0 VÝ dô xÐt hÖ ph−¬ng tr×nh tuyÕn tÝnh sau 2*x1 - x2=0 x1+ x2=0 ë ®©y det(A)= 3 cho nghiÖm x1=0 , x2=0 • §èi víi hÖ ph−¬ng tr×nh thuÇn nhÊt cã det(A)=0 th× hÖ nμy cã v« sè nghiÖm VÝ dô XÐt hÖ ph−¬ng tr×nh tuyÕn tÝnh sau -6* x1 + 3*x2 = 0 2* x1 - x2 = 0 Trang 6
- 48. Ma trËn hÖ sè A= [ -6 3 ; 2 -1] , det(A)= 0 biÓu diÔn trªn ®å thÞ thÊy r»ng hai ®−êng nμy trïng nhau do vËy hÖ trªn cã v« sè nghiÖm • Tr−êng hîp sè biÕn n< sè ph−¬ng tr×nh m VÝ dô nh− sau: 3*x1 + 4*x2 - 2*x3= 0 -2*x1 + 3*x2 - 4*x3= 0 5*x1 + x2 + 2*x3= 0 -9*x1 + 5*x2 - 10*x3= 0 Ma trËn hÖ sè lμ ma trËn 4 x 3 ,®Þnh thøc lín nhÊt cã thÓ ®−îc x©y dùng tõ ma trËn A lμ ®Þnh thøc ma trËn 3 x 3, nh−ng ®Þnh thøc cña ma trËn kÝch th−íc 3 by 3 =0 ( A1=[ 3 4 - 2; -2 3 - 4 ; 5 1 2]=> det(A1)=0 ) Do ®ã ta x¸c ®Þnh tiÕp ma trËn 2 x 2 VÝ dô nh− sau A2=[ 3 4; -2 3] vμ det(A) # 0 ta nãi r»ng h¹ng cña ma trËn A(ma trËn hÖ sè) lμ b»ng 2 ®ång nghÜa víi viÖc ta chØ gi¶i hai ph−¬ng tr×nh bÊt kú trong sè tÊt c¶ c¸c ph−¬ng tr×nh trªn, vμ sè biÕn chóng ta g¸n gi¸ trÞ tuú ý lμ = n- r ( trong ®ã n lμ sè biÕn cßn r lμ h¹ng cña ma trËn A) Gi¶i hai ph−¬ng tr×nh : 3*x1 + 4*x2 - 2*x3= 0 -2*x1 + 3*x2 - 4*x3= 0 KÕt qu¶ : x1= (-10/17)*x3 vμ x2=(16/17)*x3 , víi x3 lÊy gi¸ trÞ tuú ý 3.6.4 Gi¶i hÖ ph−¬ng tr×nh tuyÕn tÝnh b»ng Matlab(Dïng to¸n tö ) 2*x1 - x2 = 2 x1 + x2 = 5 >> A=[ 2 -1 ; 1 1]; >> B=[2 ; 5]; >>X=AB Ph−¬ng ph¸p gi¶i nμy gäi lμ ph−¬ng ph¸p Gaussian elimination To¸n tö () th«ng th−êng cung cÊp mét kÕt qu¶ trong Matlab , trong mét sè tr−êng hîp nã lμ ph−¬ng ph¸p gi¶i riªng 3.7 §iÒu kiÖn cã nghiÖm Theo Kronecker-Capelli th× Mét hÖ ph−¬ng tr×nh cã mét lêi gi¶i khi vμ chØ khi ma trËn hÖ sè A vμ ma trËn [A B] cã cïng h¹ng. Gi¶ sö h¹ng cña hai ma trËn ®Òu lμ r th× x¶y ra c¸c tr−êng hîp sau ®©y • r=n HÖ ph−¬ng tr×nh cã nghiÖm duy nhÊt, Trang 7
- 49. • r< n HÖ ph−¬ng tr×nh cã v« sè nghiÖm, chóng ta cã thÓ gi¶i cho r biÕn nh− lμ hμm cña n-r biÕn kh¸c ,c¸c biÕn kh¸c nμy cã thÓ lÊy gi¸ trÞ tuú ý VÝ dô trªn rank(a)= rank([a b]) = n cho nªn hÖ nghiÖm duy nhÊt >> rank(A), rank([A B]) ans= 2 ans= 2 Chóng ta xem xÐt vÝ dô sau: 2* x1 + 3* x2 + 4*x3 = 4 x1 + x2 + x3 = 5 >> A=[ 2 3 4 ; 1 1 1]; >>B=[ 4 ; 5]; >>rank(A), rank([A B]) ans= 2 ans= 2 >> X= AB X= 8 0 3 H¹ng cña hai ma trËn A vμ [A B] b»ng nhau vμ b»ng 2 cho nªn hÖ cã mét lêi gi¶i , nh−ng do rank(A) < n cho nªn ta chØ gi¶i cho hai biÕn nh− lμ hμm cña biÕn cßn l¹i. KÕt qu¶ Matlab cho trªn chØ lμ mét tr−êng hîp riªng (n-r biÕn ®−îc g¸n =0) XÐt hÖ sau x1 + 2 *x2 + 3 *x3 = 12 3* x1 + 2 *x2 + x3 = 15 3*x1 + 4 *x2 + 7 *x3 = 13 10*x1 + 9 *x2 + 8 *x3 = 17 TÝnh to¸n b»ng Matlab nh− sau >> A=[1 2 3 ; 3 2 1 ; 3 4 7; 10 9 8]; >>B= [12 ; 15; 13 ; 17 ]; >>rank(A), rank([A B]) ans= Trang 8
- 50. 3 ans= 4 >> X= AB ans= 1.0887 -0.2527 1.5349 Khi thö l¹i nh− sau >> A* ans ans= 5.1882 4.2957 13.0000 20.8925 KÕt qu¶ kh«ng b»ng B HÖ ph−¬ng tr×nh trªn v« nghiÖm ,tuy nhiªn Matlab vÉn cho nghiÖm ,nghiÖm nμy kh«ng ph¶i nghiÖm ®óng mμ lμ nghiÖm xÊp xØ gi¶i theo tiªu chuÈn b×nh ph−¬ng tèi thiÓu( ta kh«ng ®Ò cËp tíi) 3.8 HÖ ®iÒu kiÖn yÕu Chóng ta nãi r»ng mét vÊn ®Ò ®−îc coi lμ ®iÒu kiÖn yÕu nÕu mét sù thay ®æi nhá trong d÷ liÖu sÏ dÉn ®Õn thay ®æi lín trong kÕt qu¶. §iÒu nμy lμ rÊt nguy hiÓm ®èi víi c¸c kü s− lμm viÖc víi c¸c thiÕt bÞ , sai sè ë c¸c thiÕt bÞ , sai sè do lμm trßn (®iÒu nμy ch¾c ch¾n x¶y ra) NÕu d÷ liÖu nμy lμ ®Çu vμo ®èi víi vÊn ®Ò trªn th× kÕt qu¶ thu ®−îc sÏ khñng khiÕp VÊn ®Ò chóng ta bμn tíi lμ §iÒu kiÖn yÕu cña hÖ ph−¬ng tr×nh tuyÕn tÝnh Ma trËn yÕu ®iÓn h×nh lμ ma trËn Hibert cã d¹ng nh− sau: A=[ 1 1/2 1/3.....1/n;1/2 1/3 ...1/(n+1) 1/3 1/4 1/5.... 1/(n+2) 1/n .. 1/(2n)] VÝ dô sau ®©y: Gi¶i hÖ ph−¬ng tr×nh tuyÕn tÝnh cã ma trËn hÖ sè sau A=[1 1; 1 1.01] B=[2 ; 2.01]; >> X= AB X= 1.0000 1.0000 Mét sai sè nhá ®−îc thÓ hiÖn trong long format >> format long; X= AB X= Trang 9
- 51. 1.000000000002 0.999999999998 NÕu ta thay ®æi mét phÇn tö cña A vÝ dô A(1, 2)=1.005 >> A(1,2)=1.005 ; X= AB X= -0.0000000099991 1.9999999999991 Thay ®æi A(1,2) =1.005 so víi gi¸ trÞ cò lμ 1 tøc lμ t¨ng 0.5% t−¬ng øng víi gi¸ trÞ x(1) gi¶m 101%, vμ t¨ng x(2) t¨ng 100% C¸ch gi¶i hÖ ph−¬ng tr×nh ®iÒu kiÖn yÕu A*X=B NÕu A lμ ma trËn Hillbert sö dông hμm tÝnh nghÞch ®¶o invhilb(n) trong ®ã n lμ kÝch th−íc cña ma trËn ®ã VÝ dô >>A= [ 1/1 1/2 ; 1/2 1/3]; >> B=[1 ;1/2] >>X= invhilb(2)* b NÕu A kh«ng ph¶i lμ ma trËn hilbert th× sö dông hμm symbolic VÝ dô A= [ 1 1.01; 0.5 1.02]; A=sym( [1 1.01 ; 0.5 1.02] ); B=[ 1.1; 1.2]; X= Ab 3 .9 LÖnh cond TÝnh ®iÒu kiÖn cña ma trËn CÊu tróc: >> cond(A) % A lμ ma trËn kÕt qu¶ tr¶ l¹i d¹ng nh− sau: a* 10k ; 0 < a < 9 k lμ sè digits kh«ng tin cËy trong kÕt qu¶ gi¶i hÖ ph−¬ng tr×nh tuyÕn tÝnh vμ trong viÖc nghÞch ®¶o ma trËn. NÕu k xÊp xØ 1 th× ®ãlμ ma trËn cã well -condition VÝ dô >>A=[1/2 1/3 1/4 ; 1/3 1/4 1/5; 1/4 1/5 1/6]; >> cond(A) ans= 1.3533e+003 Ta thÊy r»ng k= 3 tøc lμ cã 3 sè kh«ng ®¸ng tin cËy Tæng kÕt §Þnh nghÜa :H¹ng ma trËn Ar lμ mét ma trËn r hμng r cét ®−îc x©y dùng tõ A , kh«ng nhÊt thiÕt theo thø tù trong ma trËn A vμ det(Ar)#0 .NÕu bÊt kú ma trËn Ar+1 nμo ®−îc x©y dùng tõ r+1 hμng vμ r+1 cét cña A, det(Ar+1)=0 th× chóng ta nãi r»ng MatrËn A cã h¹ng b»ng r Mét hÖ thèng m ph−¬ng tr×nh tuyÕn tÝnh trong n biÕn (ch−a biÕt) a11*x1 + a12*x2+ . . . +a1n*xn=b1 Trang 10
- 52. a21*x1 + a22*x2+ . . . +a2n*xn=b2 . . am1*x1 + am2*x2+ . . . +amn*xn=bm Cã thÓ viÕt d−íi d¹ng form ma trËn AX=B Trong ®ã A lμ ma trËn hÖ sè vμ X lμ vector kÕt qu¶ §iÒu kiÖn cã nghiÖm MatrËn [A B] ®−îc gäi lμ ma trËn më réng cña hÖ. Theo Kronecker- Capelli th× hÖ ph−¬ng tr×nh tuyÕn tÝnh cã nghiÖm khi vμ chØ khi h¹ng cña ma trËn A b»ng h¹ng cña ma trËn bæ xung • NÕu r= n th× nghiÖm trªn lμ duy nhÊt • NÕu r<n th× hÖ trªn kh«ng x¸c ®Þnh vμ r biÕn cã thÓ ®−îc biÓu diÔn d−íi d¹ng hμm cña n-r biÕn kh¸c ,c¸c biÕn kh¸c nμy cã thÓ cho gi¸ trÞ bÊt kú( nãi c¸ch kh¸c hÖ v« sè nghiÖm) NghiÖm cña hÖ ph−¬ng tr×nh tuyÕn tÝnh ®−îc tÝnh trong Matlab b»ng to¸n tö ( ) .NÕu hÖ cã nghiÖm duy nhÊt Matlab sÏ cung cÊp cho nã , nÕu hÖ lμ kh«ng x¸c ®Þnh(r<n) th× to¸n tö ( ) sÏ cung cÊp cho chóng ta mét nghiÖm riªng trong ®ã n-r biÕn sÏ ®−îc ®Æt =0. Mét nghiÖm , nghiÖm nμy lμm tho¶ m·n tæng b×nh ph−¬ng cña c¸c nghiÖm bÐ nhÊt Dïng lÖnh X= pinv(A)*B NÕu h¹ng cña A # h¹ng matrËn më réng th× to¸n tö ( ) cung cÊp mét kÕt qu¶ nh−ng kÕt qu¶ nμy kh«ng ph¶i lμ nghiÖm cña hÖ HÖ thuÇn nhÊt khi vector B=0. Mét hÖ thuÇn nhÊt cã mét nghiÖm tÇm th−êng khi det(A) # 0.NÕu det(A)=0 hÖ cã nhiÒu h¬n mét nghiÖm trong tr−êng hîp nμy Matlab sÏ c¶nh b¸o ng−êi dïng : C©u hái «n tËp 1. C¸c c¸ch nhËp mét ma trËn ? 2. §iÒu kiÖn cã nghiÖm cña hÖ ph−¬ng tr×nh ®¹i sè tuyÕn tÝnh , c¸ch tÝnh 3. LËp ch−¬ng tr×nh mμ ®Çu vμo lμ hai ma trËn A vμ b, ®Çu ra lμ kÕt qu¶ th«ng bμo hÖ cã nghiÖm hay kh«ng. 4. HÖ ph−¬ng tr×nh ®iÒu kiÖn yÕu lμ gi?, nh÷ng ¶nh h−ëng cña nã. Bμi tËp Thùc hiÖn c¸c phÐp to¸n sau 1.NhËp hai ma trËn a=[ 1 2 3; 4 5 6], b=[5 6 7 ;8 9 10] . -TÝnh Addab= a+b . -TÝnh Subsab= a-b; -TÝnh Multab= a*b Trang 11
- 53. -TÝnh Mulba=b*a; -TÝnh Divab= a/b; vμ b/a 2. Cho m¹ch ®iÖn sau R1 R2 R3 e1 e2 Cho th«ng sè: R1= 10(omh) , R2= 20(omh) , R3= 10(omh) e1= 20(v) , e2= 30(v) TÝnh dßng ®iÖn I1 vμ I2 vμ I3 b»ng c¸ch lËp theo d¹ng hÖ ph−¬ng tr×nh ®¹i sè tuyÕn tÝnh ba Èn sè Bμi tËp gi¶i hÖ ph−¬ng tr×nh tuyÕn tÝnh sau: A*X= B Trong ®ã: A=[1/2 1/3 1/4 ; 1/3 1/4 1/5; 1/4 1/5 1/6]; B=[0.95 0.67 0.52] 1. Gi¶i hÖ ®· cho 2. Thay ®æi B(3)=0.53 råi gi¶i hÖ ph−¬ng tr×nh, so s¸nh víi tr−êng hîp trªn 3. TÝnh ®iÒu kiÖn cña ma trËn nμy vμ ®−a ra nhËn xÐt Chó ý khi gi¶i hÖ ph−¬ng tr×nh tuyÕn tÝnh víi ma trËn hÖ sè lμ ma trËn Hilbert (ma trËn ®iÒu kiÖn yÕu) th× ta dïng hμm tÝnh nghÞch ®¶o cña nã lμ hμm invhilb(n) §Þnh nghÜa Ma trËn Hilbert lμ: A=[ 1 1/2 1/3.....1/n;1/2 1/3 ...1/(n+1); Trang 12
- 54. Ch−¬ng 4 §å ho¹ Trong Matlab 4 .1 §iÓm vμ ®−êng trong ®å ho¹ matlab Dïng hμm Plot ®Ó vÏ ®iÓm -§−êng th¼ng trong mÆt ph¼ng §Ó vÏ c¸c ®−êng trong mÆt ph¼ng,c¸c hμm sè phô thuéc vμo biÕn vÝ dô nh− y=f(x) th× trong matlab cung cÊp cho ta hμm plot(x,y) ®Ó vÏ ,trong kh«ng gian ba chiÒu th× dïng hμm plot3(x,y,z) . tr−íc hÕt ta nãi qua vÒ c¸ch dïng hμm plot vμ c¸c vÝ dô minh ho¹ cô thÒ ®Ó hiÓu râ h¬n vÒ vÊn ®Ò nμy: 4.1.1 LÖnh plot Syntax plot(Y) plot(X1,Y1,...) plot(X1,Y1,LineSpec,...) plot(...,'PropertyName',PropertyValue,...) h = plot(...) M« t¶: Hμm plot cã nhiÒu c¸ch dïng nh− b¹n ®· thÊy ë trªn plot(y): Hμm nμy ®Ó biÓu diÔn c¸c cét cña y theo c¸c chØ sè t−¬ng øng cña chóng nÕu y lμ ma trËn c¸c sè thùc, nÕu y lμ sè phøc th× plot(y) t−¬ng øng víi plot(real(y),image(y)). Ta cã thÓ lÊy vÝ dô sau: A=[1 2 3 4 5 6 7 8 9 ] plot(A) sÏ ®−îc kÕt qu¶ nh− sau(giao ®iÓm ký hiÖu lμ dÊu o trßn ) Trang 1
- 55. C¸c dÊu trßn trªn h×nh vÏ thÓ hiÖn c¸c giao ®iÓm gi÷a c¸c phÇn tö cña c¸c cét vμ c¸c chØ sè t−¬ng øng cña chóng trong tõng cét . Cô thÓ c¸c giao ®iÓm (1,1) vμ (2,1);(3,1) t−¬ng øng lμ phÇn tö thø nhÊt cña c¸c cét,do lμ phÇn tö thø nhÊt cho nªn cã chØ sè lμ 1 plot(x,y...): VÏ c¸c ®−êng th¼ng t−¬ng øng víi c¸c cÆp ®iÓm (x,y )cña vÐc t¬ x vμ vec t¬ y.NÕu chØ mét trong x hoÆc y lμ ma trËn th× nã sÏ vÏ theo vector cét hoÆc hμng t−¬ng øng víi vector cßn l¹i phï hîp víi kÝch th−íc hμng hay cét cña matrËn ®ã. Cô thÓ : Gi¶ thö x: lμ vector cot x=[1 2 3]; vμ y lμ martrËn y=[1 2 3;4 5 6]; râ rμng lμ x cã kÝch th−íc b»ng víi kÝch th−íc hμng cña matrËn do vËy mμ nã sÏ biÓu diÔn c¸c hμng cña y theo x .KÕt qu¶ plot(x,y) nh− sau: plot(x,y,linespec...) còng cã thÓ viÕt nh− sau plot(x,y,linespec,x1,y1,linespec1,....); Hμm nμy gièng nh− hμm trªn ,nh−ng c¸c thuéc tÝnh vÒ ®−êng ®−îc thÓ hiÖn ë trong linespec .Sau ®©y ta cã thÓ liÖt kª c¸c thuéc tÝnh vÒ ®−êng Matlab cho phÐp b¹n sö dông mét sè ký tù sau ®©y ®Ó x¸c ®Þnh thuéc tÝnh cña ®−êng • Line style • Line width • Color • Marker type • Marker size • Marker face and edge coloring (for filled markers) Trang 2
- 56. Ma b ker types vμ colors tyle tla ®Þnh nghÜa c¸c chuçi x¸c ®Þnh cho kiÓu ®−êng, Mar 1. Line Style Specifiers Specifier Line S - −êng liÒn(default) ® -- ®−êng nÐt ®øt : dotted line -. ash-dot line d 2. Marker Specifiers rker Type Specifier Ma + lus sign p O ircle C * sterisk A . Point X ross C S quare S D iamond D ^ pward pointing triangle u V ownward pointing triangle d > ght pointing triangle ri Trang 3
- 57. < ft pointing triangle le P ve-pointed star (pentagram) fi H ix-pointed star (hexagram) s 3. Color Specifiers olor Specifier C R ed R G reen G B lue B C yan C M agenta M Y ellow Y K lack B W hite W C¸c lÖnh plot chÊp nhËn mét th«ng sè Linespec ,th«ng sè nμy ®Þnh nghÜa ba phÇn tö ,c¸c g) nh dÊu) Chó ý r»ng khi kÕt hîp chóng ta cã thÓ ®Ó theo mét thø tù bÊt kú or') phÇn tö nμy x¸c ®Þnh ®−êng • Line style (kiÓu ®−ên • Marker symbol (KiÓu ®¸ • Color (kiÓu mÇu) For example plot(x,y,'-. Trang 4
- 58. VÏ y theo x sö dông kiÓu ®−êng lμ dash-dot ®Æt vßng trßn(o) t¹i c¸c giao ®iÓm (x,y) ,vμ mÇu cña ®−êng vμ mÇu cña vßng trßn ®¸nh dÊu lμ mÇu ®á NÕu b¹n x¸c ®Þnh mét ®iÓm ®¸nh dÊu, kh«ng ph¶i lμ kiÓu ®−êng, Matlab chØ vÏ c¸c ®iÓm ®¸nh dÊu I. VÝ dô plot(x,y,'d') 4.1.2 Hμm plot(x,y, protypename,protypevalue....) Hμm nμy x¸c ®Þnh râ c¸c thuéc tÝnh cña ®−êng th¼ng vÝ dô nh− ChiÒu réng cña ®−êng th¼ng LineStyle {-} | -- | : | -. | none §é réng cña ®−êng(Linewith) mÆc ®Þnh lμ o.5 points( 1point=1/72 inch) VÝ dô vÒ Linepropertype: plot(t,sin(2*t),'-mo',... 'LineWidth',2,... 'MarkerEdgeColor','b',... 'MarkerFaceColor',’r’,... 'MarkerSize',12) Gi¶i thÝch nh− sau: Hμm trªn vÏ ®å thÞ f=sin(2*t) theo biÕn t, ®Æc tÝnh cña ®−êng lμ mÇu (magne) ,giao hai ®iÓm lμ h×nh trßn(s), ®−êng lμ liªn tôc(solid line) Line width lμ 2(point) ( 1point=1/72 inches) default lμ 0.5 points MarkerEdgeColor lμ mÇu ®en( blue) Mçu trong (mÆt) cña c¸c ®iÓm nót giao lμ mÇu ®á: Chóng ta thÊy r»ng ®å thÞ ®−îc x©y dùng tõ viÖc nèi c¸c ®iÓm cã to¹ ®é (x,y) b»ng c¸c ®o¹n th¼ng *tû lÖ c¸c trôc sÏ ®−îc matlab tù ®éng t¹o ra sao cho phï hîp 4.1.3 §Ó vÏ nhiÒu ®å thÞ trªn cïng mét h×nh vÏ th× chóng ta cã hai c¸ch +VÏ ®å thÞ thø nhÊt + Dïng lÖnh Hold on +VÏ tiÕp ®å thÞ thø hai + hold off hoÆc Dïng hμm plot(x1,y1,x2,y2) VÝ dô ta vÏ hai hμm y=sin(x) vμ y1=cos(x) Ta dïng lÖnh plot nh− sau: plot(x,y,x,y1); Trang 5
- 59. 4.1.4 Title , xlabel, ylabel, gtext, legend, grid Title dïng ®Ó viÕt tiªu ®Ò cho ®å thÞ VÝ dô Title(.............................) Xlabel( string) ®Æt tªn nh·n cho trôc x Ylabel(string) ®Æt tªn nh·n cho trôc y Gtext(string) ®Ó viÕt text vμo ®å thÞ Legend(string,-1) ®Ó ghi chó thÝch cho ®å thÞ, sè -1 ®Ó ghi chó thÝch bªn ngoμi c¸c trôc cña h×nh vÏ Grid on hoÆc Grid off ®Ó më hoÆc t¾t Grid t=0:pi/6:pi; plot(t,sin(2*t),'-mo',... 'LineWidth',2,... 'MarkerEdgeColor','b',... 'MarkerFaceColor','r',... 'MarkerSize',14) legend('y=sin(2*t)','y=cos(2*t)',-1);( chó ý viÕt ®óng thø tù) grid on; xlabel('truc thoi gian'); ylabel('truc Sin va cos'); title('Do thi ham sin(2*t)'); hold on; j=cos(2*t); plot(t,j,'-b+'); hold off; 4.2 Hμm plot3(x,y,z) ®Ó vÏ c¸c ®iÓm vμ ®−êng trong kh«ng gian Ngoμi viÖc thªm trôc z c¸c hμm nμy sö dông gièng nh− hμm plot(x,y) CÊu tróc plot3(X1,Y1,Z1,...) plot3(X1,Y1,Z1,LineSpec,...) plot3(...,'PropertyName',PropertyValue,...) h = plot3(...) ViÖc sö dông c¸c hμm nμy gièng víi hμm Plot trong 2D do vËy ta kh«ng ®Ò cËp tíi n÷a Chó ý tíi hμm View(a,b) ®Ó quan s¸t gãc nh×n cña ®å thÞ trong ®ã a lμ gãc tÝnh theo chiÒu ng−îc chiÒu kim ®ång hå tõ phÝa ©m cña trôc y cßn b lμ gãc nh×n tÝnh b¾ng ®é xuèng mÆt ph¼ng x,y Gi¸ trÞ mÆc ®Þnh cña a vμ b lμ -37.5 0 vμ 30 0 %VÝ dô Trang 6
- 60. %Plot a three-dimensional helix. % VÏ mÆt ph¼ng x= sin(t) ,y=cos(t) , z=t t = 0:pi/50:10*pi; plot3(sin(t),cos(t),t) grid on; axis square view(-80,30); xÐt hai tr−êng hîp view(-80,30); view(-40,30); Khi cho a=0 vμ b=90 th× h×nh vÏ trë vÒ h×nh vÏ trong mÆt ph¼ng to¹ ®é hai chiÒu 4.3 Hμm semilogx, semilogy Semi-logarithmic plots CÊu tróc semilogx(Y) semilogx(X1,Y1,...) semilogx(X1,Y1,LineSpec,...) semilogx(...,'PropertyName',PropertyValue,...) h = semilogx(...) semilogy(...) h = semilogy(...) M« t¶ Semilogx(y) vÏ gièng nh− plot(y) nh−ng chØ kh¸c r»ng tû lÖ trªn trôc x lμ logarit c¬ sè 10, t−¬ng tù nh− vËy ®èi víi Semilogy(y) th× tû lÖ trªn trôc y theo logarit c¬ sè 10 øng víi truc x. X=0:10:1000; Y=100*x; Subplot(2,2,1); Semilogx(x,y,'.'); Xlabel('log'); Ylabel('tuyen tinh'); subplot(2,2,2); semilogy(x,y,'.'); xlabel('tuyen tinh'); ylabel('log'); title(' subplot(2,2,3); loglog(x,y,'.'); xlabel('log'); ylabel('log'); title(' loglog(x,y)'); grid on; subplot(2,2,4 ); plot(x,y,'.'); xlabel('tuyen tinh'); ylabel('tuyen tinh'); Title(' semilogx(x,y)'); Grid on; title(' Trang 7
- 61. Trong kh«ng gian 3 chiÒu th× ta kh«ng dïng c¸c hμm trªn ®Ó vÏ ,mμ ta sö dông hμm plot3 vμ dïng hμm set ®Ó ®Æt trôc to¹ ®é t=1:1:100; x=sin(20*pi*t); y=cos(20*pi*t); z=t; subplot(1,2,1); plot3(x,y,z); set(gca,'Zscale','log');grid on;view(125,7); 4.4 VÏ trong hÖ to¹ ®é cùc CÊu tróc polar(theta,rho) polar(theta,rho,LineSpec) M« t¶ The polar function accepts polar coordinates, plots them in a Cartesian plane, and draws the polar grid on the plane. polar(theta,rho) creates a polar coordinate plot of the angle theta versus the radius rho. theta is the angle from the x-axis to the radius vector specified in radians; rho is the length of the radius vector specified in dataspace units. polar(theta,rho,LineSpec) LineSpec specifies the line type, plot symbol, and color for the lines drawn in the polar plot. Examples Create a simple polar plot using a dashed, red line: t = 0:.01:2*pi; polar(t,sin(2*t).*cos(2*t),'--r') this is a figure for plotting Polar(phi, r); Khi chuyÓn tõ hÖ to¹ ®é cùc sang hÖ to¹ ®é §ªcart ta lμm nh− sau [x,y]=pol2cart(phi, r) sau ®ã dïng lÖnh Plot(x,y) t = 0:.01:2*pi; h=sin(2*t).*cos(2*t); [x,y]=pol2cart(t,h); axis(equal) plot(x,y);grid on; notice : command Axis(‘equal’) set unit which is divided in X and Y axis §èi víi hÖ to¹ ®é cÇu Trong Matlab kh«ng cã hμm ®Ó vÏ .tuy nhiªn ta cã thÓ chuyÓn ®æi tõ hÖ to¹ ®é cÇu thμnh hÖ to¹ ®é §ÒCart trong kh«ng gian [x,y,z]=sph2cart(theta,phi,r) sau ®ã dïng hμm vÏ trong kh«ng gian lμ plot3(x,y,z) Trang 8
- 62. 4.5 §å thÞ cét bar, barh CÊu tróc bar(Y) bar(x,Y) bar(...,width) bar(...,'style') bar(...,LineSpec) II. M« t¶ VÏ biÓu ®å c¸c gi¸ trÞ trong vÐc tor hoÆc trong MatrËn nh− lμ thanh ngang hoÆc thanh th¼ng ®øng bar(Y) vÏ mét ®å thÞ cét cho mçi phÇn tö trong Y. NÕu Y lμ mét ma trËn ,bar nhãm c¸c thanh ®−îc t¹o ra bëi mçi phÇn tö trong mçi hμng. Tû lÖ trôc x tõ 1 to length(Y) khi Y lμ mét vector, vμ 1 ®Õn size(Y,1), ®ã chÝnh lμ sè hμng , khi Y lμ mét ma trËn . bar(x,Y) vÏ mét ®å thÞ cét cho mçi phÇn tö trong Y t¹i c¸c vÞ trÝ x¸c ®Þnh trong x, ë ®ã x lμ vector t¨ng ®Þnh nghÜa c¸c kho¶ng cho c¸c cét th¼ng ®øng. NÕu Y lμ mét ma trËn, bar gép c¸c cét t−¬ng øng trong cïng mét hμng trong Y t¹i vÞ trÝ t−¬ng øng víi mét phÇn tö trong x. bar(...,width) hμm nμy gièng c¸c hμm trªn nh−ng cã thªm ®Æc tÝnh ®Æt ®é réng cña cét.Gi¸ trÞ mÆc ®Þnh cña width lμ 0.8,. NÕu width is 1, c¸c cét trong mét nhãm ch¹m vμo bar(...,'style') X¸c ®Þnh kiÓu cña cét 'style' lμ 'group' hoÆc 'stack'. 'group' lμ chÕ ®é mÆc ®Þnh • 'group' biÓu diÔn n nhãm cña m cét th¼ng ®øng ,ë ®ã n lμ sè hμng vμ m lμ sè cét trong Y. • 'stack' BiÓu diÔn ®å thÞ cét cho mçi hμng cña Y. ChiÒu cao cña cét lμ tæng c¸c phÇn tö trong mét hμng bar(...,LineSpec) displays all bars using the color specified by LineSpec. VÝ dô Plot a bell shaped curve: x = -2.9:0.2:2.9; bar(x,exp(-x.*x)) colormap hsv Trang 9
- 63. T−¬ng tù ®å thÞ cét trong kh«ng gian lÖnh vÉn gi÷ nguyªn nh−ng thay v× bar ta thay lÖnh bar3(x,y,z) 4.6 §å thÞ b¸nh (Pie) CÊu tróc: pie( x ) :Hμm nμy vÏ ®å thÞ b¸nh víi c¸c 'khoanh' ®−îc x¸c ®Þnh bëi phÇn tr¨m c¸c gi¸ trÞ trong vector x vÝ dô x=[ 1 2 3 4] ph©n thμnh 4 khoanh trªn toμn bé vßng trßn ,mçi khoanh t−¬ng øng phÇn tr¨m c¸c phÇn tö trong x >>x=[ 1 2 3 4]; >>pie(x) cho ®å thÞ nh− sau: §Ønh cao nhÊt øng víi phÇn tö ®Çu tiªn cña vÐc tor ,c¸c phÇn tö tiÕp theo ®−îc bè trÝ theo chiÒu ng−îc chiÒu kim ®ång hå . NÕu tæng c¸c phÇn tö trong vec tor x <1 th× trªn ®å thÞ b¸nh biÓu diÔn phÇn tr¨m chÝnh lμ c¸c phÇn tö ®ã . VÝ dô >> x=[ 0.1 0.2 0.3 ] % t−¬ng øng víi 10% 20% 30% >>pie(x); Trang 10
- 64. Trang 11
- 65. ch−¬ng 4 Ma trËn - c¸c phÐp to¸n vÒ ma trËn. 4.1 Kh¸i niÖm: - Trong MATLAB d÷ liÖu ®Ó ®−a vμo xö lý d−íi d¹ng ma trËn. - Ma trËn A cã n hμng, m cét ®−îc gäi lμ ma trËn cì n × m. §−îc ký hiÖu An × m - PhÇn tö aij cña ma trËn An × m lμ phÇn tö n»m ë hμng thø i, cét j . - Ma trËn ®¬n ( sè ®¬n lÎ ) lμ ma trËn 1 hμng 1 cét. - Ma trËn hμng ( 1 × m ) sè liÖu ®−îc bè trÝ trªn mét hμng. a11 a12 a13 ... a1m - Ma trËn cét ( n × 1) sè liÖu ®−îc bè trÝ trªn 1 cét. a11 a21 a31 . . an1 4.1.1 C¸c qui ®Þnh ®Ó ®Þnh nghÜa mét ma trËn: - Tªn ma trËn cã thÓ gåm 31 ký tù. B¾t ®Çu ph¶i b»ng ch÷ c¸i sau ®ã cã thÓ lμ sè, ch÷ c¸i, c¸c ký tù ®Æc biÖt ... Tªn ®Æt bªn tr¸i dÊu b»ng , bªn ph¶i dÊu b»ng lμ c¸c phÇn tö cña ma trËn. - Bao quanh c¸c phÇn tö cña ma trËn b»ng dÊu ngoÆc vu«ng. - C¸c phÇn tö trong ma trËn ®−îc c¸ch nhau bëi ký tù trèng hoÆc dÊu phÈy ( , ). - KÕt thóc mét hμng trong ma trËn bëi dÊu ( ; ). 4.1.2 C¸c c¸ch ®Ó nhËp mét ma trËn: - LiÖt kª trùc tiÕp:VD >> A =[1 2 3; 4 5 6 ; 7 8 9] >> B =[1 2 3; 4 5 6 ; 7 8 9] - NhËp th«ng qua lÖnh. Dïng lÖnh input Trang 1
- 66. >> input('Nhap gia tri cho ma tran C = ') Nhap gia tri cho ma tran C = [1 3 4;4 5 7;7 5 8] ans = 1 3 4 4 5 7 7 5 8 Chó ý khi kÕt thóc mét c©u lÖnh cã thÓ dïng dÊu (; ) hoÆc kh«ng dïng dÊu ( ;). - NÕu dïng dÊu (;) c©u lÖnh ®−îc thùc hiÖn nh−ng kÕt qu¶ kh«ng hiÖn ra mμn h×nh. - NÕu kh«ng dïng dÊu ( ; ) c©u lÖnh ®−îc thùc hiÖn vμ kÕt qu¶ ®−îc hiÖn ra mμn h×nh. - Trong c¶ 2 tr−êng hîp trªn sau khi c©u lÖnh ®−îc thùc hiÖn kÕt qu¶ ®Òu ®−îc l−u vμo trong bé nhí vμ cã thÓ sö dông cho c¸c c©u lÖnh tiÕp theo. Vd >>a = [1 2 3;3 2 4;4 5 1]; >> b = [1 2 3;4 5 6;7 8 9] b = 1 2 3 4 5 6 7 8 9 C¶ 2 ma trËn A, B ®Òu ®−îc l−u vμo trong bé nhí vμ cã thÓ ®−îc sö dông cho nh÷ng c©u lÖnh tiÕp theo. >> c = a*b c = 30 36 42 39 48 57 31 41 51 4.1.3 HiÓn thÞ l¹i ma trËn: Trang 2
- 67. - §Ó hiÓn thÞ l¹i ma trËn ta gâ tªn ma trËn sau ®ã enter. VD >> c c = 30 36 42 39 48 57 31 41 51 - §Ó hiÓn thÞ néi dung cña ma trËn hoÆc lêi th«ng b¸o (trong dÊu nh¸y ®¬n) ta dïng lÖnh: disp VD >> disp (c) c = 30 36 42 39 48 57 31 41 51 >> disp('hiÓn thÞ lêi th«ng b¸o nμy') hiÓn thÞ lêi th«ng b¸o nμy Chó ý: - C¸c phÇn tö trong ma trËn cã thÓ lμ c¸c sè phøc: VD >> a=[1+3i 2+2i;3+i 1+i] a = 1.0000 + 3.0000i 2.0000 + 2.0000i 3.0000 + 1.0000i 1.0000 + 1.0000i - C¸c phÇn tö trong ma trËn cã thÓ lμ c¸c ký tù. Nh−ng tr−íc tiªn ta ph¶i khai b¸o c¸c phÇn tö b»ng lÖnh syms VD >> syms sinx cosx a >> b = [ sinx cosx; a cosx] b = [ sinx, cosx] [ a, cosx] >> c=[a sinx; a a] Trang 3
- 68. c = [ a, sinx] [ a, a] 4.2. Xö lý trong ma trËn: 4.2.1 T¹o vÐct¬ tõ ma trËn: C«ng thøc tæng qu¸t: BiÕn = giíi h¹n ®Çu : b−íc ch¹y : gíi h¹n cuèi Giíi h¹n ®Çu, giíi h¹n cuèi, b−íc ch¹y: lμ c¸c sè thùc B−íc ch¹y cã thÓ d−¬ng hoÆc ©m. VD T¹o 1 vect¬ t ch¹y tõ 0 ®Õn 0.6 víi b−íc ch¹y tiÕn lμ 0.1 >> t=0: 0.1:0.6 t = 0 0.1000 0.2000 0.3000 0.4000 0.5000 0.6000 VD: T¹o 1 vect¬ t ch¹y tõ 0.6 ®Õn 0 víi b−íc ch¹y lïi lμ 0.1 >>t=0.6:-0.1:0 t = 0.6000 0.5000 0.4000 0.3000 0.2000 0.1000 0 Chó ý : Trong tr−êng hîp giíi h¹n trªn, gíi h¹n d−íi lμ c¸c sè nguyªn vμ b−íc ch¹y b»ng 1 th× ta kh«ng cÇn ®−a b−íc ch¹y vμo trong biÓu thøc. VD >> C = 1:5 C = 1 2 3 4 5 4.2.2 Gäi c¸c phÇn tö trong ma trËn. MATLAB cho phÐp ta xö lý ®Õn tõng phÇn tö cña ma trËn. §Ó truy cËp ®Õn tõng phÇn tö cña ma trËn ta ph¶i gäi ®−îc chóng th«ng qua chØ sè cña tõng phÇn tö. Tªn cña ma trËn( ChØ sè hμng, chØ sè cét) VD: >> A = [1:3; 4:6; 7:9] A = 1 2 3 4 5 6 7 8 9 >> B = A(1,1) Trang 4
- 69. B = 1 >> A(3,3) = A(2,2) + B A = 1 2 3 4 5 6 7 8 6 Chó ý: Trong tr−êng hîp ta muèn gäi tÊt c¶ c¸c hμng hoÆc tÊt c¶ c¸c cét ta cã thÓ dïng to¸n tö hai chÊm ( : ) VD: >> A = [1:3; 4:6; 7:9] A = 1 2 3 4 5 6 7 8 9 >> B = A(2,:) B = 4 5 6 >>C = A(:,2) C = 2 5 8 4.2.3 Gäi 1 ma trËn con tõ mét ma trËn lín. VD >> A = [1:3; 4:6; 7:9] A = 1 2 3 4 5 6 7 8 9 >> B = A ( 2:3,1:2 ) B = Trang 5
- 70. 5 7 8 >> c =[a(1,1) a(3,3); a(2,3) a(3,1)] c = 1 9 6 7 4.3 C¸c ma trËn ®Æc biÖt: 4.3.1 Ma trËn zeros. TÊt c¶ c¸c phÇn tö trong ma trËn ®Òu b»ng 0. VD >> C = zeros (2,3) C = 0 0 0 0 0 0 >> d = zeros(3) d = 0 0 0 0 0 0 0 0 0 4.3.2 Ma trËn ones. TÊt c¶ c¸c phÇn tö trong ma trËn ®Òu b»ng 1 VD >> C = ones (2,3) C = 1 1 1 1 1 1 >> d = ones(3) d = 1 1 1 1 1 1 1 1 1 4.3.3 Ma trËn ma ph−¬ng Magic: Tæng tÊt c¶ gi¸ trÞ c¸c phÇn tö trªn hμng = Tæng tÊt c¶ gi¸ trÞ c¸c phÇn tö trªn cét = Tæng tÊt c¶ gi¸ trÞ c¸c phÇn tö trªn ®−êng chÐo cña ma trËn Vd Trang 6
- 71. >> A = Magic (3) A= 8 1 6 3 5 7 4 9 2 4.3.4 Ma trËn eye. TÊt c¶ c¸c phÇn tö trªn ®−êng chÐo cã gi¸ trÞ 1, c¸c phÇn tö kh¸c cã gi¸ trÞ 0. VD >> B = eye (3) B = 1 0 0 0 1 0 0 0 1 4.4 C¸c phÐp to¸n vector: PhÐp to¸n C«ng thøc Matlab Céng, trõ A+B, A-B A+B, A-B Nh©n m¶ng A.B = C A.*B Chia tr¸i m¶ng BA B.A Chia ph¶i m¶ng A/B A./B Luü thõa m¶ng AB A.^B 4.4.1 C¸c phÇn tö lμ c¸c sè thùc: >>a=[1 1 2;2 1 1] a = 1 1 2 2 1 1 >> b=[1 2 2; 1 1 1] b = 1 2 2 1 1 1 Trang 7
- 72. >> c=a.*b c = 1 2 4 2 1 1 >> d=a./b d = 1.0000 0.5000 1.0000 2.0000 1.0000 1.0000 >> e=a.b e = 1.0000 2.0000 1.0000 0.5000 1.0000 1.0000 >> f=a.^b f = 1 1 4 2 1 1 4.4.2 C¸c phÇn tö lμ c¸c sè phøc. >>a=[1+i 2+3i;3-4i 1+3i] a = 1.0000 + 1.0000i 2.0000 + 3.0000i 3.0000 - 4.0000i 1.0000 + 3.0000i >> b=[2+i 2+2i;1-4i 3+3i] b = 2.0000 + 1.0000i 2.0000 + 2.0000i 1.0000 - 4.0000i 3.0000 + 3.0000i >> c=a.*b c = 1.0000 + 3.0000i -2.0000 +10.0000i -13.0000 -16.0000i -6.0000 +12.0000i 4.4.3 C¸c phÇn tö lμ c¸c tham sè: >> syms a b c Trang 8
- 73. >>A=[a b; b c] A = [ a, b] [ b, c] >> B=A B = [ a, b] [ b, c] >> C=A.*B C = [ a^2, b^2] [ b^2, c^2] 4.5 C¸c phÐp to¸n vÒ ma trËn: 4.5.1 PhÐp chuyÓn vÞ: PhÐp chuyÓn ®æi vÐct¬ hμng thμnh vÐct¬ cét gäi lμ phÐp chuyÓn vÞ. Thùc hiÖn phÐp chuyÓn vÞ b»ng to¸n tö dÊu nh¸y ®¬n ( ‘ ). VD >> A = [1:3; 4:6; 7:9] A = 1 2 3 4 5 6 7 8 9 >> B = A’ B = 1 4 7 2 5 8 3 6 9 Ma trËn B ®−îc gäi lμ ma trËn chuyÓn vÞ cña ma trËn A 4.5.2 PhÐp céng - trõ ma trËn.( + , - ) PhÐp céng vμ trõ ma trËn ®−îc thùc hiÖn víi c¸c ma trËn cã cïng kÝch cì. Trang 9
- 74. Cij = Aij + Bij Dij = AÞj - Bij >> A = [1:3; 4:6; 7:9] A = 1 2 3 4 5 6 7 8 9 >> B = A’ B = 1 4 7 2 5 8 3 6 9 >> C = A + B C = 2 6 10 6 10 14 10 14 18 4.5.3 PhÐp nh©n, chia ma trËn: C = A*B. §Ó thùc hiÖn ®−îc phÐp nh©n trªn th× sè cét cña ma trËn A ph¶i b»ng sè hμng cña ma trËn B. ∑ = = n 1 k kj ik ij .B A C C¸c phÇn tö trong ma trËn C ®−îc tÝnh nh− sau: VD c¸c phÇn tö trong ma trËn lμ c¸c sè thùc. >> A = [1 2 1; 1 0 1] A = 1 2 1 1 0 1 >> B = [1 0 2; 2 1 1; 1 1 1] Trang 10
- 75. B = 1 0 2 2 1 1 1 1 1 >> C = A * B C = 6 3 5 2 1 3 VD c¸c phÇn tö trong ma trËn lμ c¸c sè phøc. >> a=[1+2i 2+2i;1+3i 2+2i] a = 1.0000 + 2.0000i 2.0000 + 2.0000i 1.0000 + 3.0000i 2.0000 + 2.0000i >> b=[1+i 2+i;1+3i 2+i] b = 1.0000 + 1.0000i 2.0000 + 1.0000i 1.0000 + 3.0000i 2.0000 + 1.0000i >> c=a*b c = -5.0000 +11.0000i 2.0000 +11.0000i -6.0000 +12.0000i 1.0000 +13.0000i VD c¸c phÇn tö trong ma trËn lµ c¸c tham sè >> syms a b c >>d=[2*a b c; a b c; 0 0 a] d = [ 2*a, b, c] [ a, b, c] [ 0, 0, a] >> e=[a b c; 2*a 2*b^2 c ; a 0 b] e = Trang 11
- 76. [ a, b, c] [ 2*a, 2*b^2, c] [ a, 0, b] >> f=d*e f = [ 2*a^2+2*b*a+c*a, 2*b*a+2*b^3, 2*c*a+2*c*b] [ a^2+2*b*a+c*a, b*a+2*b^3, c*a+2*c*b] [ a^2, 0, b*a] PhÐp chia ma trËn thùc chÊt lμ phÐp nh©n víi ma trËn nghÞch ®¶o. B A B A C 1 * = = LÊy ma trËn nghÞch ®¶o thùc hiÖn b»ng hμm inv. >> A = [1 2 1; 1 0 1] A = 1 2 1 1 0 1 >> B = [1 0 2; 2 1 1; 1 1 1] B = 1 0 2 2 1 1 1 1 1 >> C = inv(B) C = 0 1.0000 -1.000 -0.5000 -0.5000 1.5000 0.500 -0.5000 0.5000 >> D = A*C D= - 0.5000 -0.5000 2.5000 0.5000 0.5000 -0.5000 Trang 12
- 77. Chó ý: Trong c¸c phÐp tÝnh trªn nÕu nÕu thùc hiÖn víi mét sè thùc th× tÊt c¶ c¸c phÇn tö trong ma trËn sÏ ®−îc céng, trõ, nh©n, chia ( / ) víi sè thùc ®ã tuú thuéc vμo phÐp to¸n t−¬ng øng. >> A = [1 2 1; 1 0 1] A = 1 2 1 1 0 1 >> B = A*2 B = 2 4 2 2 0 2 4.5.4 PhÐp quay ma trËn: Quay ma trËn B ®i 1 gãc 90 ®é theo ng−îc chiÒu kim ®ång hå. >> a=[1 2 3;4 5 6;7 8 9] a = 1 2 3 4 5 6 7 8 9 >> b=rot90(a) b = 3 6 9 2 5 8 1 4 7 4.5.5.PhÐp ®¶o ma trËn: §¶o c¸c phÇn tö cña ma trËn tõ tr¸i sang ph¶i. >> c=fliplr(b) c = 9 6 3 8 5 2 7 4 1 Trang 13
- 78. Ch−¬ng 5 C¬ së ph−¬ng ph¸p tÝnh 5.1 Néi suy vμ thuËt to¸n néi suy V× sao ph¶i néi suy: Trong thùc tÕ khi ®o mét ®¹i l−îng vËt lý bÊt kú t¹i nh÷ng ®iÒu kiÖn m«i tr−êng thay ®æi(cßn cã nhiÒu ®¹i l−îng kh¸c thay ®æi) ta nhËn ®−îc c¸c gi¸ trÞ rêi r¹c ,vμ cã tÝnh thèng kª,øng víi mçi thêi ®iÓm ta nhËn ®−îc mét gi¸ trÞ ®o nh− vËy khi ta muèn x¸c ®Þnh gi¸ trÞ ®o ë mét thêi ®iÓm bÊt kú th× ta ph¶i dïng phÐp néi suy. Trong ch−¬ng nμy ta chØ t×m hiÓu vμ tÝnh to¸n cho 2 phÐp néi suy ®ã lμ : +Néi suy lagrange cho bμi to¸n mét chiÒu +Néi suy lagrange cho bμi to¸n hai chiÒu 5.1.1 Néi suy lagrange cho bμi to¸n mét chiÒu I. Lý thuyÕt Gi¶ sö cã n ®iÓm ®o rêi r¹c t−¬ng øng víi kÕt qu¶ ®o nh− sau: x x0 x1 x2 . . . . . . . . . . xn f f0 f1 f2 . . . . . . . . . . fn C«ng thøc néi suy lagrange bËc N tÝnh gi¸ trÞ ®o ®−îc t¹i mét ®iÓm bÊt kú lμ : ThuËt to¸n néi suy: % thuat toan noi suy cho bai toan mot chie function T=NS1C(x,f,xa); i=length(x); j=length(f); T=0;n=i; if(i~=j) error('Ban nhap sai'); end i=1; while(i<=n) g=1;j=1; while(j<=n) if(i~=j) g=g*(xa-x(j))./(x(i)-x(j)); end j=j+1; end T=T+g*f(i); Trang 1
- 79. % in ra so lieu sl=[i x(i) f(i)] i=i+1; end ThuËt to¸n néi suy cho bμi to¸n mét chiÒu lagrange interp1(néi suy theo spline) NhËp x , y,xa i= length(x) j=length(y) n=i; f=0 i~=j ? G¸n i=1 i<=n ? G¸n j=1; 1 j<=n ? i~=j ? g=g* (Xa-x(j))/(x(i)- (j) j=j+ 1 f= f + g* i=i + 1 One-dimensional data interpolation (table lookup) Syntax yi = interp1(x,Y,xi) yi = interp1(Y,xi) yi = interp1(x,Y,xi,method) Trang 2
- 80. yi = interp1(x,Y,xi,method,'extrap') yi = interp1(x,Y,xi,method,extrapval) M« t¶ yi = interp1(x,Y,xi) tr¶ vÒ vector yi chøa c¸c phÇn tö t−¬ng øng víi c¸c phÇn tö cña xi vμ gi¸ trÞ tr¶ vÒ ®ã ®−îc x¸c ®Þnh b»ng c¸ch sù néi suy(interpolation) trong vectors x and Y. The vector x x¸c ®Þnh c¸c ®iÓm t¹i ®ã d÷ liÖu Y ®−îc cho tr−íc (the points at which the data Y is given). NÕu Y lμ mét ma trËn, th× viÖc néi suy ®−îc thùc hiÖn cho mçi cét cña Y vμ Yi cã kÝch th−íc lμ yi is length(xi)-by-size(Y,2). (the interpolation is performed for each column of Y and yi is length(xi)-by-size(Y,2)) yi = interp1(Y,xi) gi¶ sö r»ng x = 1:N, ë ®ã N =length(y) lμ chiÒu dμi cña Y nÕu Y lμ vector, hoÆc size(Y,1) nÕu Y lμ matrËn . yi = interp1(x,Y,xi,method) interpolates using alternative methods: 'nearest' Nearest neighbor interpolation 'linear' Linear interpolation (default) 'spline' Cubic spline interpolation 'pchip' Piecewise cubic Hermite interpolation 'cubic' (Same as 'pchip') 'v5cubic' Cubic interpolation used in MATLAB 5 For the 'nearest', 'linear', and 'v5cubic' methods, interp1(x,Y,xi,method) tr¶ vÒ NaN cho tÊt c¶ c¸c phÇn tö cña xi mμ n»m ngoμi kho¶ng x¸c ®Þnh cña x. §èi víi tÊt c¶ c¸c ph−¬ng ph¸p, interp1 ®Ò cËp ®Õn viÖc x¸c ®Þnh d÷ liÖu(néi suy cho c¶ c¸c ®iÓm n»m ngoμi vïng cña x) n»m ngoμi ph¹m vi biÓu diÔn yi = interp1(x,Y,xi,method,'extrap') uses the specified method to perform extrapolation for out of range values. yi = interp1(x,Y,xi,method,extrapval) returns the scalar extrapval for out of range values. NaN and 0 are often used for extrapval. LÖnh interp1 néi suy gi÷a c¸c ®iÓm. Nã t×m gi¸ trÞ t¹i c¸c ®iÓm ë gi÷a c¸c ®iÓm ®· x¸c ®Þnh, cña hμm mét chiÒu(of a one-dimensional function f(x)) hμm nμy ®−îc x¸c ®Þnh d−íi d÷ liÖu cho tr−íc ( underlies the data. ) Hμm nμy ®uîc biÓu diÔn dùa trªn quan hÖ c¸c cÆp vÐc tor x,Y,xi,Yi Trang 3
- 81. Interpolation is the same operation as table lookup. Described in table lookup terms, the table is [x,Y] and interp1 looks up the elements of xi in x, and, based upon their locations, returns values yi interpolated within the elements of Y. Examples Example 1. Generate a coarse sine curve and interpolate over a finer abscissa. x = 0:10; y = sin(x); xi = 0:.25:10; yi = interp1(x,y,xi); plot(x,y,'o',xi,yi) Example 2. Here are two vectors representing the census years from 1900 to 1990 and the corresponding United States population in millions of people. t = 1900:10:1990; p = [75.995 91.972 105.711 123.203 131.669... 150.697 179.323 203.212 226.505 249.633]; The expression interp1(t,p,1975) interpolates within the census data to estimate the population in 1975. The result is ans = 214.8585 Trang 4
- 82. VÝ dô : >> x=[1 2 3 4]; >> f=[0.671 0.620 0.567 0.512]; >> interp1(x,f,1.5) ans = 0.6455 5.1.2 Néi suy cho bμi to¸n hai chiÒu Môc ®Ých cña bμi to¸n lμ: X¸c ®Þnh gi¸ trÞ f(x,y) cña mét vÞ trÝ bÊt kú trong mét mÆt ph¼ng x¸c ®Þnh (biÕt c¸c to¹ ®é vμ gi¸ trÞ c¸c ®iÓm xung quanh x(i), x(i- 1)... ) xi xi-1 yi yi-1 fe fk f(i-1,j- f(i-1,j) f(i,j- f(i,j- Muèn x¸c ®Þnh gi¸ trÞ t¹i mét ®iÓm cã vÞ trÝ xi-1<x<xi vμ yi-1<y<yi ta dïng ph−¬ng ph¸p néi suy hai chiÒu, thùc chÊt cña ph−¬ng ph¸p nμy lμ thùc hiÖn hai lÇn bμi to¸n néi suy mét chiÒu Bμi 1: Néi suy theo ph−¬ng y t×m ra fe vμ fk Bμi 2: Néi suy theo ph−¬ng x tõ fe ®Õn fk ®Ó t×m g(x,y) fe= ) , ( 1 1 ) 1 , ( 1 ); , 1 ( 1 1 ) 1 , 1 ( 1 j i f yj yj yj y j i f yj yj y yj f j i f yj yj yj y j i f yj yj y yj f − − − − + − − − − = − − − − − + − − − − − g(x,y)= f f xi xi xi x fe xi xi x xi 1 1 1 − − − − + − − − Ch−¬ng tr×nh cã thÓ ®−îc viÕt nh− sau: Quy −íc §Çu vμo lμ f=[f(1) f(2) f(3) f(4)] t−¬ng øng víi [f(i-1,j-1) f(i-1,j) f(i,j-1) f(i,j)] ; x=[ x(i-1) x(i)] function g= C5(x,y,f,xa,ya) % trong do x=[x(i-1) x(i)] y=[y(i-1) y(i)] % xa ya la to¹ ®é cña ®iÓm cÇn t×m Trang 5
- 83. % f=[f1 f2 f3 f4] lμ vÐc tor f t−¬ng øng víi f(xy) i=length(x); j=length(y); fe=(1/(y(i)-y(i-1)))*((y(j)-ya)*f(1)+(ya-y(j-1))*f(2));% tÝnh fe fk=(1/(y(i)-y(i-1)))*((y(j)-ya)*f(3)+(ya-y(j-1))*f(4));% tÝnh fk g=(1/(x(i)-x(i-1)))*((x(i)-xa)*fe+(xa-x(i-1))*fk);% tÝnh g Thùc hiÖn trong command window nh− sau >> x=[1 2 ]; >> y=[3 4]; >> f=[5 6 7 8]; >> xa=1.5,ya=3.5; >> g=C5(x,y,f,xa,ya) g = 6.5000 Cã nhiÒu c¸ch néi suy tuy nhiªn chóng ta chØ xem xÐt hai ph−¬ng ph¸p trªn mμ th«i 5.2 Gi¶i ph−¬ng tr×nh phi tuyÕn Dïng ph−¬ng ph¸p chÝ ®«i ®Ó x¸c ®Þnh nghiÖm cña ph−¬ng tr×nh Néi dung to¸n häc cña ph−¬ng ph¸p nh− sau: xÐt ph−¬ng tr×nh f(x)=0 Trªn kho¶ng ph©n ly nghiÖm [a b] , chia ®«i [a b] bëi c=(a+b)/2 NÕu f(c)=0 th× c lμ nghiÖm cña ph−¬ng tr×nh, nÕu f(c)~=0 th× so sanh dÊu cña f(c) víi f(a) vμ f(b), f(a)*f(c)<0 kho¶ng ph©n ly nghiÖm míi lμ [a c], f(c)*f(b)<0 th× kho¶ng ph©n nghiÖm lμ [c b] TiÕp tôc chia ®«i c¸c kho¶ng ph©n ly nghiÖm cho ®Õn khi t×m ®−îc gi¸ trÞ cn nμo ®ã mμ f(cn)=0 th× cn chÝnh lμ nghiÖm .Tuy nhiªn viÖc t×m chÝnh x¸c cn lμ rÊt khã kh¨n ng−êi ta chØ t×m nghiÖm gÇn ®óng trong mét sai sè cho phÐp lμ tol §å thÞ biÓu diÔn ph−¬ng ph¸p chia ®«i NÕu sai sè cho tr−íc th× sè b−íc lÆp ®ßi hái lμ (b-a)/2n <tol Trang 6