SlideShare a Scribd company logo
1 of 73
M99 EKM Masters Dissertation
Mithun Sasidharan (3986736) Page 1
TABLE OF CONTENTS
CHAPTER 1 : INTRODUCTION............................................................................................7
1.1 : Outline of Maritime Shipping.............................................................................8
1.2 : What is Dry cargo, liquid cargo and Gas cargo?.................................................9
1.2.1. Dry cargo vessels......................................................................................9
1.2.2. Liquid cargo vessels.................................................................................9
1.2.3. Gas cargo vessels......................................................................................9
1.3 : Aim / Objectives.............................................................................................9
CHAPTER 2 : OUTLINEOF ECONOMIC CRISIS................................................................10
2.1 : What is Economic crisis or ‘Financial Tsunami’?.............................................11
2.2 : Recent history of shippingbefore and after crisis............................................12
2.3 : Development of containerisation......................................................................12
CHAPTER 3 : RESEARCH METHODOLOGY.....................................................................14
3.1 : Types of research methods available....................................................................15
3.1.1. Research qualities and skills................................................................15
3.1.2. The Research process and stages.........................................................15
3.1.3. Research Methodology.........................................................................15
3.2 : Choosing the Right method for research..............................................................16
3.3 : Primary and Secondary data available..................................................................17
3.4 : Framework selected for research..........................................................................17
CHAPTER 4 : REPORT / REVIEW ........................................................................................18
4.1 : SWOT analysis of Shipping and shippinglogistics.............................................19
4.2 : ANSOFF growth matrix for maritime shippingmarket.......................................20
4.2 : How economic slowdown happen........................................................................21
4.3 : Problems to dry bulk cargo carriers......................................................................21
M99 EKM Masters Dissertation
Mithun Sasidharan (3986736) Page 2
CHAPTER 5 : LITERATUREREVIEW...............................................................................23
5.1 Effects on shipping, losses incurred and actions adopted
by the maritime industry...........................................................................24
5.2 Credit crunch effect on the seaports...................................................................33
5.3 Credit crunch effect on the Supply chain...........................................................35
5.4 PESTEL analysis of maritime supply chain.......................................................36
5.5 Credit crunch effect on the marine environment................................................37
CHAPTER 6 : CASE STUDIES............................................................................................. 40
6.1 : Case studies of MOL(Japan) ............................................................................41
6.1.1 : SWOT analysis of MitsuiO.S.K. Lines..............................................42
6.1.2 : Losses incurred by MOL....................................................................43
6.1.3 : How MOLtackled the financial crisis...............................................44
6.2 Case studies of A.P. Moller Maersk...................................................................46
6.2.1 : SWOT analysis of the company..........................................................47
6.3 Case studies of American President Lines..........................................................49
6.3.1 : SWOT analysis of the company........................................................ 50
CHAPTER 7 : DISCUSSIONS AND ANALYSIS................................................................52
7.1 : Analysis of the problem in nutshell................................................................ 52
7.2 : New Development Areas for theshipping companies to
concentrate in thefuture...........................................................................59
CHAPTER 8 : CONCLUSION..............................................................................................60
8.1 : Learning outcomes..........................................................................................60
8.2 : Lessons to be learned from the crisis for Shippers..........................................63
8.3 : Further studies.......................................... .......................................................64
CHAPTER 9 : APPENDIX.....................................................................................................65
CHAPTER 10 : REFERENCES/BIBLIOGRAPHY...............................................................68
M99 EKM Masters Dissertation
Mithun Sasidharan (3986736) Page 3
TABLE OF FIGURES
Fig. 1 SWOT Analysis...............................................................................19
Fig. 2 Ansoff’s Growth Matrix...................................................................20
Fig. 3 World sea tonnage............................................................................22
Fig. 4 U.S. Exports and Imports in the last 10 years..................................24
Fig. 5 World’s Top Ten Container Carriers and fleet composition............25
Fig.6 Growth rateof supply and demand in global container shipping......26
Fig.7 Order book of ships........................................................................... 30
Fig.8 PESTEL analysis diagram.................................................................36
Fig 9 Fleet distribution of world’s major carriers.......................................41
Fig 10 Consolidated revenue by segments in the financial year 2011........41
Fig 11 SWOT analysis of Mitsui O.S.K. Lines...........................................42
Fig. 12 MOLbusiness performance..........................................................45
Fig.13 APM group ROIC from 2005- 2011.................................................46
Fig.14 SWOT analysis of A.P. Moller Maersk............................................47
Fig.15 APLloss/profit data for 2009 and 2010............................................49
Fig.16 Average utilisation of container and its volume................................50
Fig. 17 SWOT analysis of APL (NeptuneOrient Lines)..............................50
Fig. 18 History of profits of MOL, APM and APL for the last 5 years........55
Fig. 19 MOL fleet revenue distribution........................................................ 56
Fig. 20 Maersk fleet revenue distribution..................................................... 57
Fig. 21 APL (NOL) fleet revenue distribution.............................................. 58
Fig.22 Consolidated statement of Income of MitsuiO.S.K. Lines................66
Fig 23 Consolidated financial information of A.P. Moller Maersk...............66
Fig. 24 Consolidated Income statement of A.P.L. (Neptune Orient Lines)...67
M99 EKM Masters Dissertation
Mithun Sasidharan (3986736) Page 4
Table 1 Comparison of profit and losses before and
post recession of major shippingcompanies.......................29
Table 2 Change in fleet capacity of major shippers
during the crisis period.........................................................34
Table 3 Capacity and fleet volume of strategic alliance group......................38
Table 4 Growth rate for the container sector for the period 2000 to 2009.....39
M99 EKM Masters Dissertation
Mithun Sasidharan (3986736) Page 5
ABSTRACT
This thesis reflects the severity of the financial tsunami on the maritime shipping and the supply
chain. Recession was initiated with the crashing of financial institutions in the US and spread world-
wide affecting global trend.
Every sector including Automotive and manufacturing suffered a huge loss .This affected world trade
and shipping industry faced the heat of deadline of cargo and over capacity.
Maritime companies including Mitsui O.S.K. Lines, APL (Neptune Orient Lines), Maersk, Evergreen
etc adopted strategic measures to survive and overcome the crisis and emerged as successful survi-
vors; it is obvious from the case studies of most globally leading companies that efficient implementa-
tion and rapid actions for resisting damages due to similar crisis in the near future.
M99 EKM Masters Dissertation
Mithun Sasidharan (3986736) Page 6
ACKNOWLEDGEMENT
First and foremost I thank God almighty for giving me the power for stepping strong and providing a
smooth path throughout my process.
I would like to express my deep and sincere gratitude to my supervisor Professor Raymond Jarvis for
his detailed guidance and comments and constant invaluable support throughout my work. His con-
cise ideas and concepts have made me study, reciprocate and thoroughly learn this field of academics.
I am deeply Grateful to my supervisor Professor Richard Anderson whose patience and kindness
along with his vast source of academic knowledge has been a constant source of motivation for my
thesis, and had made this as my invaluable learning experience of my Life. I wish to express my warm
and sincere thanks to Professor Owen Richards for his constant help and guidance throughout the
term.
M99 EKM Masters Dissertation
Mithun Sasidharan (3986736) Page 7
CHAPTER 1
INTRODUCTION
M99 EKM Masters Dissertation
Mithun Sasidharan (3986736) Page 8
1.1 OUTLINE OF MARITIME SHIPPING
International Maritime Shipping, known as the lifeblood of global economy, carries about 90% of
world trade. Shipping is the bulk transport of goods and raw materials, import and export of foods and
manufacturing goods and this inter-continental trade comprises of about 50,000 merchant ships and
manned by around 1.25 million seafarers. According to Jan Hoffmann (2010: 122), “Greek owned
vessel that is built in Korea may be chartered to a Danish operator who employs Filipino seafarers via
a Cypriot crewing agent. The ship is registered in Panama, insured in the United Kingdom and trans-
ports German made cargo in the name of a Swiss freight forwarder from a Dutch port to Argentina,
through terminals that are concessioned to operators from Hong Kong and Dubai. On its journey the
vessels may have repairs done in a Portuguese yard, a bunker fuel in Spain and tranship containers- to
be reloaded on a different ship in a different destination in Brazil”. The merchant ships are high val-
ued technically sophisticated assets and ever since the world trade is growing internationally, the safe
operation and reliability of ships became vital. For these governing bodies were formed with stringent
rules and regulations being introduced and the major body being International Maritime Organisation
or The IMO based in London. The world trade keeps growing continuously and hence shipping indus-
try have to respond to its demand for its service. The various different types of ships that carry the
varieties of cargo round the globe are as follows:
1. Bulk carriers, which transport food materials, raw materials like iron ore and coal, are identifiable
by the hatches raised above the deck level that covers the cargo holds. These types of vessels are
known as the work horses of the fleet and the large bulk carriers can carry and transport enough grain
to feed approximately four million people for one month.
2. Container ships which carry a huge volume of world’s manufactured goods and finished products
and these are usually on scheduled liner services. The recent times latest container vessels can ac-
commodate volumes equivalent of 10000 heavy trucks.
3. Tankers are merchant vessels transporting oil, chemicals and other petroleum products and larger
tanker ships can even carry over 300,000 tonnes of oil.
4. Passenger ships or Ferries and the luxury cruise ships usually perform shorter journeys for a mix of
passengers, cars and other commercial vehicle.
5. Other categories of ships include roll on roll off, pure car carriers, gas carriers, heavy lift vessels,
ships for supporting the off shore oil industry and other general cargo ships (International Chamber of
Shipping 2008).
Outline of maritime shipping supply chain
For any global company, to reach its products to destination is depended directly on the supply chain
of the maritime transport being utilised for the trade. Mak and Ramaprasad (2003) cited by Caragin
Andreea Raluca, Paraschiv Dorel Mihai, Voicu-Dorobantu Roxana (2010) considers supply chain
management as “a set of approaches utilized to efficiently integrate suppliers, manufacturers, ware-
houses, and stores, so that merchandise is produced and distributed at the right quantities, to the right
locations, and at the right time, in order to minimize system-wide costs while satisfying service level
requirements”. For each shipping company, its supply chain is of vital importance in terms of busi-
ness, market competition, and trade performance and in terms of revenue (Raluca et al 2010: 83).
M99 EKM Masters Dissertation
Mithun Sasidharan (3986736) Page 9
1.2 WHAT ARE DRY CARGO VESSSELS, TANK VESSELS AND GAS CARRIER VES-
SELS?
1.2.1 Dry Cargo carriers: The dry cargo vessels often have huge hatches or covers which secure the
holds containing cargo and keep them dry. The dry cargo vessels normally transports dry bulk which
includes grains, ores, coal, fodder etc, or break bulk in their large cargo holds. These types of vessels
are extremely versatile and have numerous possibilities for transportation mainly as that of inland
vessels.
1.2.2 Liquid Cargo Carriers: Liquids, mostly diesel, petrol, petroleum distillates or edible oils etc are
transported in special types of vessels with double hull protective design. Since about 80% of world’s
hazardous materials are transported by ships using liquid cargo carriers which are safer than other
means of road or railways, these vessels have to meet stringent regulations and requirements like dou-
ble hull testing in practice to prevent leakage of hazardous cargo in the extreme case of any collision
event. Normal type liquid carriers are the traditional tank ships which transports petroleum products
and other liquid cargo. Chemical carriers with high safety standards have stainless steel storage tanks
to carry hazardous chemicals such as hydrochloric acids, phenols etc. Some chemical tankers have
tanks with protective coating for dangerous chemicals like benzene, naphthalene etc. These types also
have double hulls for safety reasons.
1.2.3 Gas Cargo Carriers: The gas cargo carriers or gas tankers are extremely strong and the safest
mode of transporting gases for years. Since these gases are dangerous and have the property of be-
coming to liquid state when transported under pressure, these carriers have circular shapes with triple
hull (Bureau Voorlichting Binnervaart 2012).
1.3 AIMS / OBJECTIVES
 To understand what maritime shipping is all about and study the type of ships or cargo carri-
ers based on different categories of structure and the cargo it transports.
 To identify and collect vital information regarding financial crisis and its impacts on the mari-
time shipping logistics.
 To demonstrate the effects the shipping companies round the world faced during the crisis es-
pecially with regards to dry cargo carriers.
 To understand the strategies followed by maritime shipping companies during recession.
 To identify, study and understand from the case studies of the maritime shipping companies
from Asia, Europe and America, the actions and policies adopted to respond to the crisis situ-
ation and how did they implement it.
 To conduct SWOT/ PESTEL analysis of these shipping companies to withstand the situation.
 To investigate the loss incurred and the corrective actions adopted by the companies to tackle
the global recession mostly with regards to the bulk carriers which had the greatest effect, in-
cluding the lay-offs and ballast voyages.
 To research the background of financial crisis in a global perspective and its impacts on the
financial and business organisations.
M99 EKM Masters Dissertation
Mithun Sasidharan (3986736) Page 10
CHAPTER 2
OUTLINE OF ECONOMIC CRISIS
M99 EKM Masters Dissertation
Mithun Sasidharan (3986736) Page 11
2.1 WHAT IS ECONOMIC CRISIS OR ‘FINANCIAL TSUNAMI’?
According to De Bonis, Definition of financial crisis is “A wider range of disturbances, such as sharp
declines in asset prices, failure of large financial intermediaries or disruption in foreign exchange
markets”. In a financial downturn, the affected nation will have serious impact on its real economy
and also adverse affects on employment, purchasing and production capacity with major firms unable
to meet their financial obligations. Political uncertainty further worsens the economic situations in
certain countries. The recent global economic turmoil of 2008-09 has a lot of common patterns with
those in the past including Great Depression and other similar banking crisis. The downturn in finan-
cial sector normally leads to complex conditions of decline in the GDP of the country, decline in the
asset prices and affect in the unemployment rates. The current crisis, according to experts, is a trough
in the global economy and market after the big ‘boom phase’ that extended from early 1980s to 2006.
The boom during this period was mainly due to the development and advancement in Information
technology, processing and manufacturing technology and deregulations of developed nation’s finan-
cial markets. Fundamental changes in the social, technical and financial rules were the driving force
for the boom phase which led to globalisation. The end of this ‘boom phase’ and the start of the cur-
rent crisis phase known as ‘bust phase’ began with the financial institutions in the US failing to meet
its obligations and this then globally spread which lead to the global financial crisis ( Roy E Allen
2009). The global financial crisis and economic downfall started with the bankruptcy of one of the
powerful financial players of Wall Street, USA, the Lehman Brothers Investment Bank and security
firm in the United States. Very influential and inevitable financial turmoil or ‘tsunami’ had started
since then and world economy experienced critical downturn.
Major international financial markets were affected due to the chain reactions induced by the above
scenario of US bankruptcy. The global trade were tumbled; financial companies suffered and many
were squashed, stock prices around the globe got affected critically (Ho, Choy, Chung and Lam
2010). The freezing of credit markets in the Wall street USA had ultimately led to global financial
crisis and reflected in the failure of banks/ financial institutions, declining of currencies and crashes in
the stock markets worldwide and also resulted in unemployment whose rate climbed up by 10% com-
pared to the previous term.
The financial tsunami in the emerging markets have proved that investor’s confidence is very much
subject to change at such short span and can deteriorate which leads to adverse market conditions and
capital flow (Ghosh 2001). The crisis caused due to misjudgement of conditions of emerging market’s
economy by investors and other related bodies concerned had lack of transparency as one of the main
cause for the market instability in those sectors. Good governance and increased transparency would
reduce the imbalances in nation’s economy and financial instability. Since the nations who suffered
the turmoil had a huge financial assistance from international community like IMF, this forced them
to raise the need to seek the assistance of the private sectors in the country for resolving the crisis and
indulge in common investment issues (Monti 2001).
M99 EKM Masters Dissertation
Mithun Sasidharan (3986736) Page 12
2.2 RECENT HISTORY OF SHIPPING BEFORE AND AFTER CRISIS
Maritime shipping industry witnessed a slump in global trade which led to difficult credit conditions,
declining shipping rates and also defaulting customers. The shipping companies had to take actions
for cost cutting and layoff of merchant ships with focussing more on consolidation. Global recession
affected the dry bulk cargo the most with major companies forcing to lay off their bulk carriers, con-
tainer ships and car carrier ships for months due to trade crisis. The barometer of shipping cost known
as BDI (Baltic Dry Index) fell by 93.4% in 2008 end and global container volume growth percentage
fell from 7.2% in 2008 to 2.8% in 2009. Container shipping demand also fell decreasing the freight
rates and volume. World’s largest container shipping company Maersk experienced a reduction in
shipping volume by 20% in 2009 compared to 2008. The voyage routes from Asia to US and Europe
which accounts for almost 50% of the container trade are facing the heat of crisis impact. Major dry
bulk cargo market, China is facing the worst performance ever. Payment stability and healthy cash
flow are impacted due to financial crisis. These ultimately may lead to lower revenue realisation and
increase in risk of customer default on payment. Major Japanese shipping firms like MOL, NYK and
K Lines have had major impact due to low shipping rates caused due to crisis and hence were forced
to revise their profit guidance. Major Asian shipping companies have tendency to keep little cash re-
serves and to allot high risk contracts which have resulted them in having most significantly affected
sector. Since the demand of the shipping trade were increasing before crisis began, majority compa-
nies had a rapid fleet expansion with new vessels which, during crisis have led to excess capacity due
to reduced trade. Major shipping companies around the world including Mitsui O.S.K. Lines, NOL,
and Hapag Lloyd etc have looked into corrective actions to address the crisis by forming alliances and
merging their individual services in order to cut the capacity and hence reduce the annual cost of la-
bour. Companies have taken decision to lay off some of their vessels especially dry cargo vessels and
some others running the vessels on slow steaming basis for economic reason of fuel consumption
(Steel 2009).
2.3 DEVELOPMENT OF CONTAINERISATION
A container basically is a tank / case with sufficient strength for repeated transport of materials
stuffed, de-stuffed or transhipped. The term containerisation, which has revolutionised the global
transport of trading goods and commodities, is an increasing / developing trend in the global interna-
tional trade. The maritime shipping industry around the world have accepted that containerisation is a
major criteria for the future development of shipping trade and hence all trading ports around the
world are developing to adjust and cope with the high progress rate(Sople 2007). The container trade
has been one of the major portions of shipping since years and average growth rate has been increas-
ing especially due to the increase in trade in Asian countries of China, Korea, Japan etc and also Latin
American countries. Containers were compared on the measure of twenty foot equivalent unit or TEU
and companies including A P Moller Maersk, Mitsui O.S.K. Lines, MSC, P&O NC Hangin, Ever-
green, CMA CGM, Hyundai etc have vessels which carry 6000- 9000 TEUs and even bigger capacity
vessels are under construction based on the order. In order to accommodate huge ships of this capaci-
ty, the respective shipping ports also had to undergo huge expansion with greater productivity. Ports
of Singapore, Hongkong etc have very huge capacity and many ports around the world are expanding
at greater rates. The variation in container apart from the size factor are simple box type with end
doors, box type insulated containers and reefer containers which posses temperature controlled heat-
ing/ cooling arrangement (Sudalaimuthu, Raj 2009). A major area of tension was the unavailability of
shipping containers during the stronger than expected financial recession recovery period. One of the
M99 EKM Masters Dissertation
Mithun Sasidharan (3986736) Page 13
main causes for this was the halt in the container manufacturing plant during the crisis period and the
decision of many companies to scrap their old ships which were in business for quite a long period.
Major common issue for the exporters were in securing empty containers and the problem of equip-
ment dislocation. It is learned that the outbound is affected mainly by the issue of location and not by
that of the shortage. The container volume at all the US ports in the west coast in 2010 increased by
13% over the previous years but still remains lower than the figure in the year 2008 where there was
no shortage of containers. One major possible factor for this is the shutdown of container manufactur-
ing industries. This actually created adverse effects on the shippers and even the manufacturers in the
year 2009 when the trade showed a sudden improvement / surge. The operation strategy adopted by
major shipping companies of slow steaming or extra slow-steaming aggravated the shortage (Mon-
gelluzzo 2010:53).
M99 EKM Masters Dissertation
Mithun Sasidharan (3986736) Page 14
CHAPTER 3
RESEARCH METHODOLOGY
M99 EKM Masters Dissertation
Mithun Sasidharan (3986736) Page 15
3.1 TYPES OF RESEARCH METHODS AVAILABLE
Research is a systematic and methodical process of enquiry and investigation of a certain specific
chosen topic of researcher’s area of interest that also increases knowledge and develops qualities and
skills of the researcher to communicate the understanding of the research area.
3.1.1 Research qualities and skills
3.1.2 The Research process and stages
The fundamental stages in the research processes common to all types of research are as follows:
1. To identify the topic for research.
2. To define the research problem.
3. To identify the way research is to be conducted.
4. To collect the information and data required.
5. To analyse and interpret the information/ data collected and recommend researcher’s views.
6. Finally to write the dissertation in the format decided and to get the approval.
3.1.3 Research Methodology
The main different types of researches classified on the basis of the purpose of the research are Ex-
planatory research, Descriptive research, Analytical and Predictive research and also Quantitative and
Qualitative research. Explanatory research: Explanatory research is carried out when the research
problem being considered doesn’t have any earlier studies to which researcher can refer to, for infor-
mational materials about the issue to be discussed. The main objective of this type is to look for pat-
terns or hypothesis and not to confirm a hypothesis. The focus of explanatory research is to gain the
insight and familiarity with the topic for further investigation deep into it at a later stage. Explanatory
PERSEVERANCE
IT SKILLS
INTELLECTUAL
SKILLS
INDEPENDENCE
MOTIVATION
ORGANISATIONAL
SKILLS
COMMUNICATION
SKILLS
M99 EKM Masters Dissertation
Mithun Sasidharan (3986736) Page 16
research includes flexible techniques like case studies, historical analysis and observations which can
be useful in giving both qualitative and quantitative details. The research assesses whether new theo-
ries should be developed or whether the existing theories and concepts can actually be applied to the
problem. This method concentrates on collection of wide range of impressions and data. Descriptive
research: Descriptive research describes the phenomenon as they exist. This normally is used to ob-
tain required information on the characteristics of an issue. Descriptive research follows a quantitative
collection of data and goes further to examine a particular problem as it is used to describe the charac-
teristics of the issue concerned in the problem being considered. According to Collis and Hussey
(1997), Analytical or Explanatory Research: In this case, the researcher analyses and explains why
or how the characteristics of research is happening and aims to realise the phenomena by measuring
and finding out the reasons for such happening and to find out the questions whose answers can be the
solutions to the issues. Major element of explanatory research is to control the variable of research
activity to identify critical ones. Predictive Research: Predictive research goes further than the de-
scriptive research and even further than the explanatory type. Here this forecasts the likelihood of
happening of the same type of events or situations which can or which are occurring elsewhere and
focus on generalising the causal link by predicting certain happenings and its phenomenon from cer-
tain hypothesis and general relationships. This type of research provides the answers for ‘how’, ‘why’
and ‘where’ to the present events also for similar events in the future. Quantitative and Qualitative
Research: Quantitative and Qualitative research are differentiated on the basis of the approach
adopted by the researcher. Quantitative research involves the collection and analysis of numerical data
and even statistical tests and concentrates on measuring the phenomenon. This is objective in nature.
Qualitative research includes the examination and reflection of perceptions to gain and understand the
social and human activities. This is subjective in nature. Applied and Basic Research: Applied re-
search is designated to apply the findings from it to solve specific, existing issue being considered
where as on the other hand basic research is the pure or fundamental form of research (Collis, Hussey
1997).
3.2 CHOOSING THE RIGHT METHODFOR RESEARCH
Methodology is related to the overall approach that researcher takes towards a research process from
theoretical concepts about it and also analysis of the data collected. The methodology to be considered
in the research is concerned with many factors like:
- What are the data collected
- Why are certain data collected
- Where is the data origin
- When is the data collected
- How has been the data obtained
- How is the data being analysed
Research paradigm describes the scientific practice and philosophies of how research should be con-
ducted. The two major research paradigms are Positivistic paradigm and Phenomenological paradigm.
Positivistic approach looks into the fact or causes of social phenomenon with having little concern to
the subjective state, whereas phenomenological paradigm relates to the understanding of human be-
haviour from the participants’ own frame of reference. Result of criticisms of positivistic paradigm
leads to phenomenological paradigm. Choosing a research methodology concentrate also on type data,
location, reliability, validity and generalisability of the data collected. Deciding on which methodolo-
gy to be used is depended on the choice the researcher have and its limitation by the number of fac-
tors. It starts by considering researcher’s constrains regarding research problem and also the paradigm
M99 EKM Masters Dissertation
Mithun Sasidharan (3986736) Page 17
issue. Methodologies related to research paradigm are associated with positivistic or phenomenologi-
cal types and even the decision to mix both the methodologies (Collis, Hussey 1997).
3.3 PRIMARY AND SECONDARY DATA AVAILABLE
Primary data is the original data collected by the person actually doing the research. It is the original
data that is collected at the source like the survey data obtained through questionnaires or observations
and experimental data gathered by making experiments in a controlled situation. On the other hand,
the Secondary data is that information collected from already existing sources from books, document,
published statistics and reports, company accounts and personal internal records of organisations.
3.4 FRAMEWORK SELECTED FOR RESEARCH
Chapter 1: This gives an introduction of maritime shipping industry and provides an outline of dif-
ferent categories of cargo vessels mainly dry cargo ships, liquid cargo ships and gas carrier vessels.
This section also focuses on the main aims and objectives of the research topic being considered.
Chapter 2: Outline of economic crisis provides the in depth knowledge of what exactly is economic
crisis and the history of maritime shipping before and after the crisis and a look into the development
of containerisation.
Chapter 3: Research Methodology gives a knowledge regarding the types of research methods avail-
able and factors to consider in choosing the right method among the above types. This also provides
the primary and secondary data available and describes the frame work selected for the thesis.
Chapter 4: This chapter gives the report which includes the swot analysis of maritime shipping logis-
tics in relation to recession and also gives the main reason for the cause of economic crisis and how
shipping field especially dry bulk carrier cargo was affected with the same.
Chapter 5: This section deals with the literature review of the report. According to ‘Gill and Johnson’
(1991: 21), critical review of literature ‘should provide the read with a statement of the state of the art
and major questions and issues in the field under consideration’. The review includes the effect of
financial recession on the maritime shipping and the loss or problems the companies faced due to the
crisis and the counter policies and actions adopted by them.
Chapter 6: This particular chapter considers the case studies of three major shipping companies
around the world. Mitsui O.S.K. Lines is a Japanese shipping company which had to face a great
problem during the crisis and they had taken vital steps in tackling the issue and maintaining their
business in world trade. European and American shipping business is also looked into and considered
for investigation for the same.
Chapter 7: Critical analysis of the recession effect on maritime shipping as a whole is considered
from the literature review and the case studies investigated.
Chapter 8: This chapter deals with the major learning outcomes from the thesis and the areas for fur-
ther research which can be considered.
Chapter 9: The final chapter consists of references and appendix used for the research.
M99 EKM Masters Dissertation
Mithun Sasidharan (3986736) Page 18
CHAPTER 4
REPORT/ REVIEW
M99 EKM Masters Dissertation
Mithun Sasidharan (3986736) Page 19
4.1 SWOT ANALYSIS OF SHIPPING AND SHIPPING LOGISTICS
SWOT analysis is a strategic tool to categorically identify and then use it to approach for analysing
internal and external organisational environment. It is a strategic framework and is a specific planning
tool in understanding any company’s potential areas of strength and weaknesses. Controllable Internal
factors are strengths and weaknesses and uncontrollable external elements comprises of opportunities
and threats. The proper evaluation and utilisation of SWOT analysis is very vital for any firm
for its strategy to be successfully implemented (Chermack, Kasshanna 2007: 383).
Fig. 1 SWOT Analysis
Various shipping companies around the world have identified the strength, weakness, opportunities
and threats in their industry by conducting SWOT analysis techniques and this enabled them to adopt
necessary measures for dealing with each situation and have been classified in common, below under
respective category:
Strength: Shipping is the most common form of world trade and a major portion of world trade is
carried out using merchant ships. The location of ports in major continents as in China, Singapore,
South and North America, and the European nations are highly suitable for the easy transfer of raw
materials, oil and other finished products. Countries like Japan, China and US have trade with the
shipping industry giants of Maersk, CMA-CGM, NYK, APL, K Lines, and NOL etc. The investment
by the Chinese steel industry has boosted the trade between the raw material, iron ore exporting na-
tions and the Asian power house. This has developed the shipping logistics sector extensively. The
fast and powerful recovery from the 2008-09 financial recessions by the powerful economies of the
world has also assisted in the improvement of shipping sector. Even though most of the European na-
tions are yet to recover from the crisis, the nations including China, Brazil, India and even Japan have
showed a quick recovery and these nations have a leading role in the shipping logistics sector and in-
ternational trade. Weakness: The effect of economic downturn has led most companies to lay off
their vessels which are mostly dry cargo types including car carriers, bulk carrier vessels and also con-
tainer ships. This was mainly due to the impact of crisis on the global automobile sector and bulk car-
go sector and has resulted in adverse effect on the marine employees. The congestion occurring in the
major ports which trade raw materials like iron ore and coal have also had its negative impact on
shipping and shipping logistics. Opportunities: The post recession recovery particularly in the Asian
industries have given a good scope for the shipping sector and its logistics to compensate for the loss-
STRENGTH WEAKNESS
OPPORTUNITIES THREATS
M99 EKM Masters Dissertation
Mithun Sasidharan (3986736) Page 20
es incurred and move forward with the new trade routes in the future. The LNG trade is too on the rise
and is a boon to the shipping sector. Countries like China, Brazil etc have a faster growing economy
and the improving relationship between these trading nations are helping the shipping industry to
achieve new heights after the big dip during the recession. Threats: With the opportunities comes the
threat for the marine shipping industry. The nations of USA and Europe are still weak in recovering
from the downturn and together with the currency crisis and issues are posing a hindrance to the fast
growth of shipping trade. The political crisis in the oil rich Middle East, the natural calamities like
earthquakes and tsunamis and the rising piracy attack trouble are still the biggest threats to the ship-
ping and shipping logistics.
4.2 ANSOFF’S GROWTH MATRIX OF MARITIME SHIPPING MARKET
Ansoff Matrix is used by any organisation to developed specified strategies considering its product –
market options in order to achieve new growth heights. This is achieved after studying the matrix and
understanding the opportunities based on existing and new markets/ products in the future (Richard-
son 2007).
EXISTING PRODUCT NEW PRODUCT
EXISTING MARKET Market Penetration Product Development
NEW MARKET Market Development Diversification
Fig. 2 Ansoff’s Growth Matrix
Market Penetration (Existing products into Existing Market): It is studied that 80% of the compa-
ny’s profits are generated from 20% of its customers and hence it is very essential to retain the exist-
ing customers particularly when the market faces adversity or crisis. The importance of relationship
and mutual understanding between the customers, business partners and suppliers is being realised by
the company.
Market Development (Existing product into New Market): Companies try hard for keeping their
business intact and to maintain market position particularly during crisis when the shipping trade is
stagnant. The main advantage of the company entering new markets with existing products is that it
offers opportunity to make more profits and market share.
Product Development (New Products into Existing Market): Development of product and related
innovations is vital for the companies to stay competitive in the fluctuating market. Importance of
market segmentation is required even though it might costs more and might take more time.
Diversification (New Products into New Markets): The process of diversification can be highly risky,
mainly during the time of financial slowdown but it provides better opportunities for new business.
This normally takes place by the process of merging and acquisition of companies like that of NOL
took over the control of APL (Cupman 2009).
M99 EKM Masters Dissertation
Mithun Sasidharan (3986736) Page 21
4.3 HOW ECONOMIC SLOWDOWN HAPPENED?
In the late 90s, major Asian economies, South Korea, Singapore, Indonesia, Thailand, and Hongkong
etc experienced crash in their stock market and suffered great strains for banks and other financial
intermediaries. This situation of serious economic crisis or recession caused their GDP to fall and
their currencies to get plunged. Unlike the other South American countries, which experienced similar
situation earlier where the government expenditure were not able to compensate with very low taxes,
the Asian countries had financial systems which were bank based that had very little transparency.
Allen and Gale (2007) considers that, in the past there were stock market crashes in 1929, banking
crisis in the year 1930, recession in Brazil and Mexico in 1962, Great Depression, crisis in US in the
last half of 19th
century etc. Many economies and respective government adopted necessary actions
that controlled the cause of recession mainly during 1945- 1971. Bank of England developed and
adopted effective stabilisation policies which helped them to ensure economic stability. France also
didn’t experience financial downturn from 1882 till 1924. In the US, First bank of United States and
the second bank of US were formed and these federally chartered financial banks had branches all
around US which played a major step to tackle crisis but later on troubles from within these institu-
tions created smoke of crisis in the US. In banking, the investors really worry regarding soundness of
the financial institutions where they have invested their funds and when in panic, they withdraw the
funds and hold it within themselves in the form of liquid currencies. Seriousness of the crisis is de-
pended on the currency/ deposit ratio. Since major banks hold liquid cash reserves in the form of cur-
rencies, they had huge reserves as deposits in other banks for the sake of interests they receive. The
banks could pay these interests as they lent the currencies received, as ‘call loans’ in the stock market
to buy stocks on margin. Hence it is obvious that there is a link between panic in financial institutions
or banks and stock market crashes (Allen and Gale 2007).
The occurrence of both banking crisis and currency crisis together known to be as ‘Twin Crisis’
which frequently occurred when commitment to the gold standard had gone weak at earlier stage.
Later fixed exchange rate system and strong banking regulations were introduced. Major cause of ear-
lier crisis in the 1930s is believed to be as a result of market, which was considered as the problem
and regulatory steps adopted by respective government were the solution. Conversely at present situa-
tion, it is believed that inefficient macroeconomic policies adopted by inconsistent government in the
financial system is the major cause for recession and market forces emerge as the solutions (Allen and
Gale 2007).
4.4 PROBLEMS TO DRY BULK CARGO CARRIERS
The maritime trade between trading nations around the globe had a great impact due to the drastic
change in the economic outlook. This had a very major effect on the dry bulk cargo sector which
transported a major percentage of trading commodities with more than 60% of the world bulk traffic
trade done by the capsize vessels of 100,000 DWT and more. One of the major business sectors was
the import of iron ore from Australia and South America to China for its steel industries. The Lon-
don’s Baltic Dry Index, key element that measures shipping commodity trade by bulk carriers re-
vealed the effect that the recession had on the world trade particularly the Chinese steel industry and
hence bulk carrier trade. According to the Michael Broad, President of Shipping Federation of Cana-
da, “Like everywhere else, we have experienced a steep decline of dry bulk and break-bulk cargo in
all trades due to the global financial / economic crisis. In the last quarter of 2008, we estimate the ton-
nage figures of various commodities were down between 10% and 25% at Canada’s main ports”. The
overall dry bulk cargo trade in Vancouver declined by 9% during the recession time. Even the other
sector of dry cargo fleet that includes project cargo and heavy lift cargo which seemed unaffected had
M99 EKM Masters Dissertation
Mithun Sasidharan (3986736) Page 22
also shown signs of softening in their demand. Global leading nations have released massive econom-
ic stimulus packages in the hope of improving global cargo demand and hence trade. The sector of
bulk carriers had faced the extreme heat of recession in years 2008-09 and in the early months of
2010. Drop in the dry cargo vessel rates affected the employees of maritime shipping and the business
profit of major shipping companies. The financial crisis and turmoil had resulted in worsening the dry
bulk cargo trade but yet another adverse factor for this sector was the over capacity especially in the
dry bulk sector of iron ore and coal trade mainly due to the huge overhang of new ships on order dur-
ing the previous years. (Ryan 2009).
Fig. 3 World sea tonnage
(UNCTAD cited in The Economist 2010).
The global financial slowdown continued to affect the performance of many ports around the world
during the crisis period of 2008-09. In the particular case of Canadian port of Quebec, the percentage
of total trade traffic was reduced by 21% in 2009 in comparison to its previous year. The main reason
for this cause was presumed to be the drop in dry bulk volumes of iron ore, coal etc. Most steel indus-
tries in the US and China, which were the main importers of iron ore were working at lower produc-
tion capacity (Canadian sailing 2010).
According to Jan Beringer, president and
CEO of Rohde & Liesenfield Canada, “the
current shipping market is one of uncer-
tainty and that has created a dramatic
downturn in freight rates, most predomi-
nantly in the bulk trades, but even now in
the project cargo sector.” The world sea
trade reduced by 4.5% in the crisis period
but the merchant fleet volume rose by 7%
which created over capacity, decline in
demand of vessels even during the period
of recovery and extra pressure on freight
rates and marine companies’ business prof-
it (The Economist 2010).
M99 EKM Masters Dissertation
Mithun Sasidharan (3986736) Page 23
CHAPTER 5
LITERATURE REVIEW
M99 EKM Masters Dissertation
Mithun Sasidharan (3986736) Page 24
5.1 Effects on shipping, losses incurred and actions adopted by the maritime industry
The world economy witnesses its largest fall of 6% in the global growth during the crisis period of
2008-2009 during when the financial downturn was started in the financial centres of advanced econ-
omies and then spread to other nations around the world. This also involves the decline in stock mar-
kets, decline in credits and currencies and even decline in the employment rates. The impact of crisis
in the dimension of Economy of each country can be viewed as the difference that has occurred in the
GDP of each country from its peak to that dip during the recession. The impact on financial markets
of each affected country can be viewed or measured by the difference in its stock market index during
the turmoil which will also be reflected in the flow of capital and the collapse occurred in the credit
growth (Llaudes, Salman and Chivakul 2010). Major Asian emerging economies of India, China and
Indonesia reacted to the financial crisis situation effectively and they tackled it to avoid the danger of
recession and to an extent succeeded in dealing with it. The US and Europe were adversely affected
with US economy and employment falling considerably and European economy worsening due to the
downturn and still in crisis. Even though Asian countries were less affected, Indian GDP fell to 5.3
from near double digits and China’s GDP, which always maintained double digit import and export
rates dipped to about 6%. The main issue in this period was the effect this had on the European and
US trade mainly from the China’s decline in market that caused fall in the trade of East West and Intra
Asian region with the increase in oil price hike making the problem worse. The exports from the
Asian countries to US and Europe which were 34% in 2006 dipped to a low of 28.7%. This was main-
ly due to the worsening of economies of US and Europe with slow rate of recovery and also the free
trade agreement and formation of association (ASEAN) among the Asian economies (King 2012: 20).
Fig. 4 U.S. Exports and Imports in the last 10 years (U.S. Census Bureau cited in King 2012: 20)
In the year 2008, when the prices of crude oil dipped from $147 a barrel to $60, the shipping compa-
nies were not able to make the most of the situation as a reason of the economic recession which con-
tinued till 2009-10. Much of the gain that would have been utilised by the maritime companies in
terms of slashed oil prices went in vain by the lowering of shipping freight volume caused due to re-
duced trade, which first started only in the world automotive sector and then gradually spread to other
M99 EKM Masters Dissertation
Mithun Sasidharan (3986736) Page 25
cargo commodity sectors. As a result of the global credit crunch and hence fall in shipment, leading
maritime companies like A.P. Moller Maersk, Giant Alliance of MOL, APL and Hyundai reduced the
freight volume/ capacity. Maersk even suspended one of the Asia Europe marine service, MOL took
decision of lay down of some of its dry cargo fleet vessels. In short, the maritime shipping companies
could not take the advantage created by the reduction in fuel or oil barrel price, as this decline hap-
pened much faster than the market recovery (Hoffman and Gallagher, 2008). The vessels due to get
delivered in the year 2008-’09 were getting delayed, the situation being more critical in the Europe-
Asia trade route where the freight rates are lowered in comparison to the African, South American and
also trans Atlantic routes. The post recession periods in the year 2010, when a lot of shipping compa-
nies have recovered from the downturn or are in the path, have witnessed some industry giants being
ready to afford to wait out the challenging situation on the Asia – Europe route, and Maersk even or-
dered for ten new 18,000 TEU ships, Hanjin ordering five 13,000 TEUs, CMA-CGM of France for
three 16,000 TEU vessels and Mediterranean shipping ordering for larger ships of 14,000 TEUs and
more (Barnard 2011: 41).
Fig. 5 World’s Top Ten Container Carriers and fleet composition
[As of June, 2012] (Barnard 2011: 42)
Carriers particularly in the Asia-Europe trade route increased the freight rates for maintaining capacity
cuts and during the peak season after the crisis recovery specifically the spot rates for the 20- foot
containers increased three folds from $500 to $2000 on certain specific trade routes. But the introduc-
tion of huge vessels by the industry giants of carriers of more than 16000 TEUs actually increased the
pressure on them as the trade witnessed a downward decline mainly due to the European crisis and the
slowing economy in China, which is a major source of imports and exports as shipping industry at
present is concerned, together with the increase in the bunker prices. The trade from China to Europe
fell by 2%, Japan’s and S. Korea’s export by 9.4% and 17.7% respectively. At the same time trade to
U.S. from China’s export grew up by 12.8% and also Japan and Korean export saw new heights. With
the expected delivery of mega capacity ships for many of the ocean carrier companies, things have
gone worse in terms of maintaining capacity. All the negative ramifications caused due to recession in
the global industry, China’s slow economic growth and financial trouble in the U.S. created signifi-
cant adverse affects on the shipping companies/ carriers (Bernard 2012).
M99 EKM Masters Dissertation
Mithun Sasidharan (3986736) Page 26
The world GDP declined by 1% during the financial crisis of 2007-10 and trade volume by 25% in a
single year. Most ship owners have suffered from diminishing profits, the ordering of new ships have
been stopped and many vessels have been running on slow steaming and many laid off. The causes of
recession mainly are reduction in demand in the industry for services due to poor economic growth
and also trade volume together with the imbalance created between the supply and demand due to the
sudden dip in the demand side which then led to overcapacity. This unavailability of trade financing
during the recession is considered by many experts as the main reason for quick spread of the crisis in
the global maritime industry. Even with the economic downturn and financial crashes in the global
economy, maritime transportation accounts for a huge part of International trade with newer ports be-
ing developed in emerging economies to join the maritime logistic network worldwide and increase in
size of the vessel and fleet. Major problems caused during recession were that of overcapacity, supply
of tonnage, demand drop and dip in the freight rates. The world container ship fleet expanded during
the recession period. The liner market, Mearsk, MSC, CMA CGM, MOL, NYK and K Lines in par-
ticular, developed during the period from 2000 to 2010 even though recession had its effects on them.
Even later this period saw the increase in size of the liner ship which can be cost saving in terms of
economies of scale. This in turn led to the development of existing hub and port to accommodate
higher volume and larger size vessels (Chew et al 2011).
Fig.6 Growth rate of supply and demand in global container shipping (Chew E.P. et al 2011)
The impact of recession in the global car making automotive industry is high in the developed coun-
tries. It is learned that there was a severe shortage in the capacity of car carriers due to insufficient
orders in the past, the main reason for this being the failure of forecasting and anticipating the rapid
growth of the market that occurred in the post recession recovery period. The Japanese manufactures
increased their production and export of cars mainly to Middle East. The volume of cars shipped
worldwide witnessed a huge hike from 7.5 million cars a year in 1980 to almost 16 million in 2008.
But the industry was not able to forecast the magnitude of this huge growth. It is seen that shortfall of
10% of cars a year means that 1.5 million cars were not shipped. Downturn in the US automotive sec-
tor and also slow recovery in the European economy increased the imbalance between the demand
and the capacity or volume transhipped. Even though the demand for the car carrier sector are increas-
ing at a very high rate, the decision for shipping companies to order for newer ships is clouded, for the
reason being the uncertainty among the car manufactures and shipping companies of what lies ahead
M99 EKM Masters Dissertation
Mithun Sasidharan (3986736) Page 27
and also due to the economy of car carrier sector. The current economic recession and recovery, fluc-
tuating oil prices and exchange rates have had a great impact on the automotive manufactures’ future
production level and location of production plants to make it more responsive to customer demands.
The loss of capacity due to fall in trade made the shippers to decide to run their vessel on slow steam-
ing which actually reduces bunker costs and is more economical and also have the added advantage of
reducing harmful emissions to environment. Capacity of car carrier market increased from 15.2 mil-
lion in 2008 to 17.5 million in 2010. Besides the higher cost of manufacturing car carrier vessels in
order to meet the high demand in tonnage and to meet the balance between supply and demand, it
takes nearly 3-4 years for the manufacture of a new vessel from the date of order till the delivery to
take place to the customer, i.e. to get delivery of 10 ships, the ship owners have to wait for about 4
years. In short, the increase in cost of ship manufacturing due to increased raw materials and steel
prices, together with the uncertainty of the cargo within this 3-4 years of production particularly with
regards to car carriers due to the change in customers’ preference for type of cars, would add to the
present crisis situation (Thomas 2008: 48). The period prior to the recession had witnessed a boom in
the car carrier sector with industry facing shortage of capacity for a higher demand which made the
shippers to order for larger ships capable of carrying of about 8000 cars which when got delivered in
the recession period created additional problems during this time for the shippers. The vehicle trans-
portation had boomed for decades prior to the financial downturn that had a greater adverse impact in
this sector. The volume of global sea trade had grown by about 9.7% a year during the boom phase
before 2008 when it got halted by the crisis. Together with the car carriers, the ro-ro (roll on – roll off)
sector too were affected badly due to crisis as the construction , manufacturing, agricultural and
transportation equipments like tractors, bulldozers, railcars etc witnessed dip in their demand due to
global trade collapse. Many of the companies had to diversify their trade into other sector of shipping
that again added pressure on the vehicle carriers. For instance, ICO terminal which was an automobile
terminal in Belgium was turned into port of break bulk cargo facility (Bernard 2010: 18).
Top leading vehicle carriers including NYK, MOL, K Lines of Japan and Wilhelmsen Wallenius of
Norway too suffered from the downturn. The recovery in this sector saw the vehicle carrier picking up
the business in late 2009, when the world economy emerged from recession and this sector was assist-
ed by projects driven by government. The vehicle carrier sector have taken necessary actions to re-
cover by balancing the supply and demand which had included laying up and scrapping of some of
their carrier vessels. The recovery has been steady with the emerging markets of developing econo-
mies of the world including China, Brazil, India etc entering and investing in the automotive sector
and this helps this sector to keep up with the pace of recovery with these visible changes in trade pat-
terns mainly in these emerging countries (Bernard 2010: 18). Reefers are those types of containers
with temperature controlled cargo sections in it maintaining it as required depending on the type of
cargo it carry, chilled, frozen or warm. The temperature sensitive cargo is powered from external
power source and these types of container carrying vessels had struggled in the financial crisis period.
But in comparison to other cargo carriers like the bulk carriers and ro-ro vessels, the effect or reces-
sion on the reefer carriers are much lower for the reason that the downturn in the economies of the
trading countries have very little impact on the food industry and the customers have to eat and have
not changed their eating habit, also food shortage was not a part of the crisis and have not happened
during this time. Instead shipping industry witnessed a rise in the market volumes of certain compa-
nies, of the reefer containers for about 10% in 2008 compared to its previous year, and most of them
being the export of frozen and fresh pork from Canada to Australia and New Zealand and also frozen
fish and meat from the Far East countries. The reason for the lesser impact of financial downturn on
refrigerated cargo vessels includes the absence of over capacity in reefer sector as it is seen in dry
cargo vessels and also the fact that to operate modern reefer container vessels is much cheaper than
M99 EKM Masters Dissertation
Mithun Sasidharan (3986736) Page 28
the old types of conventional ships. But the recession impact and the slow recovery in the US led to
shortage of reefer equipments in the North America which affected the shipping logistics and frozen
cargo was held in cold storages for quite a long time. Since 2008 witnessed a very little impact of re-
cession on the temperature controlled reefer container sectors, major shipping companies including
Maersk and Safmarine invested a lot in this sector of reefer equipment and services, with a forecast of
profit in the future and to attract market and business (Canadian sailings 2009).
The container shipping industry too faced the real heat of global economic downturn which led to
many shipping companies to sink, some of them to merge with others, and also forced to make chang-
es in the acquisition terms which existed previous years. The shipping industry adopted strategies to
adjust with the issue of over capacity during reducing demand. Financial turmoil erupted in the con-
tainer industry when the supply and demand for the ship capacity were out of balance. The recession
in the container industry led the credit market to crash and ultimately led the lenders to squeeze the
borrowers who were in debt for acquiring new container ships. The volume of growth rate dropped
which reduced carrier’s revenue but the operating costs and fuel prices remained on the higher part.
The growth in the container vessel space was exceeding its demand and the difference was still wid-
ening since more ships were delivered later on in the next 2-3 years. The ship owner took evasive ac-
tions to reduce the effect of crisis by managing the vessel capacity particularly in the Trans pacific
and Trans Atlantic routes, also by adopting the policy if slow steaming of merchant ships for more
economical fuel consumption and even took policy of shuffling the vessel routes and newer vessel
sharing agreement. Some ship owners have adopted policies to lay off their ships more often to those
in the Asia Europe route and even to cancel new orders. According to Neil Dekker of Drewry Ship-
ping Consultants, “If a number of large orders were to be cancelled; this would help the supply- de-
mand balance”. But since the ships, which were ordered before the crisis when the business was
bright, are being delivered in huge number, the carriers are finding it hard to put them due to over ca-
pacity. For bigger ships ordered during favourable conditions in 2007-08 and which are delivered in
2010-11, the global economic crisis recovery was not uniformly faster to accommodate the huge ton-
nage of this amount. Hence the ship carriers keep continuing to trim the vessel capacity. Some of the
carriers even tried to turn the chartered ships back to the owners after the lease period which also adds
more pressure on the charter market which increased the capacity for the charter market like that of
the freight market. Charter rate and freight rates have fallen by 10% and 50% respectively during the
period which meant that all the shipping lines lost the money in the trade particularly in Europe Asia
route and most carriers cancelled the services in the transpacific and Asia Europe route. Some of the
carriers took decision for putting the vessels for maintenance in the dry docks which extended longer
than normal and some others in lay off in the mid sea, for instance, in Iceland the Icelandic carrier
named Emiskip had uncertainties over its long term financing due to the financial turmoil affect on
Iceland’s economy and also shipping industry (Leach 2008: 12). In the year 2007, the economic slow-
down was visible in the container shipping industry when the price of crude oil dropped significantly
and the price of primary industrial metals like aluminium, nickel, steel etc fell dramatically. This af-
fected the balance between supply and demand of the capacity of container vessels which ultimately
led to reduction in demand for containerised import from Europe, Japan and U.S. which were the de-
veloped economies. This means that cargo demand for satisfying the supply of vessel capacity was
not enough mainly because of the delivery of newer vessels. Developing nations like India and China
are comparatively less affected by the economic slowdown for the reason that their exports are less
depended on the foreign trade but still are affected because global industrial slowdown have occurred
in the international trading world. The main factors that eat up the vessel capacity are the port conges-
tion, trade growth, slow steaming of ships and faster recovery in the Asia- Europe route. In short,
higher vessel delivery order and schedule for the same will create overcapacity which became una-
M99 EKM Masters Dissertation
Mithun Sasidharan (3986736) Page 29
voidable. The shipping companies or the carriers are also much worried about the rising cost of the
bunker fuel oil together with the overcapacity (Leach 2007). The year 2008-09 also witnessed major
fall in the break-bulk and project cargo shipping industry mainly in the Asian sector. These sectors
are subject much to seasonal conditions. Cancellations and delays in projects were visible most com-
monly in the infrastructure sector of projects from Canada to Australia. Asian countries especially
China were less affected comparatively. New orders in the break-bulk and heavy lift sector saw a re-
duction in this period, but the overall impact of recession on the break-bulk and project cargo sector
was found to be stable even though smaller suppliers were adversely affected. In the Middle East re-
gion, even with the global economic crisis, the impact was very less severe of the project related trade
from China. Some of the affected nations delayed or cancelled few of their infrastructure projects.
This delays and cancellations will bother the logistic challenges adversely and will in turn affect down
the supply chain including the suppliers, shippers and the third party logistics and to the engineering
firms. In short the global financial crisis altered the dynamics of break-bulk project shipping sector
(Biederman 2009). The heavy lift market witnessed delivery of new ships despite the crisis and the
issue of overcapacity in this sector was only short termed. Long lead times and lack of access to cred-
its have affected the sector in slowing down many projects which means less cargo on the shipping
lines. The recession has reduced new orders and some huge projects, for instance in Middle East sec-
tor have been delayed. Some companies have decided to postpone projects to negotiate for the freight
rates and also for the price of raw materials which dropped globally. The effect of impact on this sec-
tor of heavy lift cargo sector is much less regarding that happened to container and dry bulk cargo
sector. In comparison to the crisis in 1990 where there were a lot of cancellations in this trade, that
didn’t appear to happen in this period of recession (Nodar 2009: 28).
Table 1 Comparison of profit and losses before and post recession of major shipping companies
MARINE SHIPPING COMPANY PROFIT BEFORE
CRISIS PERIOD
LOSS DURING
CRISIS SEASON
A.P. Moller Maersk $1.05 billion $373million
Neptune Orient Lines $121million $245million
Hapag Lloyd $24.5million $302million
Hanjin Shipping $92million $191million
NYK Lines $610million $262million
Mitsui O.S.K. Lines $576million $136million
K lines $226million $155million
(Leach, Mongelluzzo 2009: 13)
M99 EKM Masters Dissertation
Mithun Sasidharan (3986736) Page 30
David Beiderman (2010) suggests that, considering the situation as a whole, the economic recession
which affected the shipping industry has created problems in the relationship between shippers and
third party logistics providers. The process of building up of ties between them started when the re-
covery was happening bit faster than expected where the shippers have started to invest more on
3PLs. All the steps taken during the crisis period for cost cutting had left the supply chain network out
of balance and both parties are adjusting to the alterations and modifications adopted in the trade sce-
narios during recession. It is learned that most successful shipping companies were those who had
adopted good change management techniques. The economic recession have led a huge number of
carriers and shipping logistics providers out of business and this has led to shippers searching for
more competitive and prospective third party logistic providers with excellent track records and effi-
cient knowledge of the industries. Shippers are engaging more volatile 3PLs in more strategic way.
According to senior vice president of a global 3PL company Jim Butts, “When I started in this busi-
ness, we heard that customers didn’t want to put all of their eggs in one basket, but now they are say-
ing there are a lot of shaky baskets out there”. Global downturn created uncertainty and influenced
many company’s supply chain in the management of transportation of goods under the total landed
cost principles. The post recovery period saw the companies focussing more on the global competition
in business and managing the supply chain complexity and new rules and regulations rather than con-
centrating on the survival techniques. The uncertainty mentioned includes natural calamities as in Ja-
pan, political unrests as in the Middle East, availability and costs of raw materials from the suppliers
as seen by the rules in India to stop the export of cotton which was the world’s largest exporter of it
etc, which adversely have impacts on the supply chain. Companies realised the importance of risk
management together with cost management. They also learned that flexibility, forecasting and resili-
ency are key factors to be taken into consideration in the scenario of economic uncertainty, fuel price
volatility and other risks in the industry. This visibility and forecasting is necessary for the customers
to prepare and be cautious against the economic fluctuations in terms of costs and currencies and re-
duced cycle times (Biederman 2011). The figure below represents the order book of ships yet to be
delivered which is shown to be 42% of present capacity and worth US $500 million during November
2009 (Clausius 2009: 89).
Fig.7 Order book of ships (Clarkson research Studies cited in Clausius 2009: 89)
M99 EKM Masters Dissertation
Mithun Sasidharan (3986736) Page 31
During these period where most of the shipping companies reported losses including Japanese top
three major container lines, Maersk, Mediterranean and few rare others announced rate hike on their
major lines including Asia- Europe, trans Atlantic and also trans pacific even with the economic
downturn hitting the industry hard and most of them trying aggressively to withstand the market com-
petition. These companies were trying to adopt counter cyclical policy to defeat the financial down-
turn. In this scenario, most shippers were concerned in adjusting and protecting to the bunker fuel
price hike and this led the freight rates to deteriorate. The shippers still believe that the balance be-
tween the supply and demand still remains the prime deciding factor to stay afloat in the business
(Leach, Mongelluzzo 2009: 17).
The year 2008-09 witnessed huge swing in the freight rates and vessel capacity and contract negotia-
tions among the carriers, shippers and providers and the huge shoot up in the global oil prices. The
industry gradually picked up and recovered which saw an improved balance developing between the
vessel capacity and the industry market demand. For instance, North American trade route, which was
struggling with very low rates and volume for couple of years, witnesses a sharp recovery in the ves-
sel’s market demand which actually outpaced the ocean capacity. The crisis period had a very slow
rate of contract signing and some contracts had even extended. The carriers and shippers were com-
pelled to enter into long term contracts due to the sharp swing in rates (Mongelluzzo 2011).
One of the most important strategies that govern the shipping is the balance which exists between the
supply and the demand in this sector. The growth of global economies resulted in the increase in the
demand for shipping relative to supply. This high demand in turn resulted in creating strong markets.
But ever since crisis have occurred, it changed the scenario especially with the slowdown in China
which is one of the major trading nation importing raw materials from Australia, Brazil and other na-
tions for its infrastructural and manufacturing processes and also in exporting finished products. It is
very unfortunate for shipping industry in having its supply outstripping its demand in the industry
with lower freight rates. So it is essential for the industry to focus on both supply and demand and in
particular, give more stress and attention in demand. The supply side comprising availability of ships,
capacity of vessels and ports are important but the demand side which comprises developing the glob-
al trade and business and also economic activities and risk assessment are more vital. The shipping
rates are driven by the utilisation ratio between the supply and market demand and the freight rates are
also depended on commodities, trade developments, oil prices, raw material prices and availability,
the availability of finished goods and port congestion and delays (Lorange 2009).
The market collapses of recent times have led to a loss of nearly $15 billion and many companies are
reviving by adopting the policy of merging and acquisition among struggling carriers. Some of the
examples for this are the Hapag-Lloyd’s acquisition of CP Ships, Maersk’s acquisition of P&O
Nedlloyd and NOL taking over of APL. Strategically the mother companies are in better position than
they were before taking over which helped them to reduce their carrier cost and other benefits. It is
observed that mostly container sector are much better for merging and acquisition than compared to
fragmented bulk shipping companies (Bonney 2011: 1). Yet another policy adopted by major shipping
giants to tackle crisis was to lay off their vessels keeping them out of service and also scrapping their
older vessels. NYK, K Lines and MOL of Japan have scrapped their older ships much earlier than
they had planned due to the recession. Norwegian company Wallenius Wilhelmsen decided to lay off
20% of their vessel and among the entire above, majority were from the automotive sector. Another
step adopted by Hoegh Autoliners is to increase the volume of other heavy cargo including heavy lift
and project cargo in the car carriers to compensate for the vacant ballast journeys. Some shipping
M99 EKM Masters Dissertation
Mithun Sasidharan (3986736) Page 32
companies re-evaluated and changed their service/ voyage routes which witnessed more carriers
building and developing their base in terminals in the emerging economies of India and China
(Biederman 2009). The hard time of the recession period was visible by the growing number of ves-
sels being laid off or scrapped. The reduction in demand and fall in trade together with the delivery of
newer ships created serious surplus of capacity in the dry cargo fleet, for about 1.6 million TEUs of
extra capacity hit the industry which were practically not required. According to Widdows, chairman
of World Shipping Council and Transpacific Stabilisation Agreement, “My own view is that this is
much deeper and longer than anything we’ve seen in the past. We’ve got companies around the world
that is going bust every day. It’s a cycle. Companies go bust, people are unemployed, and it reinforces
the desire to hold cash whether you’re an individual or a company”. The new deliveries which added
the surplus extra capacity and the economic slowdown together created big trouble for the shippers
who had taken measures against the increase in capacity (Leach 2008: 9).
The serious tension among the shipping industry during the crisis period was how much long will this
logistical nightmare effect last and how severe it is going to be. Not only was the effect visible on the
smaller companies, even the Asian car manufactures, who were the leading section among the au-
tomakers were struggling with the economic downturn which happened during the awkward time for
them when the industry boom saw these owners ordering for new vessels of huge size and had to plan
for adopting necessary counter policies. The effect was obvious and clearly visible for older and less
fuel efficient vessels which were laid off or scrapped during this time, but was also visible in the sec-
tion of new deliveries which struggled mainly because of overcapacity and slashing demand for carri-
ers due to failure in global trade growth. The three Japanese giant automotive carriers namely MOL,
NYK and K Lines adopted counter actions of excess capacity and yen- dollar exchange rate troubles,
by lying off some of their vessels at anchorage and some of them to scrap yard. The world’s largest
automakers, Toyota, which overtook General Motors, had to consider alternative suppliers to stay
afloat in the market (Dibenedetto 2009).
Contrary to the market happening, some carriers still invested in the ordering of newer vessels even
though economic crisis had pulled their profits down dampening the demand and led them to trouble
of excess capacity. Some carriers, for example, BBC and Beluga still continued to invest in new
heavy lift speciality ships. The ship owners were confident enough of the market compromise with the
new deliveries and hence were willing to take that risk. For some owners, heavy scrapping of vessels
over 20-25 years old would help to reduce the effect of surplus capacity and believed that over capaci-
ty is not caused by new delivery vessels but from not scrapping and getting rid of old vessels. A vital
fact about the scrapping of ships is that, older ships which are being sent for scrap yard are 20 years
aged or more and are very old general cargo type where as new delivery ships are vessels of much
more efficient performance and capacity. Hence even if owners keep scrapping and order for new
ships, the company gets benefit of acquiring more and more efficient vessels. According to Mark
Page, Director of liner shipping at Drewery Shipping Consultants (London, U.K.), “if demand keeps
going up and there’s a shortage, people are keen to capitalize. But get a market that flips and moves
into something with excess capacity, and you want to have smaller ships. The larger ones are the ones
most exposed to risk.”(Nodar 2009).
Apart from the ship owners, some manufacturers, retailers and even shippers formed crisis manage-
ment teams in the fear of disruptions caused by global recession and to adopt serious tactical steps to
tackle it more efficiently and to cope up with the flexible markets of their logistics and transportation
providers. The team programme comprise discussions and meetings between the major financial and
executive officers, manufacturers, logistics providers, and the sales team for adoption of steps to tack-
le the crisis situation from getting more troublesome. Issues regarding delay in payment from the
M99 EKM Masters Dissertation
Mithun Sasidharan (3986736) Page 33
companies, slashing liquidity and reduction in the shipment volumes have compelled the supply chain
providers to form such crisis management teams. Collapse of about 2700 truckers, struggle for the
warehouses and increasing job cuts in the financial crisis period shows how the recession had its ef-
fects on them. For some companies the suppliers have began to demand for immediate payment on
delivery for the materials where previously they had a mutual trust on the consumers to have the pro-
cess of payment at a later stage. It is seen that more powerful companies get stronger in the industry
as their competitors got out of the business without able to cope up (Hoffman 2008).
5.2 Credit crunch effect on the seaports
For nearly two decades prior to the global credit crunch or financial crisis, the business of internation-
al ports and hub witnessed huge profits and increase in volume which had in turn led to port conges-
tions. The sea trade market and industry business was developing so rapidly, more than the develop-
ment rate of the terminal facilities. But the seaborne trade and volume saw drastic decline. With the
demand in sea trade got hit badly due to global economic downturn, eventually the port services too
got affected and the port dues / fees were adjusted to the change and shift in cargos between ports
took place. Major categories of container cargo were that of food, chemicals, consumer goods and
intermediary cargos. The effect of crisis on food flow was comparatively less hard as the food con-
sumption is not hit by the recession. The chemicals, mainly used in cars, pints, medical equipments
etc were hit strongly by the crisis whereas consumer goods, which are mainly imported into Europe,
were moderately affected. The intermediary container cargo mainly used to manufacture capital or
consumer products are also among the highly affected sector. These all indicators reveal the depth of
the crisis impact.
In the container section, the reefer containers were much less affected than the dry freight cargo with
only 5% reduction in the comparison with 23% for the dry cargos. The case of refinery products even
showed slight reduction in performance but for this product, the demand reduction has not completely
led to similar effect on the production reduction. The container sector of iron ore mainly supplying for
the steel plants for automotive industry too experienced an expected reduction in its flow due to trade
halt in the automobile sector crisis. Also the coal cargo imports, mainly used in steel production in
powered electricity plants suffered loss due to decline in its sector and its energy consumption. Before
the crisis, the shippers had worked along with stevedores but later these shipping lines started to work
in line with the port facilities termed as terminal operating companies (TOC). The port authorities
took necessary steps during the recession mainly with the help of stakeholders in their development
and also helping other ports mutually. But as a whole the loss incurred by the port was less in compar-
ison with the shipping lines. In a nut shell, the port business had its effect of crisis but was not much
severe that it still remains good in business. The improvement of port facilities played a major role in
the fast recovery of maritime supply chain (Pallis, Langen 2010).
The recession has had its effects more on the developed economies than the emerging nations where
the GDP growth were about 3-4% when the developed economies witnessed negative growth. Its sig-
nificant impact was seen expectedly also on the maritime shipping, ports and logistic providers and
the depth and extend of crisis specified the considerable long term impact that it is going to have on
all related fields. The number and volume of ships in the East West route had declined considerably
where as Asian region could see much lighter effects. It led to reduction in capacity and dip in the
shipping freights mostly in the above mentioned routes and particularly in container sector.
M99 EKM Masters Dissertation
Mithun Sasidharan (3986736) Page 34
Table 2 Change in fleet capacity of major shippers during the crisis period.
SHIPPING LINES
PERCENTAGE
CHANGE IN FLEET
CAPACITY
SHIPPING LINES
PERCENTAGE
CHANGE IN FLEET
CAPACITY
MAERSK - 8.0 APL - 19.9
CMA CGM - 2.1 MSC 11.6
MOL - 15.1 HYUNDAI - 11.9
K LINES - 21.9 EVERGREEN - 2.4
NYK - 11.6 MISC - 27.2
(Slack 2010)
Now when the recovery was expected in late 2009, the delivery of new ships made over capacity an
issue and shipping companies had to lay off some of their cargo vessels to compensate and adapt to
the situation. The recession, its recovery and the issues related to it made the shipping companies, port
authorities and also the concerned government to take latest technological and management measures
for faster re-structuring of its respective economies. The industry realised the need for transparencies
among the shippers, port facilities, stakeholders and logistic providers for better information sharing
and improvement. Brian Slack (2010) suggests that the economies of US and EU countries had suf-
fered hugely because of financial tsunami where as South Asia and other emerging nations had its
minor effect mainly due to the decline in trade with the developed economies. One another major step
adopted by the shipping companies were the re-routing of the Asia to West trade to Europe going
around the Cape of Good Hope in the Africa instead of passing the Suez Canal to avoid the heavy toll
of the canal ($800,000 per transit) and to have longer voyages to compensate the capacity draught
issue. The problem of congestion of ports in the US west coasts had lightened a bit during recession
when some companies changing their trade routes toward East coast ports and Gulf. This changing
pattern led to more stress in the port development in the developing economies.
Recession recovery period had witnessed more government involvement in the development and in-
vestment in the port and shipping sector which had seen increasing privatisation during pre crisis
terms mainly for the reason that government of any nation recognised the importance of shipping
trade and port infrastructure for the improvement of economy of their respective nations. The recov-
ery period of crisis had put the shippers and port authorities under pressure to take stringent steps in
terms of environment issues and to make their entire supply chain more greener in terms of reduction
in oil spills and hazardous gases and chemical disposals, to deal with the disposal of ballast water and
antifouling paints and also sewage/ garbage issues. Most developed nations had taken actions to ad-
vice the shippers to protect their coastline and environment and use low sulphur fuel to prevent harm-
ful air emissions. The changes adopted in the ports and shipping industries are for long life and hence
the adoption of stringent measure especially more strict Marpol rules made life of shipping companies
more difficult (Slack 2010).
M99 EKM Masters Dissertation
Mithun Sasidharan (3986736) Page 35
5.3 Credit crunch effect on the Supply chain
The supply chain sector of every organisation brings about a major portion of revenue and profit and
when the companies face fierce competition in the market, its supply chain feels the pressure for
prompt and better performance. . Director of Supply Chain Risk Management practice at Marsh, Gary
Lynch considers that “threats to the supply chain are fundamentally predictable, we know disruptions
will occur, but there are too many variables to know the impact on the supply chain”.
Major issues for the shipping supply chain to be alert of are:
 Economic recession (as that happened in recent times 2008-10)
 Natural disasters (Japanese tsunami, Iceland volcanic eruption)
 Export strikes (as in restriction of cotton exports in India)
 Quality control issues etc.
During economic crisis, new techniques and scenarios had been adopted by the maritime companies
and its supply chain for staying competitive in the flexible market condition. One of the major adap-
tive policies that played a major role for the European regional companies was the CEE strategic loca-
tion factor (Raluca et al 2010: 83). Prior to the crisis, shipping companies were concerned about the
quality of the end product and supply risk but soon after recession, concentration was much on the
liquidity/ solvency risks related to financial disruptions. Recession effects have led the increase in
supply of automobile supplies from China and India to South America to almost double volume,
which made the supply chain of existing companies under stress and additional new suppliers had to
be introduced. Some companies like UPS supply chain solutions shifted its customers between modes
for preventing excess inventory caused as a result of the volatility in supply and demand which creat-
ed an imbalance in the supply chain balance (Biederman 2011). According to the data from U.S. con-
sultancy firm Delcam, about 300 billion dollars were lost in the revenue for U.S. business logistics
and supply chain firms. The impacts caused by the financial tsunami, particularly in the manufactur-
ing sector have – through the ‘bullwhip effect’- amplified the after effects through the entire supply
chain causing damage to company’s financial status. Every company had to stress more on crisis
management and forecasting, develop new techniques/ technologies than the old traditional way of
doing trade. In this context, Reiner and Fichtinger (2009) introduced new dynamic model for evaluat-
ing the improvement of process in the performance of supply chain. In the global maritime trade sce-
nario, at present all the major shipping companies try to expand their supply chain internationally and
hence to withstand the market competition, outsourcing of logistic activities and precise performance
of supply chain is of vital concern (Chang, Lin 2010).
In the Far East, supply chain meant a relationship between the entire ‘chain’ in the organisation from
the initial suppliers to the end customers with the later controlling the major decisions and the rela-
tionship. Supply chain relationships were found more effective and efficient than the traditional lo-
gistic approach mostly called as the Just In Time (JIT) approach which had commenced in the Toyota
manufacturing system. During recession in the Far east, supplier – customer relationship remained
unaffected with customers being the decision makers. Hence the company could add or remove firms
in the bottom portion of the supply base. But in west, situation during the crisis was not so mainly
because of the lack of trust between the suppliers and customers and both won’t move forward to-
gether easily. Recession affected in the Far East where Japan and South Korea suffered due to decline
in the demand from customers for manufacturing goods mainly in the automotive sector (Lamming
2000).
M99 EKM Masters Dissertation
Mithun Sasidharan (3986736) Page 36
5.4 PESTEL analysis of maritime supply chain: PESTEL analysis is a framework used by major
international shipping companies for identifying the opportunities and risks in and outside the organi-
sation and also to develop specific strategies based on the same. PESTEL stands for Political, Eco-
nomic, Social, Technological, Environmental and Legislative/ Legal factors.
Fig. 8 PESTEL analysis diagram
Political Factors: One of the recent highlights in this section was the political unrest in the Middle
East which resulted in the Oil price hike. The 9/11 incident in the United States made the regulations
and additional requirements stricter even in countries outside U.S.
Economic Factors: Current recession which influenced the fluctuations in the international economy
resulted in decline in demand of cargo and hence shipping trade. Import and export restrictions were
more frequently visible and crisis led bankruptcy resulted in financial crisis.
Social Factors: Globalisation have resulted in suppliers, traders and customers from the entire supply
chain being from different nationalities and many a times it creates unexpected tensions in the links of
the supply chain. This different social atmosphere creates its own adverse effects.
Technological factors: The supply chain is getting influenced by unexpected changes and risks in the
field of IT or telecommunication system crisis. New and latest innovations in IT are very much need-
ed for the companies to stay competitive.
Environmental Factors: Supply chain of every shipping company gets affected largely by the natural
disasters like tsunami, volcanoes etc. and even the new stringent rules for the protection of environ-
ment which are different for different regions adds more pressure on the industry’s supply chain.
Legal Factors: Customs and terminal regulations too have major impacts for the trade between inter-
national countries. The formation of EU for example has made difference to the supply chain provid-
ers in the Europe.
Every organisation recognises the need for making their supply chain strong and secure. According to
U.S. president Barack Obama, “Securing the global supply chain while ensuring its smooth function-
ing is essential to our national security and economic prosperity”. Cost efficiency and the relationship
between suppliers, customers and other business partners are the vital factors influencing supply chain
performance (Wright 2012).
M99 EKM Masters Dissertation
Mithun Sasidharan (3986736) Page 37
5.5 Credit crunch effect on the marine environment
A huge number, estimated to be around 10% of dry bulk vessels which were unemployed or out of
business for period more than 3 months, were lying at anchorage at deep sea, majority of them in the
South East Asian area –Singapore, Malaysia and Philippine waters- where the toll for the anchorage is
low comparatively. This caused the huge steel hull of the vessel to stay afloat in touch with the sea
water for a long period without movement resulting in extensive quantity of bio fouling marine spe-
cies to come in contact with the ship surface and get attached to it. Also the vessel carries out ballast
operations transferring sea water containing micro organisms from one continental region to another
for the technical reason of adjusting stability. This two processes result in movement of marine spe-
cies from a region to another where this may not be suitable and can cause harm to the environment of
that region. When an extensive layer of micro species are present on the ship’s hull, it causes re-
sistance to the flow of water by what is called as ‘hydrodynamic drag’ that results in reduction in ves-
sel’s speed and increase fuel consumption.
The ship owners hence apply anti fouling paints on the vessel hull to get rid of the bio fouling organ-
isms, which require considerable movement of the ship. When the recession affected productivity and
trade, hit badly on the dry bulk sector,owners were forced to lay off many of their vesselat anchorage
which had adverse affect on the performance of these anti fouling paints which in turn resulted in the
micro organisms to come in touch with the ship surface. The vessels laid off at anchorages accumulat-
ed the bio fouling organisms from the sea water as well as from the adjacent vessels which were then,
during recovery when the trade improved, transported to another region around the globe. Most of
these recovering vessels finding voyages were unlikely had their hull cleaned. Many others were
planned for Dry docks where they clean the hull but since the availability of these were very difficult,
it made the vessels to move their hull unclean and even if the owners invested in refurbishing the hull,
it was not practically possible to clean the remote areas of the hull, and also of propellers, rudders,
thrusters blocks etc. This resulted in transporting and transferring of organisms around the globe caus-
ing marine environmental issues. Latest rules provide stringent rules for ballast water exchange and
anti fouling paints to protect the ocean species (Floerl, Coutts 2009).
Impact of globalisation during the start of twenty first century led to boom in the maritime sector with
huge development in port infrastructure and ship building sector. But the scenario was followed by
immediate change in global trade and business and the crisis impact was clearly visible in the mari-
time transport sector that had implemented new changes and strategies in view of designs and tech-
niques. The process by which shipping companies chose various ports around the world for trading
their seaborne cargo had changed and new methodologies were adopted based on many factors- the
cost incurred, capacity and infrastructure facilities, stevedore availability and service, geographic lo-
cation, connection to sea route and the risk involved. These in turn assisted the port authorities to in-
crease their market share. It is learned that shippers and agents are concerned not only with the flow
of goods from one manufacturing or assembling point to its destination port, but also the behaviour of
all the above factors in order to sustain their business in the struggling market. The recession had seri-
ous affects directly on the ports caused by the decline of sea cargo trade volume worldwide and is in-
dicated by the drastic dip in the operational capacity of the ports and port equipments and harbour
workers. When a lot of major international ports including Hamburg suffered from the financial crisis
loss, ports of South East Asia, mainly Indonesia and Arabic hubs changed into being priority ports for
Europe. Also US west coast ports of Los Angeles and Oakland had developed during the crisis where
majority of US development were seen normally in the east coastal ports prior to the crisis. Since the
Impact of Economic Crisis on Maritime Shipping

More Related Content

What's hot

The State of Domestic Commerce in Pakistan Study 7 - An Overview of the Trans...
The State of Domestic Commerce in Pakistan Study 7 - An Overview of the Trans...The State of Domestic Commerce in Pakistan Study 7 - An Overview of the Trans...
The State of Domestic Commerce in Pakistan Study 7 - An Overview of the Trans...idspak
 
tc-7-100-3-irregular-opposing-forces
 tc-7-100-3-irregular-opposing-forces tc-7-100-3-irregular-opposing-forces
tc-7-100-3-irregular-opposing-forcesTriplo Sof
 
Sapphire Textile Mills Limited - Activities Report - Muhammad Umair Zulfiqar ...
Sapphire Textile Mills Limited - Activities Report - Muhammad Umair Zulfiqar ...Sapphire Textile Mills Limited - Activities Report - Muhammad Umair Zulfiqar ...
Sapphire Textile Mills Limited - Activities Report - Muhammad Umair Zulfiqar ...Muhammad Umair Zulfiqar
 
Bank network project report(ariba siddiqui 8718
Bank network project report(ariba siddiqui    8718Bank network project report(ariba siddiqui    8718
Bank network project report(ariba siddiqui 8718Hamzakhan803
 
Food Security Monitoring Manual-FINAL
Food Security Monitoring Manual-FINALFood Security Monitoring Manual-FINAL
Food Security Monitoring Manual-FINALGirma Legesse
 
Domain Study Indian Power Sector
Domain Study Indian Power SectorDomain Study Indian Power Sector
Domain Study Indian Power SectorJaspal Bhatia
 
Air Force Enhancing Performance Under Stress
Air Force Enhancing Performance Under StressAir Force Enhancing Performance Under Stress
Air Force Enhancing Performance Under StressJA Larson
 
Sample global freight supply chain market research report 2020
Sample global freight supply chain market research report 2020Sample global freight supply chain market research report 2020
Sample global freight supply chain market research report 2020Cognitive Market Research
 
Week 2 blood on the road
Week 2   blood on the roadWeek 2   blood on the road
Week 2 blood on the roadAri Mond
 
Kioti daedong ck25 tractor service repair manual
Kioti daedong ck25 tractor service repair manualKioti daedong ck25 tractor service repair manual
Kioti daedong ck25 tractor service repair manualfjjskekmsemm
 
Kioti daedong ck25 h tractor service repair manual
Kioti daedong ck25 h tractor service repair manualKioti daedong ck25 h tractor service repair manual
Kioti daedong ck25 h tractor service repair manualfjjksekfksmem
 
Kioti daedong ck30 h tractor service repair manual
Kioti daedong ck30 h tractor service repair manualKioti daedong ck30 h tractor service repair manual
Kioti daedong ck30 h tractor service repair manualfjskeksemm
 
Kioti daedong ck30 tractor service repair manual
Kioti daedong ck30 tractor service repair manualKioti daedong ck30 tractor service repair manual
Kioti daedong ck30 tractor service repair manualfjsefksemmm
 
Ethical Corp Report Summary Anti Corruption Russia
Ethical Corp Report Summary   Anti Corruption RussiaEthical Corp Report Summary   Anti Corruption Russia
Ethical Corp Report Summary Anti Corruption RussiaEthical Corporation
 
Internship report on marketing
Internship report on marketingInternship report on marketing
Internship report on marketingAwais Jamil
 

What's hot (19)

The State of Domestic Commerce in Pakistan Study 7 - An Overview of the Trans...
The State of Domestic Commerce in Pakistan Study 7 - An Overview of the Trans...The State of Domestic Commerce in Pakistan Study 7 - An Overview of the Trans...
The State of Domestic Commerce in Pakistan Study 7 - An Overview of the Trans...
 
tc-7-100-3-irregular-opposing-forces
 tc-7-100-3-irregular-opposing-forces tc-7-100-3-irregular-opposing-forces
tc-7-100-3-irregular-opposing-forces
 
Sapphire Textile Mills Limited - Activities Report - Muhammad Umair Zulfiqar ...
Sapphire Textile Mills Limited - Activities Report - Muhammad Umair Zulfiqar ...Sapphire Textile Mills Limited - Activities Report - Muhammad Umair Zulfiqar ...
Sapphire Textile Mills Limited - Activities Report - Muhammad Umair Zulfiqar ...
 
Bank network project report(ariba siddiqui 8718
Bank network project report(ariba siddiqui    8718Bank network project report(ariba siddiqui    8718
Bank network project report(ariba siddiqui 8718
 
Food Security Monitoring Manual-FINAL
Food Security Monitoring Manual-FINALFood Security Monitoring Manual-FINAL
Food Security Monitoring Manual-FINAL
 
Oxygenz report 2010
Oxygenz report   2010Oxygenz report   2010
Oxygenz report 2010
 
Domain Study Indian Power Sector
Domain Study Indian Power SectorDomain Study Indian Power Sector
Domain Study Indian Power Sector
 
Air Force Enhancing Performance Under Stress
Air Force Enhancing Performance Under StressAir Force Enhancing Performance Under Stress
Air Force Enhancing Performance Under Stress
 
Train the Trainer 2015
Train the Trainer 2015Train the Trainer 2015
Train the Trainer 2015
 
Luận văn: Nâng cao năng lực cạnh tranh của VIETNAM AIRLINES trong hoạt động v...
Luận văn: Nâng cao năng lực cạnh tranh của VIETNAM AIRLINES trong hoạt động v...Luận văn: Nâng cao năng lực cạnh tranh của VIETNAM AIRLINES trong hoạt động v...
Luận văn: Nâng cao năng lực cạnh tranh của VIETNAM AIRLINES trong hoạt động v...
 
Guild for lifting
Guild for liftingGuild for lifting
Guild for lifting
 
Sample global freight supply chain market research report 2020
Sample global freight supply chain market research report 2020Sample global freight supply chain market research report 2020
Sample global freight supply chain market research report 2020
 
Week 2 blood on the road
Week 2   blood on the roadWeek 2   blood on the road
Week 2 blood on the road
 
Kioti daedong ck25 tractor service repair manual
Kioti daedong ck25 tractor service repair manualKioti daedong ck25 tractor service repair manual
Kioti daedong ck25 tractor service repair manual
 
Kioti daedong ck25 h tractor service repair manual
Kioti daedong ck25 h tractor service repair manualKioti daedong ck25 h tractor service repair manual
Kioti daedong ck25 h tractor service repair manual
 
Kioti daedong ck30 h tractor service repair manual
Kioti daedong ck30 h tractor service repair manualKioti daedong ck30 h tractor service repair manual
Kioti daedong ck30 h tractor service repair manual
 
Kioti daedong ck30 tractor service repair manual
Kioti daedong ck30 tractor service repair manualKioti daedong ck30 tractor service repair manual
Kioti daedong ck30 tractor service repair manual
 
Ethical Corp Report Summary Anti Corruption Russia
Ethical Corp Report Summary   Anti Corruption RussiaEthical Corp Report Summary   Anti Corruption Russia
Ethical Corp Report Summary Anti Corruption Russia
 
Internship report on marketing
Internship report on marketingInternship report on marketing
Internship report on marketing
 

Similar to Impact of Economic Crisis on Maritime Shipping

Africaadapatationgapreport
AfricaadapatationgapreportAfricaadapatationgapreport
AfricaadapatationgapreportDr Lendy Spires
 
undp2014-sustainable-energy-cis
undp2014-sustainable-energy-cisundp2014-sustainable-energy-cis
undp2014-sustainable-energy-cisGiovanna Christo
 
Prediction of economical recession with the signal approach, and the turkey case
Prediction of economical recession with the signal approach, and the turkey casePrediction of economical recession with the signal approach, and the turkey case
Prediction of economical recession with the signal approach, and the turkey caseDeniz Özgür Tiryaki
 
Notes on growth theory, ec750
Notes on growth theory, ec750Notes on growth theory, ec750
Notes on growth theory, ec750JamesGichuki5
 
Flow Around Ship Like Two Object
Flow Around Ship Like Two ObjectFlow Around Ship Like Two Object
Flow Around Ship Like Two ObjectIsmail Topal
 
Final feasiblity reprtmarina
Final feasiblity reprtmarinaFinal feasiblity reprtmarina
Final feasiblity reprtmarinaanil sharma
 
Review of completion_technologies(1)
Review of completion_technologies(1)Review of completion_technologies(1)
Review of completion_technologies(1)Lawrence Kwende
 
Georgia Rainwater Harvesting Manual
Georgia Rainwater Harvesting ManualGeorgia Rainwater Harvesting Manual
Georgia Rainwater Harvesting ManualD6Z
 
Georgia Rainwater Harvesting Manual
Georgia Rainwater Harvesting ManualGeorgia Rainwater Harvesting Manual
Georgia Rainwater Harvesting ManualK9T
 
Watershed Development in India An Approach Evolving through Experience_0.pdf
Watershed Development in India An Approach Evolving through Experience_0.pdfWatershed Development in India An Approach Evolving through Experience_0.pdf
Watershed Development in India An Approach Evolving through Experience_0.pdfravi936752
 
Chinese Renewable Energy Status Report
Chinese Renewable Energy Status ReportChinese Renewable Energy Status Report
Chinese Renewable Energy Status ReportREN21
 

Similar to Impact of Economic Crisis on Maritime Shipping (20)

CASE Network Report 41 - Currency Crises in Emerging Markets - Selected Compa...
CASE Network Report 41 - Currency Crises in Emerging Markets - Selected Compa...CASE Network Report 41 - Currency Crises in Emerging Markets - Selected Compa...
CASE Network Report 41 - Currency Crises in Emerging Markets - Selected Compa...
 
Africaadapatationgapreport
AfricaadapatationgapreportAfricaadapatationgapreport
Africaadapatationgapreport
 
undp2014-sustainable-energy-cis
undp2014-sustainable-energy-cisundp2014-sustainable-energy-cis
undp2014-sustainable-energy-cis
 
Ind ii npmp revision final report
Ind ii npmp revision final reportInd ii npmp revision final report
Ind ii npmp revision final report
 
Prediction of economical recession with the signal approach, and the turkey case
Prediction of economical recession with the signal approach, and the turkey casePrediction of economical recession with the signal approach, and the turkey case
Prediction of economical recession with the signal approach, and the turkey case
 
Metaschool Module 3.16
Metaschool Module 3.16Metaschool Module 3.16
Metaschool Module 3.16
 
Metadata authoring
Metadata authoringMetadata authoring
Metadata authoring
 
USMC Concepts and Programs 2013
USMC Concepts and Programs 2013USMC Concepts and Programs 2013
USMC Concepts and Programs 2013
 
Imcam166
Imcam166Imcam166
Imcam166
 
Africa in 50 years time
Africa in 50 years timeAfrica in 50 years time
Africa in 50 years time
 
Notes on growth theory, ec750
Notes on growth theory, ec750Notes on growth theory, ec750
Notes on growth theory, ec750
 
Guild for liftings
Guild for liftingsGuild for liftings
Guild for liftings
 
Flow Around Ship Like Two Object
Flow Around Ship Like Two ObjectFlow Around Ship Like Two Object
Flow Around Ship Like Two Object
 
Final feasiblity reprtmarina
Final feasiblity reprtmarinaFinal feasiblity reprtmarina
Final feasiblity reprtmarina
 
Review of completion_technologies(1)
Review of completion_technologies(1)Review of completion_technologies(1)
Review of completion_technologies(1)
 
Georgia Rainwater Harvesting Manual
Georgia Rainwater Harvesting ManualGeorgia Rainwater Harvesting Manual
Georgia Rainwater Harvesting Manual
 
Georgia Rainwater Harvesting Manual
Georgia Rainwater Harvesting ManualGeorgia Rainwater Harvesting Manual
Georgia Rainwater Harvesting Manual
 
Watershed Development in India An Approach Evolving through Experience_0.pdf
Watershed Development in India An Approach Evolving through Experience_0.pdfWatershed Development in India An Approach Evolving through Experience_0.pdf
Watershed Development in India An Approach Evolving through Experience_0.pdf
 
CASE Network Reports 39 - The Episodes of Currency Crisis in Latin American a...
CASE Network Reports 39 - The Episodes of Currency Crisis in Latin American a...CASE Network Reports 39 - The Episodes of Currency Crisis in Latin American a...
CASE Network Reports 39 - The Episodes of Currency Crisis in Latin American a...
 
Chinese Renewable Energy Status Report
Chinese Renewable Energy Status ReportChinese Renewable Energy Status Report
Chinese Renewable Energy Status Report
 

Impact of Economic Crisis on Maritime Shipping

  • 1. M99 EKM Masters Dissertation Mithun Sasidharan (3986736) Page 1 TABLE OF CONTENTS CHAPTER 1 : INTRODUCTION............................................................................................7 1.1 : Outline of Maritime Shipping.............................................................................8 1.2 : What is Dry cargo, liquid cargo and Gas cargo?.................................................9 1.2.1. Dry cargo vessels......................................................................................9 1.2.2. Liquid cargo vessels.................................................................................9 1.2.3. Gas cargo vessels......................................................................................9 1.3 : Aim / Objectives.............................................................................................9 CHAPTER 2 : OUTLINEOF ECONOMIC CRISIS................................................................10 2.1 : What is Economic crisis or ‘Financial Tsunami’?.............................................11 2.2 : Recent history of shippingbefore and after crisis............................................12 2.3 : Development of containerisation......................................................................12 CHAPTER 3 : RESEARCH METHODOLOGY.....................................................................14 3.1 : Types of research methods available....................................................................15 3.1.1. Research qualities and skills................................................................15 3.1.2. The Research process and stages.........................................................15 3.1.3. Research Methodology.........................................................................15 3.2 : Choosing the Right method for research..............................................................16 3.3 : Primary and Secondary data available..................................................................17 3.4 : Framework selected for research..........................................................................17 CHAPTER 4 : REPORT / REVIEW ........................................................................................18 4.1 : SWOT analysis of Shipping and shippinglogistics.............................................19 4.2 : ANSOFF growth matrix for maritime shippingmarket.......................................20 4.2 : How economic slowdown happen........................................................................21 4.3 : Problems to dry bulk cargo carriers......................................................................21
  • 2. M99 EKM Masters Dissertation Mithun Sasidharan (3986736) Page 2 CHAPTER 5 : LITERATUREREVIEW...............................................................................23 5.1 Effects on shipping, losses incurred and actions adopted by the maritime industry...........................................................................24 5.2 Credit crunch effect on the seaports...................................................................33 5.3 Credit crunch effect on the Supply chain...........................................................35 5.4 PESTEL analysis of maritime supply chain.......................................................36 5.5 Credit crunch effect on the marine environment................................................37 CHAPTER 6 : CASE STUDIES............................................................................................. 40 6.1 : Case studies of MOL(Japan) ............................................................................41 6.1.1 : SWOT analysis of MitsuiO.S.K. Lines..............................................42 6.1.2 : Losses incurred by MOL....................................................................43 6.1.3 : How MOLtackled the financial crisis...............................................44 6.2 Case studies of A.P. Moller Maersk...................................................................46 6.2.1 : SWOT analysis of the company..........................................................47 6.3 Case studies of American President Lines..........................................................49 6.3.1 : SWOT analysis of the company........................................................ 50 CHAPTER 7 : DISCUSSIONS AND ANALYSIS................................................................52 7.1 : Analysis of the problem in nutshell................................................................ 52 7.2 : New Development Areas for theshipping companies to concentrate in thefuture...........................................................................59 CHAPTER 8 : CONCLUSION..............................................................................................60 8.1 : Learning outcomes..........................................................................................60 8.2 : Lessons to be learned from the crisis for Shippers..........................................63 8.3 : Further studies.......................................... .......................................................64 CHAPTER 9 : APPENDIX.....................................................................................................65 CHAPTER 10 : REFERENCES/BIBLIOGRAPHY...............................................................68
  • 3. M99 EKM Masters Dissertation Mithun Sasidharan (3986736) Page 3 TABLE OF FIGURES Fig. 1 SWOT Analysis...............................................................................19 Fig. 2 Ansoff’s Growth Matrix...................................................................20 Fig. 3 World sea tonnage............................................................................22 Fig. 4 U.S. Exports and Imports in the last 10 years..................................24 Fig. 5 World’s Top Ten Container Carriers and fleet composition............25 Fig.6 Growth rateof supply and demand in global container shipping......26 Fig.7 Order book of ships........................................................................... 30 Fig.8 PESTEL analysis diagram.................................................................36 Fig 9 Fleet distribution of world’s major carriers.......................................41 Fig 10 Consolidated revenue by segments in the financial year 2011........41 Fig 11 SWOT analysis of Mitsui O.S.K. Lines...........................................42 Fig. 12 MOLbusiness performance..........................................................45 Fig.13 APM group ROIC from 2005- 2011.................................................46 Fig.14 SWOT analysis of A.P. Moller Maersk............................................47 Fig.15 APLloss/profit data for 2009 and 2010............................................49 Fig.16 Average utilisation of container and its volume................................50 Fig. 17 SWOT analysis of APL (NeptuneOrient Lines)..............................50 Fig. 18 History of profits of MOL, APM and APL for the last 5 years........55 Fig. 19 MOL fleet revenue distribution........................................................ 56 Fig. 20 Maersk fleet revenue distribution..................................................... 57 Fig. 21 APL (NOL) fleet revenue distribution.............................................. 58 Fig.22 Consolidated statement of Income of MitsuiO.S.K. Lines................66 Fig 23 Consolidated financial information of A.P. Moller Maersk...............66 Fig. 24 Consolidated Income statement of A.P.L. (Neptune Orient Lines)...67
  • 4. M99 EKM Masters Dissertation Mithun Sasidharan (3986736) Page 4 Table 1 Comparison of profit and losses before and post recession of major shippingcompanies.......................29 Table 2 Change in fleet capacity of major shippers during the crisis period.........................................................34 Table 3 Capacity and fleet volume of strategic alliance group......................38 Table 4 Growth rate for the container sector for the period 2000 to 2009.....39
  • 5. M99 EKM Masters Dissertation Mithun Sasidharan (3986736) Page 5 ABSTRACT This thesis reflects the severity of the financial tsunami on the maritime shipping and the supply chain. Recession was initiated with the crashing of financial institutions in the US and spread world- wide affecting global trend. Every sector including Automotive and manufacturing suffered a huge loss .This affected world trade and shipping industry faced the heat of deadline of cargo and over capacity. Maritime companies including Mitsui O.S.K. Lines, APL (Neptune Orient Lines), Maersk, Evergreen etc adopted strategic measures to survive and overcome the crisis and emerged as successful survi- vors; it is obvious from the case studies of most globally leading companies that efficient implementa- tion and rapid actions for resisting damages due to similar crisis in the near future.
  • 6. M99 EKM Masters Dissertation Mithun Sasidharan (3986736) Page 6 ACKNOWLEDGEMENT First and foremost I thank God almighty for giving me the power for stepping strong and providing a smooth path throughout my process. I would like to express my deep and sincere gratitude to my supervisor Professor Raymond Jarvis for his detailed guidance and comments and constant invaluable support throughout my work. His con- cise ideas and concepts have made me study, reciprocate and thoroughly learn this field of academics. I am deeply Grateful to my supervisor Professor Richard Anderson whose patience and kindness along with his vast source of academic knowledge has been a constant source of motivation for my thesis, and had made this as my invaluable learning experience of my Life. I wish to express my warm and sincere thanks to Professor Owen Richards for his constant help and guidance throughout the term.
  • 7. M99 EKM Masters Dissertation Mithun Sasidharan (3986736) Page 7 CHAPTER 1 INTRODUCTION
  • 8. M99 EKM Masters Dissertation Mithun Sasidharan (3986736) Page 8 1.1 OUTLINE OF MARITIME SHIPPING International Maritime Shipping, known as the lifeblood of global economy, carries about 90% of world trade. Shipping is the bulk transport of goods and raw materials, import and export of foods and manufacturing goods and this inter-continental trade comprises of about 50,000 merchant ships and manned by around 1.25 million seafarers. According to Jan Hoffmann (2010: 122), “Greek owned vessel that is built in Korea may be chartered to a Danish operator who employs Filipino seafarers via a Cypriot crewing agent. The ship is registered in Panama, insured in the United Kingdom and trans- ports German made cargo in the name of a Swiss freight forwarder from a Dutch port to Argentina, through terminals that are concessioned to operators from Hong Kong and Dubai. On its journey the vessels may have repairs done in a Portuguese yard, a bunker fuel in Spain and tranship containers- to be reloaded on a different ship in a different destination in Brazil”. The merchant ships are high val- ued technically sophisticated assets and ever since the world trade is growing internationally, the safe operation and reliability of ships became vital. For these governing bodies were formed with stringent rules and regulations being introduced and the major body being International Maritime Organisation or The IMO based in London. The world trade keeps growing continuously and hence shipping indus- try have to respond to its demand for its service. The various different types of ships that carry the varieties of cargo round the globe are as follows: 1. Bulk carriers, which transport food materials, raw materials like iron ore and coal, are identifiable by the hatches raised above the deck level that covers the cargo holds. These types of vessels are known as the work horses of the fleet and the large bulk carriers can carry and transport enough grain to feed approximately four million people for one month. 2. Container ships which carry a huge volume of world’s manufactured goods and finished products and these are usually on scheduled liner services. The recent times latest container vessels can ac- commodate volumes equivalent of 10000 heavy trucks. 3. Tankers are merchant vessels transporting oil, chemicals and other petroleum products and larger tanker ships can even carry over 300,000 tonnes of oil. 4. Passenger ships or Ferries and the luxury cruise ships usually perform shorter journeys for a mix of passengers, cars and other commercial vehicle. 5. Other categories of ships include roll on roll off, pure car carriers, gas carriers, heavy lift vessels, ships for supporting the off shore oil industry and other general cargo ships (International Chamber of Shipping 2008). Outline of maritime shipping supply chain For any global company, to reach its products to destination is depended directly on the supply chain of the maritime transport being utilised for the trade. Mak and Ramaprasad (2003) cited by Caragin Andreea Raluca, Paraschiv Dorel Mihai, Voicu-Dorobantu Roxana (2010) considers supply chain management as “a set of approaches utilized to efficiently integrate suppliers, manufacturers, ware- houses, and stores, so that merchandise is produced and distributed at the right quantities, to the right locations, and at the right time, in order to minimize system-wide costs while satisfying service level requirements”. For each shipping company, its supply chain is of vital importance in terms of busi- ness, market competition, and trade performance and in terms of revenue (Raluca et al 2010: 83).
  • 9. M99 EKM Masters Dissertation Mithun Sasidharan (3986736) Page 9 1.2 WHAT ARE DRY CARGO VESSSELS, TANK VESSELS AND GAS CARRIER VES- SELS? 1.2.1 Dry Cargo carriers: The dry cargo vessels often have huge hatches or covers which secure the holds containing cargo and keep them dry. The dry cargo vessels normally transports dry bulk which includes grains, ores, coal, fodder etc, or break bulk in their large cargo holds. These types of vessels are extremely versatile and have numerous possibilities for transportation mainly as that of inland vessels. 1.2.2 Liquid Cargo Carriers: Liquids, mostly diesel, petrol, petroleum distillates or edible oils etc are transported in special types of vessels with double hull protective design. Since about 80% of world’s hazardous materials are transported by ships using liquid cargo carriers which are safer than other means of road or railways, these vessels have to meet stringent regulations and requirements like dou- ble hull testing in practice to prevent leakage of hazardous cargo in the extreme case of any collision event. Normal type liquid carriers are the traditional tank ships which transports petroleum products and other liquid cargo. Chemical carriers with high safety standards have stainless steel storage tanks to carry hazardous chemicals such as hydrochloric acids, phenols etc. Some chemical tankers have tanks with protective coating for dangerous chemicals like benzene, naphthalene etc. These types also have double hulls for safety reasons. 1.2.3 Gas Cargo Carriers: The gas cargo carriers or gas tankers are extremely strong and the safest mode of transporting gases for years. Since these gases are dangerous and have the property of be- coming to liquid state when transported under pressure, these carriers have circular shapes with triple hull (Bureau Voorlichting Binnervaart 2012). 1.3 AIMS / OBJECTIVES  To understand what maritime shipping is all about and study the type of ships or cargo carri- ers based on different categories of structure and the cargo it transports.  To identify and collect vital information regarding financial crisis and its impacts on the mari- time shipping logistics.  To demonstrate the effects the shipping companies round the world faced during the crisis es- pecially with regards to dry cargo carriers.  To understand the strategies followed by maritime shipping companies during recession.  To identify, study and understand from the case studies of the maritime shipping companies from Asia, Europe and America, the actions and policies adopted to respond to the crisis situ- ation and how did they implement it.  To conduct SWOT/ PESTEL analysis of these shipping companies to withstand the situation.  To investigate the loss incurred and the corrective actions adopted by the companies to tackle the global recession mostly with regards to the bulk carriers which had the greatest effect, in- cluding the lay-offs and ballast voyages.  To research the background of financial crisis in a global perspective and its impacts on the financial and business organisations.
  • 10. M99 EKM Masters Dissertation Mithun Sasidharan (3986736) Page 10 CHAPTER 2 OUTLINE OF ECONOMIC CRISIS
  • 11. M99 EKM Masters Dissertation Mithun Sasidharan (3986736) Page 11 2.1 WHAT IS ECONOMIC CRISIS OR ‘FINANCIAL TSUNAMI’? According to De Bonis, Definition of financial crisis is “A wider range of disturbances, such as sharp declines in asset prices, failure of large financial intermediaries or disruption in foreign exchange markets”. In a financial downturn, the affected nation will have serious impact on its real economy and also adverse affects on employment, purchasing and production capacity with major firms unable to meet their financial obligations. Political uncertainty further worsens the economic situations in certain countries. The recent global economic turmoil of 2008-09 has a lot of common patterns with those in the past including Great Depression and other similar banking crisis. The downturn in finan- cial sector normally leads to complex conditions of decline in the GDP of the country, decline in the asset prices and affect in the unemployment rates. The current crisis, according to experts, is a trough in the global economy and market after the big ‘boom phase’ that extended from early 1980s to 2006. The boom during this period was mainly due to the development and advancement in Information technology, processing and manufacturing technology and deregulations of developed nation’s finan- cial markets. Fundamental changes in the social, technical and financial rules were the driving force for the boom phase which led to globalisation. The end of this ‘boom phase’ and the start of the cur- rent crisis phase known as ‘bust phase’ began with the financial institutions in the US failing to meet its obligations and this then globally spread which lead to the global financial crisis ( Roy E Allen 2009). The global financial crisis and economic downfall started with the bankruptcy of one of the powerful financial players of Wall Street, USA, the Lehman Brothers Investment Bank and security firm in the United States. Very influential and inevitable financial turmoil or ‘tsunami’ had started since then and world economy experienced critical downturn. Major international financial markets were affected due to the chain reactions induced by the above scenario of US bankruptcy. The global trade were tumbled; financial companies suffered and many were squashed, stock prices around the globe got affected critically (Ho, Choy, Chung and Lam 2010). The freezing of credit markets in the Wall street USA had ultimately led to global financial crisis and reflected in the failure of banks/ financial institutions, declining of currencies and crashes in the stock markets worldwide and also resulted in unemployment whose rate climbed up by 10% com- pared to the previous term. The financial tsunami in the emerging markets have proved that investor’s confidence is very much subject to change at such short span and can deteriorate which leads to adverse market conditions and capital flow (Ghosh 2001). The crisis caused due to misjudgement of conditions of emerging market’s economy by investors and other related bodies concerned had lack of transparency as one of the main cause for the market instability in those sectors. Good governance and increased transparency would reduce the imbalances in nation’s economy and financial instability. Since the nations who suffered the turmoil had a huge financial assistance from international community like IMF, this forced them to raise the need to seek the assistance of the private sectors in the country for resolving the crisis and indulge in common investment issues (Monti 2001).
  • 12. M99 EKM Masters Dissertation Mithun Sasidharan (3986736) Page 12 2.2 RECENT HISTORY OF SHIPPING BEFORE AND AFTER CRISIS Maritime shipping industry witnessed a slump in global trade which led to difficult credit conditions, declining shipping rates and also defaulting customers. The shipping companies had to take actions for cost cutting and layoff of merchant ships with focussing more on consolidation. Global recession affected the dry bulk cargo the most with major companies forcing to lay off their bulk carriers, con- tainer ships and car carrier ships for months due to trade crisis. The barometer of shipping cost known as BDI (Baltic Dry Index) fell by 93.4% in 2008 end and global container volume growth percentage fell from 7.2% in 2008 to 2.8% in 2009. Container shipping demand also fell decreasing the freight rates and volume. World’s largest container shipping company Maersk experienced a reduction in shipping volume by 20% in 2009 compared to 2008. The voyage routes from Asia to US and Europe which accounts for almost 50% of the container trade are facing the heat of crisis impact. Major dry bulk cargo market, China is facing the worst performance ever. Payment stability and healthy cash flow are impacted due to financial crisis. These ultimately may lead to lower revenue realisation and increase in risk of customer default on payment. Major Japanese shipping firms like MOL, NYK and K Lines have had major impact due to low shipping rates caused due to crisis and hence were forced to revise their profit guidance. Major Asian shipping companies have tendency to keep little cash re- serves and to allot high risk contracts which have resulted them in having most significantly affected sector. Since the demand of the shipping trade were increasing before crisis began, majority compa- nies had a rapid fleet expansion with new vessels which, during crisis have led to excess capacity due to reduced trade. Major shipping companies around the world including Mitsui O.S.K. Lines, NOL, and Hapag Lloyd etc have looked into corrective actions to address the crisis by forming alliances and merging their individual services in order to cut the capacity and hence reduce the annual cost of la- bour. Companies have taken decision to lay off some of their vessels especially dry cargo vessels and some others running the vessels on slow steaming basis for economic reason of fuel consumption (Steel 2009). 2.3 DEVELOPMENT OF CONTAINERISATION A container basically is a tank / case with sufficient strength for repeated transport of materials stuffed, de-stuffed or transhipped. The term containerisation, which has revolutionised the global transport of trading goods and commodities, is an increasing / developing trend in the global interna- tional trade. The maritime shipping industry around the world have accepted that containerisation is a major criteria for the future development of shipping trade and hence all trading ports around the world are developing to adjust and cope with the high progress rate(Sople 2007). The container trade has been one of the major portions of shipping since years and average growth rate has been increas- ing especially due to the increase in trade in Asian countries of China, Korea, Japan etc and also Latin American countries. Containers were compared on the measure of twenty foot equivalent unit or TEU and companies including A P Moller Maersk, Mitsui O.S.K. Lines, MSC, P&O NC Hangin, Ever- green, CMA CGM, Hyundai etc have vessels which carry 6000- 9000 TEUs and even bigger capacity vessels are under construction based on the order. In order to accommodate huge ships of this capaci- ty, the respective shipping ports also had to undergo huge expansion with greater productivity. Ports of Singapore, Hongkong etc have very huge capacity and many ports around the world are expanding at greater rates. The variation in container apart from the size factor are simple box type with end doors, box type insulated containers and reefer containers which posses temperature controlled heat- ing/ cooling arrangement (Sudalaimuthu, Raj 2009). A major area of tension was the unavailability of shipping containers during the stronger than expected financial recession recovery period. One of the
  • 13. M99 EKM Masters Dissertation Mithun Sasidharan (3986736) Page 13 main causes for this was the halt in the container manufacturing plant during the crisis period and the decision of many companies to scrap their old ships which were in business for quite a long period. Major common issue for the exporters were in securing empty containers and the problem of equip- ment dislocation. It is learned that the outbound is affected mainly by the issue of location and not by that of the shortage. The container volume at all the US ports in the west coast in 2010 increased by 13% over the previous years but still remains lower than the figure in the year 2008 where there was no shortage of containers. One major possible factor for this is the shutdown of container manufactur- ing industries. This actually created adverse effects on the shippers and even the manufacturers in the year 2009 when the trade showed a sudden improvement / surge. The operation strategy adopted by major shipping companies of slow steaming or extra slow-steaming aggravated the shortage (Mon- gelluzzo 2010:53).
  • 14. M99 EKM Masters Dissertation Mithun Sasidharan (3986736) Page 14 CHAPTER 3 RESEARCH METHODOLOGY
  • 15. M99 EKM Masters Dissertation Mithun Sasidharan (3986736) Page 15 3.1 TYPES OF RESEARCH METHODS AVAILABLE Research is a systematic and methodical process of enquiry and investigation of a certain specific chosen topic of researcher’s area of interest that also increases knowledge and develops qualities and skills of the researcher to communicate the understanding of the research area. 3.1.1 Research qualities and skills 3.1.2 The Research process and stages The fundamental stages in the research processes common to all types of research are as follows: 1. To identify the topic for research. 2. To define the research problem. 3. To identify the way research is to be conducted. 4. To collect the information and data required. 5. To analyse and interpret the information/ data collected and recommend researcher’s views. 6. Finally to write the dissertation in the format decided and to get the approval. 3.1.3 Research Methodology The main different types of researches classified on the basis of the purpose of the research are Ex- planatory research, Descriptive research, Analytical and Predictive research and also Quantitative and Qualitative research. Explanatory research: Explanatory research is carried out when the research problem being considered doesn’t have any earlier studies to which researcher can refer to, for infor- mational materials about the issue to be discussed. The main objective of this type is to look for pat- terns or hypothesis and not to confirm a hypothesis. The focus of explanatory research is to gain the insight and familiarity with the topic for further investigation deep into it at a later stage. Explanatory PERSEVERANCE IT SKILLS INTELLECTUAL SKILLS INDEPENDENCE MOTIVATION ORGANISATIONAL SKILLS COMMUNICATION SKILLS
  • 16. M99 EKM Masters Dissertation Mithun Sasidharan (3986736) Page 16 research includes flexible techniques like case studies, historical analysis and observations which can be useful in giving both qualitative and quantitative details. The research assesses whether new theo- ries should be developed or whether the existing theories and concepts can actually be applied to the problem. This method concentrates on collection of wide range of impressions and data. Descriptive research: Descriptive research describes the phenomenon as they exist. This normally is used to ob- tain required information on the characteristics of an issue. Descriptive research follows a quantitative collection of data and goes further to examine a particular problem as it is used to describe the charac- teristics of the issue concerned in the problem being considered. According to Collis and Hussey (1997), Analytical or Explanatory Research: In this case, the researcher analyses and explains why or how the characteristics of research is happening and aims to realise the phenomena by measuring and finding out the reasons for such happening and to find out the questions whose answers can be the solutions to the issues. Major element of explanatory research is to control the variable of research activity to identify critical ones. Predictive Research: Predictive research goes further than the de- scriptive research and even further than the explanatory type. Here this forecasts the likelihood of happening of the same type of events or situations which can or which are occurring elsewhere and focus on generalising the causal link by predicting certain happenings and its phenomenon from cer- tain hypothesis and general relationships. This type of research provides the answers for ‘how’, ‘why’ and ‘where’ to the present events also for similar events in the future. Quantitative and Qualitative Research: Quantitative and Qualitative research are differentiated on the basis of the approach adopted by the researcher. Quantitative research involves the collection and analysis of numerical data and even statistical tests and concentrates on measuring the phenomenon. This is objective in nature. Qualitative research includes the examination and reflection of perceptions to gain and understand the social and human activities. This is subjective in nature. Applied and Basic Research: Applied re- search is designated to apply the findings from it to solve specific, existing issue being considered where as on the other hand basic research is the pure or fundamental form of research (Collis, Hussey 1997). 3.2 CHOOSING THE RIGHT METHODFOR RESEARCH Methodology is related to the overall approach that researcher takes towards a research process from theoretical concepts about it and also analysis of the data collected. The methodology to be considered in the research is concerned with many factors like: - What are the data collected - Why are certain data collected - Where is the data origin - When is the data collected - How has been the data obtained - How is the data being analysed Research paradigm describes the scientific practice and philosophies of how research should be con- ducted. The two major research paradigms are Positivistic paradigm and Phenomenological paradigm. Positivistic approach looks into the fact or causes of social phenomenon with having little concern to the subjective state, whereas phenomenological paradigm relates to the understanding of human be- haviour from the participants’ own frame of reference. Result of criticisms of positivistic paradigm leads to phenomenological paradigm. Choosing a research methodology concentrate also on type data, location, reliability, validity and generalisability of the data collected. Deciding on which methodolo- gy to be used is depended on the choice the researcher have and its limitation by the number of fac- tors. It starts by considering researcher’s constrains regarding research problem and also the paradigm
  • 17. M99 EKM Masters Dissertation Mithun Sasidharan (3986736) Page 17 issue. Methodologies related to research paradigm are associated with positivistic or phenomenologi- cal types and even the decision to mix both the methodologies (Collis, Hussey 1997). 3.3 PRIMARY AND SECONDARY DATA AVAILABLE Primary data is the original data collected by the person actually doing the research. It is the original data that is collected at the source like the survey data obtained through questionnaires or observations and experimental data gathered by making experiments in a controlled situation. On the other hand, the Secondary data is that information collected from already existing sources from books, document, published statistics and reports, company accounts and personal internal records of organisations. 3.4 FRAMEWORK SELECTED FOR RESEARCH Chapter 1: This gives an introduction of maritime shipping industry and provides an outline of dif- ferent categories of cargo vessels mainly dry cargo ships, liquid cargo ships and gas carrier vessels. This section also focuses on the main aims and objectives of the research topic being considered. Chapter 2: Outline of economic crisis provides the in depth knowledge of what exactly is economic crisis and the history of maritime shipping before and after the crisis and a look into the development of containerisation. Chapter 3: Research Methodology gives a knowledge regarding the types of research methods avail- able and factors to consider in choosing the right method among the above types. This also provides the primary and secondary data available and describes the frame work selected for the thesis. Chapter 4: This chapter gives the report which includes the swot analysis of maritime shipping logis- tics in relation to recession and also gives the main reason for the cause of economic crisis and how shipping field especially dry bulk carrier cargo was affected with the same. Chapter 5: This section deals with the literature review of the report. According to ‘Gill and Johnson’ (1991: 21), critical review of literature ‘should provide the read with a statement of the state of the art and major questions and issues in the field under consideration’. The review includes the effect of financial recession on the maritime shipping and the loss or problems the companies faced due to the crisis and the counter policies and actions adopted by them. Chapter 6: This particular chapter considers the case studies of three major shipping companies around the world. Mitsui O.S.K. Lines is a Japanese shipping company which had to face a great problem during the crisis and they had taken vital steps in tackling the issue and maintaining their business in world trade. European and American shipping business is also looked into and considered for investigation for the same. Chapter 7: Critical analysis of the recession effect on maritime shipping as a whole is considered from the literature review and the case studies investigated. Chapter 8: This chapter deals with the major learning outcomes from the thesis and the areas for fur- ther research which can be considered. Chapter 9: The final chapter consists of references and appendix used for the research.
  • 18. M99 EKM Masters Dissertation Mithun Sasidharan (3986736) Page 18 CHAPTER 4 REPORT/ REVIEW
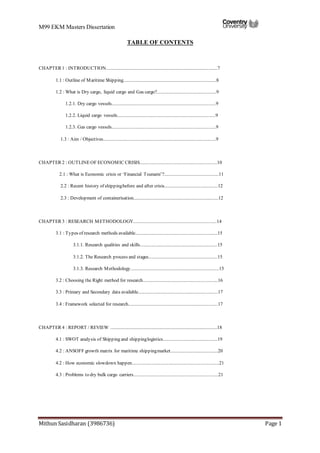
  • 19. M99 EKM Masters Dissertation Mithun Sasidharan (3986736) Page 19 4.1 SWOT ANALYSIS OF SHIPPING AND SHIPPING LOGISTICS SWOT analysis is a strategic tool to categorically identify and then use it to approach for analysing internal and external organisational environment. It is a strategic framework and is a specific planning tool in understanding any company’s potential areas of strength and weaknesses. Controllable Internal factors are strengths and weaknesses and uncontrollable external elements comprises of opportunities and threats. The proper evaluation and utilisation of SWOT analysis is very vital for any firm for its strategy to be successfully implemented (Chermack, Kasshanna 2007: 383). Fig. 1 SWOT Analysis Various shipping companies around the world have identified the strength, weakness, opportunities and threats in their industry by conducting SWOT analysis techniques and this enabled them to adopt necessary measures for dealing with each situation and have been classified in common, below under respective category: Strength: Shipping is the most common form of world trade and a major portion of world trade is carried out using merchant ships. The location of ports in major continents as in China, Singapore, South and North America, and the European nations are highly suitable for the easy transfer of raw materials, oil and other finished products. Countries like Japan, China and US have trade with the shipping industry giants of Maersk, CMA-CGM, NYK, APL, K Lines, and NOL etc. The investment by the Chinese steel industry has boosted the trade between the raw material, iron ore exporting na- tions and the Asian power house. This has developed the shipping logistics sector extensively. The fast and powerful recovery from the 2008-09 financial recessions by the powerful economies of the world has also assisted in the improvement of shipping sector. Even though most of the European na- tions are yet to recover from the crisis, the nations including China, Brazil, India and even Japan have showed a quick recovery and these nations have a leading role in the shipping logistics sector and in- ternational trade. Weakness: The effect of economic downturn has led most companies to lay off their vessels which are mostly dry cargo types including car carriers, bulk carrier vessels and also con- tainer ships. This was mainly due to the impact of crisis on the global automobile sector and bulk car- go sector and has resulted in adverse effect on the marine employees. The congestion occurring in the major ports which trade raw materials like iron ore and coal have also had its negative impact on shipping and shipping logistics. Opportunities: The post recession recovery particularly in the Asian industries have given a good scope for the shipping sector and its logistics to compensate for the loss- STRENGTH WEAKNESS OPPORTUNITIES THREATS
  • 20. M99 EKM Masters Dissertation Mithun Sasidharan (3986736) Page 20 es incurred and move forward with the new trade routes in the future. The LNG trade is too on the rise and is a boon to the shipping sector. Countries like China, Brazil etc have a faster growing economy and the improving relationship between these trading nations are helping the shipping industry to achieve new heights after the big dip during the recession. Threats: With the opportunities comes the threat for the marine shipping industry. The nations of USA and Europe are still weak in recovering from the downturn and together with the currency crisis and issues are posing a hindrance to the fast growth of shipping trade. The political crisis in the oil rich Middle East, the natural calamities like earthquakes and tsunamis and the rising piracy attack trouble are still the biggest threats to the ship- ping and shipping logistics. 4.2 ANSOFF’S GROWTH MATRIX OF MARITIME SHIPPING MARKET Ansoff Matrix is used by any organisation to developed specified strategies considering its product – market options in order to achieve new growth heights. This is achieved after studying the matrix and understanding the opportunities based on existing and new markets/ products in the future (Richard- son 2007). EXISTING PRODUCT NEW PRODUCT EXISTING MARKET Market Penetration Product Development NEW MARKET Market Development Diversification Fig. 2 Ansoff’s Growth Matrix Market Penetration (Existing products into Existing Market): It is studied that 80% of the compa- ny’s profits are generated from 20% of its customers and hence it is very essential to retain the exist- ing customers particularly when the market faces adversity or crisis. The importance of relationship and mutual understanding between the customers, business partners and suppliers is being realised by the company. Market Development (Existing product into New Market): Companies try hard for keeping their business intact and to maintain market position particularly during crisis when the shipping trade is stagnant. The main advantage of the company entering new markets with existing products is that it offers opportunity to make more profits and market share. Product Development (New Products into Existing Market): Development of product and related innovations is vital for the companies to stay competitive in the fluctuating market. Importance of market segmentation is required even though it might costs more and might take more time. Diversification (New Products into New Markets): The process of diversification can be highly risky, mainly during the time of financial slowdown but it provides better opportunities for new business. This normally takes place by the process of merging and acquisition of companies like that of NOL took over the control of APL (Cupman 2009).
  • 21. M99 EKM Masters Dissertation Mithun Sasidharan (3986736) Page 21 4.3 HOW ECONOMIC SLOWDOWN HAPPENED? In the late 90s, major Asian economies, South Korea, Singapore, Indonesia, Thailand, and Hongkong etc experienced crash in their stock market and suffered great strains for banks and other financial intermediaries. This situation of serious economic crisis or recession caused their GDP to fall and their currencies to get plunged. Unlike the other South American countries, which experienced similar situation earlier where the government expenditure were not able to compensate with very low taxes, the Asian countries had financial systems which were bank based that had very little transparency. Allen and Gale (2007) considers that, in the past there were stock market crashes in 1929, banking crisis in the year 1930, recession in Brazil and Mexico in 1962, Great Depression, crisis in US in the last half of 19th century etc. Many economies and respective government adopted necessary actions that controlled the cause of recession mainly during 1945- 1971. Bank of England developed and adopted effective stabilisation policies which helped them to ensure economic stability. France also didn’t experience financial downturn from 1882 till 1924. In the US, First bank of United States and the second bank of US were formed and these federally chartered financial banks had branches all around US which played a major step to tackle crisis but later on troubles from within these institu- tions created smoke of crisis in the US. In banking, the investors really worry regarding soundness of the financial institutions where they have invested their funds and when in panic, they withdraw the funds and hold it within themselves in the form of liquid currencies. Seriousness of the crisis is de- pended on the currency/ deposit ratio. Since major banks hold liquid cash reserves in the form of cur- rencies, they had huge reserves as deposits in other banks for the sake of interests they receive. The banks could pay these interests as they lent the currencies received, as ‘call loans’ in the stock market to buy stocks on margin. Hence it is obvious that there is a link between panic in financial institutions or banks and stock market crashes (Allen and Gale 2007). The occurrence of both banking crisis and currency crisis together known to be as ‘Twin Crisis’ which frequently occurred when commitment to the gold standard had gone weak at earlier stage. Later fixed exchange rate system and strong banking regulations were introduced. Major cause of ear- lier crisis in the 1930s is believed to be as a result of market, which was considered as the problem and regulatory steps adopted by respective government were the solution. Conversely at present situa- tion, it is believed that inefficient macroeconomic policies adopted by inconsistent government in the financial system is the major cause for recession and market forces emerge as the solutions (Allen and Gale 2007). 4.4 PROBLEMS TO DRY BULK CARGO CARRIERS The maritime trade between trading nations around the globe had a great impact due to the drastic change in the economic outlook. This had a very major effect on the dry bulk cargo sector which transported a major percentage of trading commodities with more than 60% of the world bulk traffic trade done by the capsize vessels of 100,000 DWT and more. One of the major business sectors was the import of iron ore from Australia and South America to China for its steel industries. The Lon- don’s Baltic Dry Index, key element that measures shipping commodity trade by bulk carriers re- vealed the effect that the recession had on the world trade particularly the Chinese steel industry and hence bulk carrier trade. According to the Michael Broad, President of Shipping Federation of Cana- da, “Like everywhere else, we have experienced a steep decline of dry bulk and break-bulk cargo in all trades due to the global financial / economic crisis. In the last quarter of 2008, we estimate the ton- nage figures of various commodities were down between 10% and 25% at Canada’s main ports”. The overall dry bulk cargo trade in Vancouver declined by 9% during the recession time. Even the other sector of dry cargo fleet that includes project cargo and heavy lift cargo which seemed unaffected had
  • 22. M99 EKM Masters Dissertation Mithun Sasidharan (3986736) Page 22 also shown signs of softening in their demand. Global leading nations have released massive econom- ic stimulus packages in the hope of improving global cargo demand and hence trade. The sector of bulk carriers had faced the extreme heat of recession in years 2008-09 and in the early months of 2010. Drop in the dry cargo vessel rates affected the employees of maritime shipping and the business profit of major shipping companies. The financial crisis and turmoil had resulted in worsening the dry bulk cargo trade but yet another adverse factor for this sector was the over capacity especially in the dry bulk sector of iron ore and coal trade mainly due to the huge overhang of new ships on order dur- ing the previous years. (Ryan 2009). Fig. 3 World sea tonnage (UNCTAD cited in The Economist 2010). The global financial slowdown continued to affect the performance of many ports around the world during the crisis period of 2008-09. In the particular case of Canadian port of Quebec, the percentage of total trade traffic was reduced by 21% in 2009 in comparison to its previous year. The main reason for this cause was presumed to be the drop in dry bulk volumes of iron ore, coal etc. Most steel indus- tries in the US and China, which were the main importers of iron ore were working at lower produc- tion capacity (Canadian sailing 2010). According to Jan Beringer, president and CEO of Rohde & Liesenfield Canada, “the current shipping market is one of uncer- tainty and that has created a dramatic downturn in freight rates, most predomi- nantly in the bulk trades, but even now in the project cargo sector.” The world sea trade reduced by 4.5% in the crisis period but the merchant fleet volume rose by 7% which created over capacity, decline in demand of vessels even during the period of recovery and extra pressure on freight rates and marine companies’ business prof- it (The Economist 2010).
  • 23. M99 EKM Masters Dissertation Mithun Sasidharan (3986736) Page 23 CHAPTER 5 LITERATURE REVIEW
  • 24. M99 EKM Masters Dissertation Mithun Sasidharan (3986736) Page 24 5.1 Effects on shipping, losses incurred and actions adopted by the maritime industry The world economy witnesses its largest fall of 6% in the global growth during the crisis period of 2008-2009 during when the financial downturn was started in the financial centres of advanced econ- omies and then spread to other nations around the world. This also involves the decline in stock mar- kets, decline in credits and currencies and even decline in the employment rates. The impact of crisis in the dimension of Economy of each country can be viewed as the difference that has occurred in the GDP of each country from its peak to that dip during the recession. The impact on financial markets of each affected country can be viewed or measured by the difference in its stock market index during the turmoil which will also be reflected in the flow of capital and the collapse occurred in the credit growth (Llaudes, Salman and Chivakul 2010). Major Asian emerging economies of India, China and Indonesia reacted to the financial crisis situation effectively and they tackled it to avoid the danger of recession and to an extent succeeded in dealing with it. The US and Europe were adversely affected with US economy and employment falling considerably and European economy worsening due to the downturn and still in crisis. Even though Asian countries were less affected, Indian GDP fell to 5.3 from near double digits and China’s GDP, which always maintained double digit import and export rates dipped to about 6%. The main issue in this period was the effect this had on the European and US trade mainly from the China’s decline in market that caused fall in the trade of East West and Intra Asian region with the increase in oil price hike making the problem worse. The exports from the Asian countries to US and Europe which were 34% in 2006 dipped to a low of 28.7%. This was main- ly due to the worsening of economies of US and Europe with slow rate of recovery and also the free trade agreement and formation of association (ASEAN) among the Asian economies (King 2012: 20). Fig. 4 U.S. Exports and Imports in the last 10 years (U.S. Census Bureau cited in King 2012: 20) In the year 2008, when the prices of crude oil dipped from $147 a barrel to $60, the shipping compa- nies were not able to make the most of the situation as a reason of the economic recession which con- tinued till 2009-10. Much of the gain that would have been utilised by the maritime companies in terms of slashed oil prices went in vain by the lowering of shipping freight volume caused due to re- duced trade, which first started only in the world automotive sector and then gradually spread to other
  • 25. M99 EKM Masters Dissertation Mithun Sasidharan (3986736) Page 25 cargo commodity sectors. As a result of the global credit crunch and hence fall in shipment, leading maritime companies like A.P. Moller Maersk, Giant Alliance of MOL, APL and Hyundai reduced the freight volume/ capacity. Maersk even suspended one of the Asia Europe marine service, MOL took decision of lay down of some of its dry cargo fleet vessels. In short, the maritime shipping companies could not take the advantage created by the reduction in fuel or oil barrel price, as this decline hap- pened much faster than the market recovery (Hoffman and Gallagher, 2008). The vessels due to get delivered in the year 2008-’09 were getting delayed, the situation being more critical in the Europe- Asia trade route where the freight rates are lowered in comparison to the African, South American and also trans Atlantic routes. The post recession periods in the year 2010, when a lot of shipping compa- nies have recovered from the downturn or are in the path, have witnessed some industry giants being ready to afford to wait out the challenging situation on the Asia – Europe route, and Maersk even or- dered for ten new 18,000 TEU ships, Hanjin ordering five 13,000 TEUs, CMA-CGM of France for three 16,000 TEU vessels and Mediterranean shipping ordering for larger ships of 14,000 TEUs and more (Barnard 2011: 41). Fig. 5 World’s Top Ten Container Carriers and fleet composition [As of June, 2012] (Barnard 2011: 42) Carriers particularly in the Asia-Europe trade route increased the freight rates for maintaining capacity cuts and during the peak season after the crisis recovery specifically the spot rates for the 20- foot containers increased three folds from $500 to $2000 on certain specific trade routes. But the introduc- tion of huge vessels by the industry giants of carriers of more than 16000 TEUs actually increased the pressure on them as the trade witnessed a downward decline mainly due to the European crisis and the slowing economy in China, which is a major source of imports and exports as shipping industry at present is concerned, together with the increase in the bunker prices. The trade from China to Europe fell by 2%, Japan’s and S. Korea’s export by 9.4% and 17.7% respectively. At the same time trade to U.S. from China’s export grew up by 12.8% and also Japan and Korean export saw new heights. With the expected delivery of mega capacity ships for many of the ocean carrier companies, things have gone worse in terms of maintaining capacity. All the negative ramifications caused due to recession in the global industry, China’s slow economic growth and financial trouble in the U.S. created signifi- cant adverse affects on the shipping companies/ carriers (Bernard 2012).
  • 26. M99 EKM Masters Dissertation Mithun Sasidharan (3986736) Page 26 The world GDP declined by 1% during the financial crisis of 2007-10 and trade volume by 25% in a single year. Most ship owners have suffered from diminishing profits, the ordering of new ships have been stopped and many vessels have been running on slow steaming and many laid off. The causes of recession mainly are reduction in demand in the industry for services due to poor economic growth and also trade volume together with the imbalance created between the supply and demand due to the sudden dip in the demand side which then led to overcapacity. This unavailability of trade financing during the recession is considered by many experts as the main reason for quick spread of the crisis in the global maritime industry. Even with the economic downturn and financial crashes in the global economy, maritime transportation accounts for a huge part of International trade with newer ports be- ing developed in emerging economies to join the maritime logistic network worldwide and increase in size of the vessel and fleet. Major problems caused during recession were that of overcapacity, supply of tonnage, demand drop and dip in the freight rates. The world container ship fleet expanded during the recession period. The liner market, Mearsk, MSC, CMA CGM, MOL, NYK and K Lines in par- ticular, developed during the period from 2000 to 2010 even though recession had its effects on them. Even later this period saw the increase in size of the liner ship which can be cost saving in terms of economies of scale. This in turn led to the development of existing hub and port to accommodate higher volume and larger size vessels (Chew et al 2011). Fig.6 Growth rate of supply and demand in global container shipping (Chew E.P. et al 2011) The impact of recession in the global car making automotive industry is high in the developed coun- tries. It is learned that there was a severe shortage in the capacity of car carriers due to insufficient orders in the past, the main reason for this being the failure of forecasting and anticipating the rapid growth of the market that occurred in the post recession recovery period. The Japanese manufactures increased their production and export of cars mainly to Middle East. The volume of cars shipped worldwide witnessed a huge hike from 7.5 million cars a year in 1980 to almost 16 million in 2008. But the industry was not able to forecast the magnitude of this huge growth. It is seen that shortfall of 10% of cars a year means that 1.5 million cars were not shipped. Downturn in the US automotive sec- tor and also slow recovery in the European economy increased the imbalance between the demand and the capacity or volume transhipped. Even though the demand for the car carrier sector are increas- ing at a very high rate, the decision for shipping companies to order for newer ships is clouded, for the reason being the uncertainty among the car manufactures and shipping companies of what lies ahead
  • 27. M99 EKM Masters Dissertation Mithun Sasidharan (3986736) Page 27 and also due to the economy of car carrier sector. The current economic recession and recovery, fluc- tuating oil prices and exchange rates have had a great impact on the automotive manufactures’ future production level and location of production plants to make it more responsive to customer demands. The loss of capacity due to fall in trade made the shippers to decide to run their vessel on slow steam- ing which actually reduces bunker costs and is more economical and also have the added advantage of reducing harmful emissions to environment. Capacity of car carrier market increased from 15.2 mil- lion in 2008 to 17.5 million in 2010. Besides the higher cost of manufacturing car carrier vessels in order to meet the high demand in tonnage and to meet the balance between supply and demand, it takes nearly 3-4 years for the manufacture of a new vessel from the date of order till the delivery to take place to the customer, i.e. to get delivery of 10 ships, the ship owners have to wait for about 4 years. In short, the increase in cost of ship manufacturing due to increased raw materials and steel prices, together with the uncertainty of the cargo within this 3-4 years of production particularly with regards to car carriers due to the change in customers’ preference for type of cars, would add to the present crisis situation (Thomas 2008: 48). The period prior to the recession had witnessed a boom in the car carrier sector with industry facing shortage of capacity for a higher demand which made the shippers to order for larger ships capable of carrying of about 8000 cars which when got delivered in the recession period created additional problems during this time for the shippers. The vehicle trans- portation had boomed for decades prior to the financial downturn that had a greater adverse impact in this sector. The volume of global sea trade had grown by about 9.7% a year during the boom phase before 2008 when it got halted by the crisis. Together with the car carriers, the ro-ro (roll on – roll off) sector too were affected badly due to crisis as the construction , manufacturing, agricultural and transportation equipments like tractors, bulldozers, railcars etc witnessed dip in their demand due to global trade collapse. Many of the companies had to diversify their trade into other sector of shipping that again added pressure on the vehicle carriers. For instance, ICO terminal which was an automobile terminal in Belgium was turned into port of break bulk cargo facility (Bernard 2010: 18). Top leading vehicle carriers including NYK, MOL, K Lines of Japan and Wilhelmsen Wallenius of Norway too suffered from the downturn. The recovery in this sector saw the vehicle carrier picking up the business in late 2009, when the world economy emerged from recession and this sector was assist- ed by projects driven by government. The vehicle carrier sector have taken necessary actions to re- cover by balancing the supply and demand which had included laying up and scrapping of some of their carrier vessels. The recovery has been steady with the emerging markets of developing econo- mies of the world including China, Brazil, India etc entering and investing in the automotive sector and this helps this sector to keep up with the pace of recovery with these visible changes in trade pat- terns mainly in these emerging countries (Bernard 2010: 18). Reefers are those types of containers with temperature controlled cargo sections in it maintaining it as required depending on the type of cargo it carry, chilled, frozen or warm. The temperature sensitive cargo is powered from external power source and these types of container carrying vessels had struggled in the financial crisis period. But in comparison to other cargo carriers like the bulk carriers and ro-ro vessels, the effect or reces- sion on the reefer carriers are much lower for the reason that the downturn in the economies of the trading countries have very little impact on the food industry and the customers have to eat and have not changed their eating habit, also food shortage was not a part of the crisis and have not happened during this time. Instead shipping industry witnessed a rise in the market volumes of certain compa- nies, of the reefer containers for about 10% in 2008 compared to its previous year, and most of them being the export of frozen and fresh pork from Canada to Australia and New Zealand and also frozen fish and meat from the Far East countries. The reason for the lesser impact of financial downturn on refrigerated cargo vessels includes the absence of over capacity in reefer sector as it is seen in dry cargo vessels and also the fact that to operate modern reefer container vessels is much cheaper than
  • 28. M99 EKM Masters Dissertation Mithun Sasidharan (3986736) Page 28 the old types of conventional ships. But the recession impact and the slow recovery in the US led to shortage of reefer equipments in the North America which affected the shipping logistics and frozen cargo was held in cold storages for quite a long time. Since 2008 witnessed a very little impact of re- cession on the temperature controlled reefer container sectors, major shipping companies including Maersk and Safmarine invested a lot in this sector of reefer equipment and services, with a forecast of profit in the future and to attract market and business (Canadian sailings 2009). The container shipping industry too faced the real heat of global economic downturn which led to many shipping companies to sink, some of them to merge with others, and also forced to make chang- es in the acquisition terms which existed previous years. The shipping industry adopted strategies to adjust with the issue of over capacity during reducing demand. Financial turmoil erupted in the con- tainer industry when the supply and demand for the ship capacity were out of balance. The recession in the container industry led the credit market to crash and ultimately led the lenders to squeeze the borrowers who were in debt for acquiring new container ships. The volume of growth rate dropped which reduced carrier’s revenue but the operating costs and fuel prices remained on the higher part. The growth in the container vessel space was exceeding its demand and the difference was still wid- ening since more ships were delivered later on in the next 2-3 years. The ship owner took evasive ac- tions to reduce the effect of crisis by managing the vessel capacity particularly in the Trans pacific and Trans Atlantic routes, also by adopting the policy if slow steaming of merchant ships for more economical fuel consumption and even took policy of shuffling the vessel routes and newer vessel sharing agreement. Some ship owners have adopted policies to lay off their ships more often to those in the Asia Europe route and even to cancel new orders. According to Neil Dekker of Drewry Ship- ping Consultants, “If a number of large orders were to be cancelled; this would help the supply- de- mand balance”. But since the ships, which were ordered before the crisis when the business was bright, are being delivered in huge number, the carriers are finding it hard to put them due to over ca- pacity. For bigger ships ordered during favourable conditions in 2007-08 and which are delivered in 2010-11, the global economic crisis recovery was not uniformly faster to accommodate the huge ton- nage of this amount. Hence the ship carriers keep continuing to trim the vessel capacity. Some of the carriers even tried to turn the chartered ships back to the owners after the lease period which also adds more pressure on the charter market which increased the capacity for the charter market like that of the freight market. Charter rate and freight rates have fallen by 10% and 50% respectively during the period which meant that all the shipping lines lost the money in the trade particularly in Europe Asia route and most carriers cancelled the services in the transpacific and Asia Europe route. Some of the carriers took decision for putting the vessels for maintenance in the dry docks which extended longer than normal and some others in lay off in the mid sea, for instance, in Iceland the Icelandic carrier named Emiskip had uncertainties over its long term financing due to the financial turmoil affect on Iceland’s economy and also shipping industry (Leach 2008: 12). In the year 2007, the economic slow- down was visible in the container shipping industry when the price of crude oil dropped significantly and the price of primary industrial metals like aluminium, nickel, steel etc fell dramatically. This af- fected the balance between supply and demand of the capacity of container vessels which ultimately led to reduction in demand for containerised import from Europe, Japan and U.S. which were the de- veloped economies. This means that cargo demand for satisfying the supply of vessel capacity was not enough mainly because of the delivery of newer vessels. Developing nations like India and China are comparatively less affected by the economic slowdown for the reason that their exports are less depended on the foreign trade but still are affected because global industrial slowdown have occurred in the international trading world. The main factors that eat up the vessel capacity are the port conges- tion, trade growth, slow steaming of ships and faster recovery in the Asia- Europe route. In short, higher vessel delivery order and schedule for the same will create overcapacity which became una-
  • 29. M99 EKM Masters Dissertation Mithun Sasidharan (3986736) Page 29 voidable. The shipping companies or the carriers are also much worried about the rising cost of the bunker fuel oil together with the overcapacity (Leach 2007). The year 2008-09 also witnessed major fall in the break-bulk and project cargo shipping industry mainly in the Asian sector. These sectors are subject much to seasonal conditions. Cancellations and delays in projects were visible most com- monly in the infrastructure sector of projects from Canada to Australia. Asian countries especially China were less affected comparatively. New orders in the break-bulk and heavy lift sector saw a re- duction in this period, but the overall impact of recession on the break-bulk and project cargo sector was found to be stable even though smaller suppliers were adversely affected. In the Middle East re- gion, even with the global economic crisis, the impact was very less severe of the project related trade from China. Some of the affected nations delayed or cancelled few of their infrastructure projects. This delays and cancellations will bother the logistic challenges adversely and will in turn affect down the supply chain including the suppliers, shippers and the third party logistics and to the engineering firms. In short the global financial crisis altered the dynamics of break-bulk project shipping sector (Biederman 2009). The heavy lift market witnessed delivery of new ships despite the crisis and the issue of overcapacity in this sector was only short termed. Long lead times and lack of access to cred- its have affected the sector in slowing down many projects which means less cargo on the shipping lines. The recession has reduced new orders and some huge projects, for instance in Middle East sec- tor have been delayed. Some companies have decided to postpone projects to negotiate for the freight rates and also for the price of raw materials which dropped globally. The effect of impact on this sec- tor of heavy lift cargo sector is much less regarding that happened to container and dry bulk cargo sector. In comparison to the crisis in 1990 where there were a lot of cancellations in this trade, that didn’t appear to happen in this period of recession (Nodar 2009: 28). Table 1 Comparison of profit and losses before and post recession of major shipping companies MARINE SHIPPING COMPANY PROFIT BEFORE CRISIS PERIOD LOSS DURING CRISIS SEASON A.P. Moller Maersk $1.05 billion $373million Neptune Orient Lines $121million $245million Hapag Lloyd $24.5million $302million Hanjin Shipping $92million $191million NYK Lines $610million $262million Mitsui O.S.K. Lines $576million $136million K lines $226million $155million (Leach, Mongelluzzo 2009: 13)
  • 30. M99 EKM Masters Dissertation Mithun Sasidharan (3986736) Page 30 David Beiderman (2010) suggests that, considering the situation as a whole, the economic recession which affected the shipping industry has created problems in the relationship between shippers and third party logistics providers. The process of building up of ties between them started when the re- covery was happening bit faster than expected where the shippers have started to invest more on 3PLs. All the steps taken during the crisis period for cost cutting had left the supply chain network out of balance and both parties are adjusting to the alterations and modifications adopted in the trade sce- narios during recession. It is learned that most successful shipping companies were those who had adopted good change management techniques. The economic recession have led a huge number of carriers and shipping logistics providers out of business and this has led to shippers searching for more competitive and prospective third party logistic providers with excellent track records and effi- cient knowledge of the industries. Shippers are engaging more volatile 3PLs in more strategic way. According to senior vice president of a global 3PL company Jim Butts, “When I started in this busi- ness, we heard that customers didn’t want to put all of their eggs in one basket, but now they are say- ing there are a lot of shaky baskets out there”. Global downturn created uncertainty and influenced many company’s supply chain in the management of transportation of goods under the total landed cost principles. The post recovery period saw the companies focussing more on the global competition in business and managing the supply chain complexity and new rules and regulations rather than con- centrating on the survival techniques. The uncertainty mentioned includes natural calamities as in Ja- pan, political unrests as in the Middle East, availability and costs of raw materials from the suppliers as seen by the rules in India to stop the export of cotton which was the world’s largest exporter of it etc, which adversely have impacts on the supply chain. Companies realised the importance of risk management together with cost management. They also learned that flexibility, forecasting and resili- ency are key factors to be taken into consideration in the scenario of economic uncertainty, fuel price volatility and other risks in the industry. This visibility and forecasting is necessary for the customers to prepare and be cautious against the economic fluctuations in terms of costs and currencies and re- duced cycle times (Biederman 2011). The figure below represents the order book of ships yet to be delivered which is shown to be 42% of present capacity and worth US $500 million during November 2009 (Clausius 2009: 89). Fig.7 Order book of ships (Clarkson research Studies cited in Clausius 2009: 89)
  • 31. M99 EKM Masters Dissertation Mithun Sasidharan (3986736) Page 31 During these period where most of the shipping companies reported losses including Japanese top three major container lines, Maersk, Mediterranean and few rare others announced rate hike on their major lines including Asia- Europe, trans Atlantic and also trans pacific even with the economic downturn hitting the industry hard and most of them trying aggressively to withstand the market com- petition. These companies were trying to adopt counter cyclical policy to defeat the financial down- turn. In this scenario, most shippers were concerned in adjusting and protecting to the bunker fuel price hike and this led the freight rates to deteriorate. The shippers still believe that the balance be- tween the supply and demand still remains the prime deciding factor to stay afloat in the business (Leach, Mongelluzzo 2009: 17). The year 2008-09 witnessed huge swing in the freight rates and vessel capacity and contract negotia- tions among the carriers, shippers and providers and the huge shoot up in the global oil prices. The industry gradually picked up and recovered which saw an improved balance developing between the vessel capacity and the industry market demand. For instance, North American trade route, which was struggling with very low rates and volume for couple of years, witnesses a sharp recovery in the ves- sel’s market demand which actually outpaced the ocean capacity. The crisis period had a very slow rate of contract signing and some contracts had even extended. The carriers and shippers were com- pelled to enter into long term contracts due to the sharp swing in rates (Mongelluzzo 2011). One of the most important strategies that govern the shipping is the balance which exists between the supply and the demand in this sector. The growth of global economies resulted in the increase in the demand for shipping relative to supply. This high demand in turn resulted in creating strong markets. But ever since crisis have occurred, it changed the scenario especially with the slowdown in China which is one of the major trading nation importing raw materials from Australia, Brazil and other na- tions for its infrastructural and manufacturing processes and also in exporting finished products. It is very unfortunate for shipping industry in having its supply outstripping its demand in the industry with lower freight rates. So it is essential for the industry to focus on both supply and demand and in particular, give more stress and attention in demand. The supply side comprising availability of ships, capacity of vessels and ports are important but the demand side which comprises developing the glob- al trade and business and also economic activities and risk assessment are more vital. The shipping rates are driven by the utilisation ratio between the supply and market demand and the freight rates are also depended on commodities, trade developments, oil prices, raw material prices and availability, the availability of finished goods and port congestion and delays (Lorange 2009). The market collapses of recent times have led to a loss of nearly $15 billion and many companies are reviving by adopting the policy of merging and acquisition among struggling carriers. Some of the examples for this are the Hapag-Lloyd’s acquisition of CP Ships, Maersk’s acquisition of P&O Nedlloyd and NOL taking over of APL. Strategically the mother companies are in better position than they were before taking over which helped them to reduce their carrier cost and other benefits. It is observed that mostly container sector are much better for merging and acquisition than compared to fragmented bulk shipping companies (Bonney 2011: 1). Yet another policy adopted by major shipping giants to tackle crisis was to lay off their vessels keeping them out of service and also scrapping their older vessels. NYK, K Lines and MOL of Japan have scrapped their older ships much earlier than they had planned due to the recession. Norwegian company Wallenius Wilhelmsen decided to lay off 20% of their vessel and among the entire above, majority were from the automotive sector. Another step adopted by Hoegh Autoliners is to increase the volume of other heavy cargo including heavy lift and project cargo in the car carriers to compensate for the vacant ballast journeys. Some shipping
  • 32. M99 EKM Masters Dissertation Mithun Sasidharan (3986736) Page 32 companies re-evaluated and changed their service/ voyage routes which witnessed more carriers building and developing their base in terminals in the emerging economies of India and China (Biederman 2009). The hard time of the recession period was visible by the growing number of ves- sels being laid off or scrapped. The reduction in demand and fall in trade together with the delivery of newer ships created serious surplus of capacity in the dry cargo fleet, for about 1.6 million TEUs of extra capacity hit the industry which were practically not required. According to Widdows, chairman of World Shipping Council and Transpacific Stabilisation Agreement, “My own view is that this is much deeper and longer than anything we’ve seen in the past. We’ve got companies around the world that is going bust every day. It’s a cycle. Companies go bust, people are unemployed, and it reinforces the desire to hold cash whether you’re an individual or a company”. The new deliveries which added the surplus extra capacity and the economic slowdown together created big trouble for the shippers who had taken measures against the increase in capacity (Leach 2008: 9). The serious tension among the shipping industry during the crisis period was how much long will this logistical nightmare effect last and how severe it is going to be. Not only was the effect visible on the smaller companies, even the Asian car manufactures, who were the leading section among the au- tomakers were struggling with the economic downturn which happened during the awkward time for them when the industry boom saw these owners ordering for new vessels of huge size and had to plan for adopting necessary counter policies. The effect was obvious and clearly visible for older and less fuel efficient vessels which were laid off or scrapped during this time, but was also visible in the sec- tion of new deliveries which struggled mainly because of overcapacity and slashing demand for carri- ers due to failure in global trade growth. The three Japanese giant automotive carriers namely MOL, NYK and K Lines adopted counter actions of excess capacity and yen- dollar exchange rate troubles, by lying off some of their vessels at anchorage and some of them to scrap yard. The world’s largest automakers, Toyota, which overtook General Motors, had to consider alternative suppliers to stay afloat in the market (Dibenedetto 2009). Contrary to the market happening, some carriers still invested in the ordering of newer vessels even though economic crisis had pulled their profits down dampening the demand and led them to trouble of excess capacity. Some carriers, for example, BBC and Beluga still continued to invest in new heavy lift speciality ships. The ship owners were confident enough of the market compromise with the new deliveries and hence were willing to take that risk. For some owners, heavy scrapping of vessels over 20-25 years old would help to reduce the effect of surplus capacity and believed that over capaci- ty is not caused by new delivery vessels but from not scrapping and getting rid of old vessels. A vital fact about the scrapping of ships is that, older ships which are being sent for scrap yard are 20 years aged or more and are very old general cargo type where as new delivery ships are vessels of much more efficient performance and capacity. Hence even if owners keep scrapping and order for new ships, the company gets benefit of acquiring more and more efficient vessels. According to Mark Page, Director of liner shipping at Drewery Shipping Consultants (London, U.K.), “if demand keeps going up and there’s a shortage, people are keen to capitalize. But get a market that flips and moves into something with excess capacity, and you want to have smaller ships. The larger ones are the ones most exposed to risk.”(Nodar 2009). Apart from the ship owners, some manufacturers, retailers and even shippers formed crisis manage- ment teams in the fear of disruptions caused by global recession and to adopt serious tactical steps to tackle it more efficiently and to cope up with the flexible markets of their logistics and transportation providers. The team programme comprise discussions and meetings between the major financial and executive officers, manufacturers, logistics providers, and the sales team for adoption of steps to tack- le the crisis situation from getting more troublesome. Issues regarding delay in payment from the
  • 33. M99 EKM Masters Dissertation Mithun Sasidharan (3986736) Page 33 companies, slashing liquidity and reduction in the shipment volumes have compelled the supply chain providers to form such crisis management teams. Collapse of about 2700 truckers, struggle for the warehouses and increasing job cuts in the financial crisis period shows how the recession had its ef- fects on them. For some companies the suppliers have began to demand for immediate payment on delivery for the materials where previously they had a mutual trust on the consumers to have the pro- cess of payment at a later stage. It is seen that more powerful companies get stronger in the industry as their competitors got out of the business without able to cope up (Hoffman 2008). 5.2 Credit crunch effect on the seaports For nearly two decades prior to the global credit crunch or financial crisis, the business of internation- al ports and hub witnessed huge profits and increase in volume which had in turn led to port conges- tions. The sea trade market and industry business was developing so rapidly, more than the develop- ment rate of the terminal facilities. But the seaborne trade and volume saw drastic decline. With the demand in sea trade got hit badly due to global economic downturn, eventually the port services too got affected and the port dues / fees were adjusted to the change and shift in cargos between ports took place. Major categories of container cargo were that of food, chemicals, consumer goods and intermediary cargos. The effect of crisis on food flow was comparatively less hard as the food con- sumption is not hit by the recession. The chemicals, mainly used in cars, pints, medical equipments etc were hit strongly by the crisis whereas consumer goods, which are mainly imported into Europe, were moderately affected. The intermediary container cargo mainly used to manufacture capital or consumer products are also among the highly affected sector. These all indicators reveal the depth of the crisis impact. In the container section, the reefer containers were much less affected than the dry freight cargo with only 5% reduction in the comparison with 23% for the dry cargos. The case of refinery products even showed slight reduction in performance but for this product, the demand reduction has not completely led to similar effect on the production reduction. The container sector of iron ore mainly supplying for the steel plants for automotive industry too experienced an expected reduction in its flow due to trade halt in the automobile sector crisis. Also the coal cargo imports, mainly used in steel production in powered electricity plants suffered loss due to decline in its sector and its energy consumption. Before the crisis, the shippers had worked along with stevedores but later these shipping lines started to work in line with the port facilities termed as terminal operating companies (TOC). The port authorities took necessary steps during the recession mainly with the help of stakeholders in their development and also helping other ports mutually. But as a whole the loss incurred by the port was less in compar- ison with the shipping lines. In a nut shell, the port business had its effect of crisis but was not much severe that it still remains good in business. The improvement of port facilities played a major role in the fast recovery of maritime supply chain (Pallis, Langen 2010). The recession has had its effects more on the developed economies than the emerging nations where the GDP growth were about 3-4% when the developed economies witnessed negative growth. Its sig- nificant impact was seen expectedly also on the maritime shipping, ports and logistic providers and the depth and extend of crisis specified the considerable long term impact that it is going to have on all related fields. The number and volume of ships in the East West route had declined considerably where as Asian region could see much lighter effects. It led to reduction in capacity and dip in the shipping freights mostly in the above mentioned routes and particularly in container sector.
  • 34. M99 EKM Masters Dissertation Mithun Sasidharan (3986736) Page 34 Table 2 Change in fleet capacity of major shippers during the crisis period. SHIPPING LINES PERCENTAGE CHANGE IN FLEET CAPACITY SHIPPING LINES PERCENTAGE CHANGE IN FLEET CAPACITY MAERSK - 8.0 APL - 19.9 CMA CGM - 2.1 MSC 11.6 MOL - 15.1 HYUNDAI - 11.9 K LINES - 21.9 EVERGREEN - 2.4 NYK - 11.6 MISC - 27.2 (Slack 2010) Now when the recovery was expected in late 2009, the delivery of new ships made over capacity an issue and shipping companies had to lay off some of their cargo vessels to compensate and adapt to the situation. The recession, its recovery and the issues related to it made the shipping companies, port authorities and also the concerned government to take latest technological and management measures for faster re-structuring of its respective economies. The industry realised the need for transparencies among the shippers, port facilities, stakeholders and logistic providers for better information sharing and improvement. Brian Slack (2010) suggests that the economies of US and EU countries had suf- fered hugely because of financial tsunami where as South Asia and other emerging nations had its minor effect mainly due to the decline in trade with the developed economies. One another major step adopted by the shipping companies were the re-routing of the Asia to West trade to Europe going around the Cape of Good Hope in the Africa instead of passing the Suez Canal to avoid the heavy toll of the canal ($800,000 per transit) and to have longer voyages to compensate the capacity draught issue. The problem of congestion of ports in the US west coasts had lightened a bit during recession when some companies changing their trade routes toward East coast ports and Gulf. This changing pattern led to more stress in the port development in the developing economies. Recession recovery period had witnessed more government involvement in the development and in- vestment in the port and shipping sector which had seen increasing privatisation during pre crisis terms mainly for the reason that government of any nation recognised the importance of shipping trade and port infrastructure for the improvement of economy of their respective nations. The recov- ery period of crisis had put the shippers and port authorities under pressure to take stringent steps in terms of environment issues and to make their entire supply chain more greener in terms of reduction in oil spills and hazardous gases and chemical disposals, to deal with the disposal of ballast water and antifouling paints and also sewage/ garbage issues. Most developed nations had taken actions to ad- vice the shippers to protect their coastline and environment and use low sulphur fuel to prevent harm- ful air emissions. The changes adopted in the ports and shipping industries are for long life and hence the adoption of stringent measure especially more strict Marpol rules made life of shipping companies more difficult (Slack 2010).
  • 35. M99 EKM Masters Dissertation Mithun Sasidharan (3986736) Page 35 5.3 Credit crunch effect on the Supply chain The supply chain sector of every organisation brings about a major portion of revenue and profit and when the companies face fierce competition in the market, its supply chain feels the pressure for prompt and better performance. . Director of Supply Chain Risk Management practice at Marsh, Gary Lynch considers that “threats to the supply chain are fundamentally predictable, we know disruptions will occur, but there are too many variables to know the impact on the supply chain”. Major issues for the shipping supply chain to be alert of are:  Economic recession (as that happened in recent times 2008-10)  Natural disasters (Japanese tsunami, Iceland volcanic eruption)  Export strikes (as in restriction of cotton exports in India)  Quality control issues etc. During economic crisis, new techniques and scenarios had been adopted by the maritime companies and its supply chain for staying competitive in the flexible market condition. One of the major adap- tive policies that played a major role for the European regional companies was the CEE strategic loca- tion factor (Raluca et al 2010: 83). Prior to the crisis, shipping companies were concerned about the quality of the end product and supply risk but soon after recession, concentration was much on the liquidity/ solvency risks related to financial disruptions. Recession effects have led the increase in supply of automobile supplies from China and India to South America to almost double volume, which made the supply chain of existing companies under stress and additional new suppliers had to be introduced. Some companies like UPS supply chain solutions shifted its customers between modes for preventing excess inventory caused as a result of the volatility in supply and demand which creat- ed an imbalance in the supply chain balance (Biederman 2011). According to the data from U.S. con- sultancy firm Delcam, about 300 billion dollars were lost in the revenue for U.S. business logistics and supply chain firms. The impacts caused by the financial tsunami, particularly in the manufactur- ing sector have – through the ‘bullwhip effect’- amplified the after effects through the entire supply chain causing damage to company’s financial status. Every company had to stress more on crisis management and forecasting, develop new techniques/ technologies than the old traditional way of doing trade. In this context, Reiner and Fichtinger (2009) introduced new dynamic model for evaluat- ing the improvement of process in the performance of supply chain. In the global maritime trade sce- nario, at present all the major shipping companies try to expand their supply chain internationally and hence to withstand the market competition, outsourcing of logistic activities and precise performance of supply chain is of vital concern (Chang, Lin 2010). In the Far East, supply chain meant a relationship between the entire ‘chain’ in the organisation from the initial suppliers to the end customers with the later controlling the major decisions and the rela- tionship. Supply chain relationships were found more effective and efficient than the traditional lo- gistic approach mostly called as the Just In Time (JIT) approach which had commenced in the Toyota manufacturing system. During recession in the Far east, supplier – customer relationship remained unaffected with customers being the decision makers. Hence the company could add or remove firms in the bottom portion of the supply base. But in west, situation during the crisis was not so mainly because of the lack of trust between the suppliers and customers and both won’t move forward to- gether easily. Recession affected in the Far East where Japan and South Korea suffered due to decline in the demand from customers for manufacturing goods mainly in the automotive sector (Lamming 2000).
  • 36. M99 EKM Masters Dissertation Mithun Sasidharan (3986736) Page 36 5.4 PESTEL analysis of maritime supply chain: PESTEL analysis is a framework used by major international shipping companies for identifying the opportunities and risks in and outside the organi- sation and also to develop specific strategies based on the same. PESTEL stands for Political, Eco- nomic, Social, Technological, Environmental and Legislative/ Legal factors. Fig. 8 PESTEL analysis diagram Political Factors: One of the recent highlights in this section was the political unrest in the Middle East which resulted in the Oil price hike. The 9/11 incident in the United States made the regulations and additional requirements stricter even in countries outside U.S. Economic Factors: Current recession which influenced the fluctuations in the international economy resulted in decline in demand of cargo and hence shipping trade. Import and export restrictions were more frequently visible and crisis led bankruptcy resulted in financial crisis. Social Factors: Globalisation have resulted in suppliers, traders and customers from the entire supply chain being from different nationalities and many a times it creates unexpected tensions in the links of the supply chain. This different social atmosphere creates its own adverse effects. Technological factors: The supply chain is getting influenced by unexpected changes and risks in the field of IT or telecommunication system crisis. New and latest innovations in IT are very much need- ed for the companies to stay competitive. Environmental Factors: Supply chain of every shipping company gets affected largely by the natural disasters like tsunami, volcanoes etc. and even the new stringent rules for the protection of environ- ment which are different for different regions adds more pressure on the industry’s supply chain. Legal Factors: Customs and terminal regulations too have major impacts for the trade between inter- national countries. The formation of EU for example has made difference to the supply chain provid- ers in the Europe. Every organisation recognises the need for making their supply chain strong and secure. According to U.S. president Barack Obama, “Securing the global supply chain while ensuring its smooth function- ing is essential to our national security and economic prosperity”. Cost efficiency and the relationship between suppliers, customers and other business partners are the vital factors influencing supply chain performance (Wright 2012).
  • 37. M99 EKM Masters Dissertation Mithun Sasidharan (3986736) Page 37 5.5 Credit crunch effect on the marine environment A huge number, estimated to be around 10% of dry bulk vessels which were unemployed or out of business for period more than 3 months, were lying at anchorage at deep sea, majority of them in the South East Asian area –Singapore, Malaysia and Philippine waters- where the toll for the anchorage is low comparatively. This caused the huge steel hull of the vessel to stay afloat in touch with the sea water for a long period without movement resulting in extensive quantity of bio fouling marine spe- cies to come in contact with the ship surface and get attached to it. Also the vessel carries out ballast operations transferring sea water containing micro organisms from one continental region to another for the technical reason of adjusting stability. This two processes result in movement of marine spe- cies from a region to another where this may not be suitable and can cause harm to the environment of that region. When an extensive layer of micro species are present on the ship’s hull, it causes re- sistance to the flow of water by what is called as ‘hydrodynamic drag’ that results in reduction in ves- sel’s speed and increase fuel consumption. The ship owners hence apply anti fouling paints on the vessel hull to get rid of the bio fouling organ- isms, which require considerable movement of the ship. When the recession affected productivity and trade, hit badly on the dry bulk sector,owners were forced to lay off many of their vesselat anchorage which had adverse affect on the performance of these anti fouling paints which in turn resulted in the micro organisms to come in touch with the ship surface. The vessels laid off at anchorages accumulat- ed the bio fouling organisms from the sea water as well as from the adjacent vessels which were then, during recovery when the trade improved, transported to another region around the globe. Most of these recovering vessels finding voyages were unlikely had their hull cleaned. Many others were planned for Dry docks where they clean the hull but since the availability of these were very difficult, it made the vessels to move their hull unclean and even if the owners invested in refurbishing the hull, it was not practically possible to clean the remote areas of the hull, and also of propellers, rudders, thrusters blocks etc. This resulted in transporting and transferring of organisms around the globe caus- ing marine environmental issues. Latest rules provide stringent rules for ballast water exchange and anti fouling paints to protect the ocean species (Floerl, Coutts 2009). Impact of globalisation during the start of twenty first century led to boom in the maritime sector with huge development in port infrastructure and ship building sector. But the scenario was followed by immediate change in global trade and business and the crisis impact was clearly visible in the mari- time transport sector that had implemented new changes and strategies in view of designs and tech- niques. The process by which shipping companies chose various ports around the world for trading their seaborne cargo had changed and new methodologies were adopted based on many factors- the cost incurred, capacity and infrastructure facilities, stevedore availability and service, geographic lo- cation, connection to sea route and the risk involved. These in turn assisted the port authorities to in- crease their market share. It is learned that shippers and agents are concerned not only with the flow of goods from one manufacturing or assembling point to its destination port, but also the behaviour of all the above factors in order to sustain their business in the struggling market. The recession had seri- ous affects directly on the ports caused by the decline of sea cargo trade volume worldwide and is in- dicated by the drastic dip in the operational capacity of the ports and port equipments and harbour workers. When a lot of major international ports including Hamburg suffered from the financial crisis loss, ports of South East Asia, mainly Indonesia and Arabic hubs changed into being priority ports for Europe. Also US west coast ports of Los Angeles and Oakland had developed during the crisis where majority of US development were seen normally in the east coastal ports prior to the crisis. Since the