2. June 29, 2016
The State Tax Equalization Board has established a Common Level Ratio for each county in the
Commonwealth for the calendar year 2015. The ratios were mandated by Act 267-1982.
The law requires the State Tax Equalization Board to use statistically acceptable techniques, to
make the methodology for computing ratios public and to certify, prior to July 1, the ratio to the Chief
Assessor of each county each year.
The statistically acceptable technique which the Board used for the 2015 Common Level Ratio is
to determine the arithmetic mean of the individual sales ratios for every valid sale received from the
county for the calendar year 2015.
The methodology used is to include every valid sale from 1% to 500% to compute an average
mean. Using this average mean as a base, the State Tax Equalization Board has defined high and low
limits by multiplying and dividing this computed average mean by 4. After the high and low limits are
defined, the extreme upper sales ratio limit is 200%. Using these computed limits, the State Tax
Equalization Board has utilized the valid sales, rejecting those sales which exceed the limits. The
resulting arithmetic mean ratio is the ratio which the State Tax Equalization Board is certifying as the
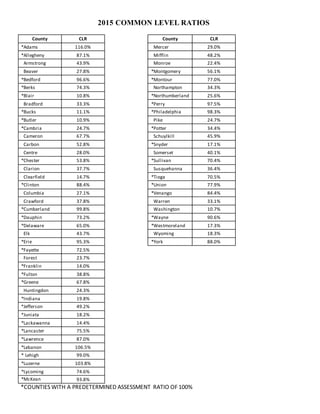
Common Level Ratio for each county for 2015.
The Common Level Ratios for 2015 are listed on the back of this page.
STATE TAX EQUALIZATION BOARD
Peter Barsz, Board Chairman
Daniel G. Guydish, Board Member
Anthony Pinizzotto, Board Member
Local Government Services – State Tax Equalization Board/Tax Equalization Division
400 North St., 4th
Floor | Commonwealth Keystone Bldg. | Harrisburg, PA 17120-0225 | 717.787.5950 | F 717.214.5318 | newPA.com