McKinsey Survey: European B2B decision maker response to COVID-19 crisis
•
0 likes•4,300 views

As governments and organizations continue to work toward containing COVID-19 and stem the growing humanitarian toll it is exacting, the economic effects are also beginning to be felt. Through a series of regular, global surveys, we are tracking how customers’ expectations, spending, and behaviors are changing throughout the crisis across multiple countries over time.

Recommended
Recommended
More Related Content
More from McKinsey on Marketing & Sales
More from McKinsey on Marketing & Sales (20)
Recently uploaded
Recently uploaded (20)
McKinsey Survey: European B2B decision maker response to COVID-19 crisis
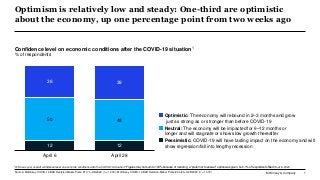
- 1. McKinsey & Company 1 Optimism is relatively low and steady: One-third are optimistic about the economy, up one percentage point from two weeks ago Confidence level on economic conditions after the COVID-19 situation1 % of respondents 12 12 50 48 38 39 April 6 April 28 Optimistic: The economy will rebound in 2–3 months and grow just as strong as or stronger than before COVID-19 Neutral: The economy will be impacted for 6–12 months or longer and will stagnate or show slow growth thereafter Pessimistic: COVID-19 will have lasting impact on the economy and will show regression/fall into lengthy recession Source: McKinsey COVID-19 B2B Decision-Maker Pulse #1 4/1–4/6/2020 (n = 1,400); McKinsey COVID-19 B2B Decision-Maker Pulse #2 4/20–4/28/2020 (n = 1,473) 1Q: How is your overall confidence level on economic conditions after the COVID-19 situation? Figures may not sum to 100% because of rounding; a “prefer not to answer” option was given, but <1% of respondents filled it out in 2020.
- 2. McKinsey & Company 2 Europe is slightly less optimistic compared to other regions 12 12 11 9 12 18 12 10 41 13 12 10 43 48 47 47 50 49 50 29 19 48 58 51 41 45 39 42 43 37 33 39 68 71 10 30 37 50 2 FranceAll countries ItalyAll Europe Germany UKSpain China India Japan S. Korea Brazil US Confidence level on economic conditions after the COVID-19 situation1 % of respondents Pessimistic: COVID-19 will have lasting impact on the economy and will show regression/fall into lengthy recession Optimistic: The economy will rebound in 2–3 months and grow just as strong as or stronger than before COVID-19 Neutral: The economy will be impacted for 6–12 months or longer and will stagnate or show slow growth thereafter 1Q: How is your overall confidence level on economic conditions after the COVID-19 situation? Figures may not sum to 100% because of rounding; a “prefer not to answer” option was given, but <1% of respondents filled it out in 2020. Europe APAC 1% -9% 4% 7% 0% 0% 12% 3% 2% 8% -10% -5% Source: McKinsey COVID-19 B2B Decision-Maker Pulse #2 4/20–4/28/2020, (US n = 607), (France n = 219), (Spain n = 215), (Italy n = 407), (UK n = 218), (Germany n = 414), (China n = 443), (South Korea n = 200), (Japan n = 202), (India n = 411), (Brazil n = 419) 2% Percentage- point change in optimism between April 1–9 surveys and April 20– 28 surveys
- 3. McKinsey & Company 3 Europe has slowed its budget decline slightly and near-term spend reductions are expected to decelerate 1“About the same” refers to ±3% change in budget. 2Q: How has the coronavirus (COVID-19) situation affected your company’s budget for the following areas? Percentages may not add to 100 due to rounding. 3Q: How do you think spending on the following may change in the next two weeks? Percentages may not add to 100 due to rounding. 4Includes survey respondents from (France n = 219), (Spain n = 215), (Italy n = 407), (UK n = 218), (Germany n = 414). 5Includes survey respondents from (France n = 200), (Spain n = 200), (Italy n = 400), (UK n = 199), (Germany n = 400), (China n = 400), (South Korea n = 201), (Japan n = 200), (India n = 400), (US n = 619), (Brazil n = 400). Source: McKinsey COVID-19 B2B Decision-Maker Pulse #1 4/1–4/6/2020 (n = 1,400); McKinsey COVID-19 B2B Decision-Maker Pulse #2 4/20–4/28/2020 (n = 1,473) IncreasedAbout the same1Reduced 61 58 26 24 1813Europe4 Global5 55 54 26 24 19 21 April 9 April 28 56 43 29 33 16 24 50 42 28 32 22 27 April 28April 9 Company’s budget (changes already made)2 Expected in the next two weeks3 Spend shifts as a result of COVID-19 % of spend changes
- 4. McKinsey & Company 4 Respondents report downward budget shifts across all categories, with banking and insurance least affected to date 61 51 50 63 58 58 64 58 63 61 57 53 52 21 28 31 20 23 24 19 23 18 24 25 27 28 18 21 19 17 19 18 17 19 19 15 19 20 21 Banking and insurance Capital equipment Distribution and transportation Software and telecom Specialty inputs Commodity inputs Packaging Energy Processing supplies Finished goods Vehicles IT hardware Real estate Reduced IncreasedAbout the same3 Budget changes due to COVID-19 (changes already made)1 % of respondents Net intent2 Services Inputs Capex -44% -31% -32% -45% -39% -41% -48% -39% -44% -46% -38% -34% -31% Source: McKinsey COVID-19 B2B Decision-Maker Pulse #2 4/20–4/28/2020 (n = 1,473) 1Q: How has the coronavirus (COVID-19) situation affected your company’s budget for the following areas? Figures may not sum to 100% because of rounding. 2Net intent is calculated by subtracting the % of respondents stating they expect to decrease spending from the % of respondents stating they expect to increase spending. 3“About the same” refers to ±3% change in budget.
- 5. McKinsey & Company 5 Advanced industries are experiencing the most significant decline in budget across categories Source: McKinsey COVID-19 B2B Decision-Maker Pulse #2 4/20–4/28/2020 (n = 1,473) 1Budget net intent is described as the % of budget decreases subtracted from the % of budget increases. 2Q: How has the coronavirus (COVID-19) situation affected your company’s budget for the following areas? 3“About the same” budget changes are those that are +/- 3%. Budget net intent1 per category for each industry2 Overall industry net intent % where budget is about the same3 Advanced industries Technology, media, and telecom Global energy and materials Pharma and medical products Travel, transportation, and logistics Global finance, banking, and insurance Consumer/Retail Services Inputs Capex Specialty inputs Energy Processing supplies Packaging Commodity inputs Finished goods Software and telecom Banking and insurance Distribution and transportation Capital equipment IT hardware Vehicles Real estate 20 26 21 25 23 32 26 Net intent: % of budget decreases subtracted from the % of budget increases Below -50 -50 to -25 -25 to 0 0 to 25 25 to 50 50+
- 6. McKinsey & Company 6 In the next two weeks, budget decreases are likely to decelerate, with some pockets of budget increases emerging Source: McKinsey COVID-19 B2B Decision-Maker Pulse #2 4/20–4/28/2020 (n = 1,473) 1Net intent is described as the % of spending decreases subtracted from the % of spending increases. 2Q: How do you think spending on the following may change in the next two weeks? 3“About the same” spending changes are those that are +/- 3%. Net intent: % of budget decreases subtracted from the % of budget increases Below -50 -50 to -25 -25 to 0 0 to 25 25 to 50 50+ Next two-week spending net intent1 per category for each industry2 Overall industry net intent % where budget is about the same3 Advanced industries Technology, media, and telecom Global energy and materials Pharma and medical products Travel, transportation, and logistics Global finance, banking, and insurance Consumer/Retail Services Inputs Capex Specialty inputs Energy Processing supplies Packaging Commodity inputs Finished goods Software and telecom Banking and insurance Distribution and transportation Capital equipment IT hardware Vehicles Real estate 31 32 27 32 30 50 39
- 7. McKinsey & Company 7Source: McKinsey COVID-19 B2B Decision-Maker Pulse #2 4/20–4/28/2020 (n = 1,473) Technology, media, and telecom Global energy and materials Advanced industries Global finance, banking, and insurance Pharma and medical products Consumer/retail Travel, transportation, and logistics All industries are shifting capacity down in light of tempered demand; travel seeing sharpest decline Flat -15% Demand for products/ services Operational capacity (eg, production)3 Flat-15% Impact of COVID-19 on demand and capacity1,2 % change due to COVID-193 1Q: How has the coronavirus (COVID-19) situation affected your company’s production (operation) capacity? Percentages may not add to 100 due to rounding. 2Q: How has the coronavirus (COVID-19) situation affected demand for your company’s products/services? Percentages may not add to 100 due to rounding. 3Weighted average uses following midpoints: “increased/reduced 25+%” is +/- 30%, “increased/reduced 11–25%” is +/- 18%, “increased/reduced 4–10%” is +/- 7%, “About the same (+/- 3%)” is 0%.
- 8. McKinsey & Company 8 Companies are reducing marketing spend in all regions; more than 60 percent of European B2B companies have cut back 62 61 63 58 56 68 71 62 69 65 71 58 57 18 20 19 21 23 18 14 19 8 26 20 16 20 20 19 18 21 21 14 15 19 24 8 10 26 23 ItalyAll countries ChinaEurope France Germany UK JapanSpain India S. Korea Brazil US Europe APAC Marketing spend change1 % of responses 1Q: How has the coronavirus (COVID-19) situation affected your company’s marketing spend across all channels? Percentages may not add to 100 due to rounding. 2“About the same” refers to ±3% change in budget. IncreasedAbout the same2Reduced Source: McKinsey COVID-19 B2B Decision-Maker Pulse #2 4/20–4/28/2020, (US n = 607), (France n = 219), (Spain n = 215), (Italy n = 407), (UK n = 218), (Germany n = 414), (China n = 443), (South Korea n = 200), (Japan n = 202), (India n = 411), (Brazil n = 419)
- 9. McKinsey & Company 9 1Q: Prior to COVID-19, how important were each of these methods in delivering an overall outstanding sales experience? Please distribute 100 points across these two items, giving more points to the method that you believe is more important to you personally when interacting with your suppliers. 2Q: Now, thinking about the next two weeks given the environment with COVID-19, how important are each of these methods in delivering an overall outstanding sales experience? Please distribute 100 points across these two items, giving more points to the method that you believe is more important to you personally when interacting with your suppliers. 3Q: Prior to COVID-19, how important was each method in delivering an overall outstanding sales experience? Distribute 100 points across these items, giving more points to the method that you believe is more important to your customers. 4Q: Now, thinking about the next two weeks given the environment with COVID-19, how important are each of these methods in delivering an overall outstanding sales experience? Please distribute 100 points across these two items, giving more points to the method that you believe is more important to your customers. Source: McKinsey COVID-19 B2B Decision-Maker Pulse #1 4/1–4/6/2020 (n = 1,400); McKinsey COVID-19 B2B Decision-Maker Pulse #2 4/20–4/28/2020 (n = 1,473) 47 65 53 35 Before COVID-19 April 28 +40% 48 69 52 31 Before COVID-19 April 6 +45% Traditional Digital The importance of digital sales has doubled over that of traditional sales interactions since the onset of COVID-19 Importance of digital vs traditional to B2B buyers themselves1,2 Points allocated out of 100 Importance of digital vs traditional to B2B company customers3,4 Points allocated out of 100
- 10. McKinsey & Company 10 Digital and traditional, directed channels are now seen as the most beneficial for researching suppliers 1Q: What ways of interacting with a supplier would be most beneficial to you when researching/considering suppliers going forward? Rank up to 3 that would be most beneficial. A free-response option was given, but 0% of respondents filled it out in 2020. Most beneficial supplier interactions for researching/considering suppliers1 % of respondents ranking in top 3 Digital Self-serve Directed Self-serve Directed Traditional Source: McKinsey COVID-19 B2B Decision-Maker Pulse #1 4/1–4/6/2020 (n = 1,400) 25 21 18 17 13 24 19 8 18 17 17 15 11 26 22 16 Email from sales rep Post on social media/online Supplier website Referral from someone in my industry Online material from supplier Google/web search Customer referral Live chatInfo on mobile app Text from sales rep Industry publication Trade show Print material from supplier Meeting sales rep in person Call from sales rep Direct mail from sales rep
- 11. McKinsey & Company 11 When ordering from suppliers, B2B customers find value in a mix of omnichannel interactions 1Q: Which of the following methods do you/would you most prefer to use when submitting your order? Please rank up to 3 that would be most beneficial. Self-serve Sales rep involvementInternal processes Most preferred method for ordering1 % of respondents ranking in top 3 Source: McKinsey COVID-19 B2B Decision-Maker Pulse #1 4/1–4/6/2020 (n = 1,400) 47 34 36 34 40 33 27 26 Using a supplier’s website Using my company’s procurement department Using my company’s e-procurement portal Using a mobile app Using call center/customer service Calling sales repEmailing sales rep Ordering from sales rep in person
- 12. McKinsey & Company 12 The majority of companies that serve other businesses have shifted their go-to-market model in response to the COVID-19 crisis 52 46 49 43 3 21 39 56 48 3 In-person/field sales team (eg, meeting with customers face to face) E-commerce (eg, products/services sold directly online with no sales rep involved) Inside sales team (eg, interacting with customers on the phone) Online/web support (eg, chatting with customers via video/website/mobile app to support purchase) Other Before COVID-19 During COVID-19 Go-to-market sales model during COVID-191,2 % of respondents 97%3 shifted their GTM model during COVID-19 Source: McKinsey COVID-19 B2B Decision-Maker Pulse #2 4/20–4/28/2020 (n = 1,473) 1Q: In what ways was your company’s product or service sold before COVID-19? 2Q: Now today, in what ways is your company’s product or service sold during COVID-19? 3Q: Which of the following statements best describe the changes your company has made to its commercial and go-to-market model during COVID-19?
- 13. McKinsey & Company 13 E-commerce revenue is up more than 20 percent since the onset of COVID-19 Percent of company revenue driven by e-commerce before and during COVID-19 (among companies that sell online)1,2 Average % of total revenue 1Q: Approximately what percentage of your company’s revenue before COVID-19 was driven by…Figures may not sum to 100% because of rounding. 2Q: Approximately what percentage of your company’s revenue during COVID-19 is now driven by…Figures may not sum to 100% because of rounding. 49 59 During COVID-19Before COVID-19 +20% Source: McKinsey COVID-19 B2B Decision-Maker Pulse #2 4/20–4/28/2020 (n = 1,473)
- 14. McKinsey & Company 14 E-commerce share of overall B2B company revenue is up in all countries, most notably in Brazil and Italy Percent of company revenue driven by e-commerce before and during COVID-19 (among companies that sell online)1,2 Average % of total revenue 45 49 56 51 47 46 47 44 42 47 61 42 40 56 59 65 56 64 51 57 52 47 53 68 62 52 S. KoreaAll countries France Spain UKGermany Italy China JapanIndia Brazil USAll Europe 1Q: Approximately what percentage of your company’s revenue before COVID-19 was driven by…Figures may not sum to 100% because of rounding. 2Q: Approximately what percentage of your company’s revenue during COVID-19 is now driven by…Figures may not sum to 100% because of rounding. Before COVID-19 During COVID-19 Source: McKinsey COVID-19 B2B Decision-Maker Pulse #2 4/20–4/28/2020, (US n = 607), (France n = 219), (Spain n = 215), (Italy n = 407), (UK n = 218), (Germany n = 414), (China n = 443), (South Korea n = 200), (Japan n = 202), (India n = 411), (Brazil n = 419) Europe APAC 23% 16% 11% 21%36% 20% 12%13% 11% 46% 29%12% X% % change 20%
- 15. McKinsey & Company 15 14 31 43 9Much less effective April 6 Much more effective Somewhat less effective As effective as before Somewhat more effective 100 3 1Q: How effective is your company’s new sales model at reaching and serving customers? Figures may not sum to 100% because of rounding. 60% of B2B decision makers believe the new sales model is as effective or more so than prior to COVID-19 (up from 48% in early April) Effectiveness of new sales model in reaching and serving customers1 % of respondents Source: McKinsey COVID-19 B2B Decision-Maker Pulse #1 4/1–4/6/2020 (n = 1,400); McKinsey COVID-19 B2B Decision-Maker Pulse #2 4/20–4/28/2020 (n = 1,473) 21 35 32 8 April 28 100 5 48% as effective or more so compared to prior to COVID-19 60% as effective or more so compared to prior to COVID-19
- 16. McKinsey & Company 16 Companies are likely to keep their new sales model for more than 12 months after the onset of the COVID-19 crisis 78% are very likely or somewhat likely to sustain these shifts 12+ months after COVID-19 Staying power of new sales models1 % of respondents 1Q: Which of the following statements best describe the changes your company has made to its commercial and go-to-market model during COVID-19? Figures may not sum to 100% because of rounding. Source: McKinsey COVID-19 B2B Decision-Maker Pulse #2 4/20–4/28/2020, (n = 1,473) 28 50 19 3 Unlikely to sustain 12 months after Very likely to sustain 12+ months after Somewhat likely to sustain 12 months after NA, made no go-to-market changes
- 17. McKinsey & Company 17 More than 80 percent of B2B companies have adjusted incentives in response to the effects of COVID-19 38 26 18 16 13 10 Short-term bonuses/incentives More fixed incentives Lower quotas Higher quotas No change More variable incentives Sales team incentive structure changes in response to COVID-191 % of respondents 1Q: To what extent has your company made changes to the incentive structure of your sales team in light of COVID-19? Figures may not sum to 100% because of rounding. Source: McKinsey COVID-19 B2B Decision-Maker Pulse #2 4/20–4/28/2020, (n = 1,473)
- 18. McKinsey & Company 18 22 20 17 13 13 9 7 Advanced industries Global energy and materials Technology, media, and telecom Pharma and medical products Travel, transportation, and logistics Global finance, banking, and insurance Consumer/Retail 9 20 20 19 20 12 $500M to < $1B $1M to < $25M $100M to < $500M $25M to < $100M $1B to < $10B $10B+ 4 6 17 15 29 15 8 7 <50 100–499 50–99 500–999 50,000–99,999 1,000–9,999 10,000–49,999 100,000+ Survey respondents by no. of employees of company % of respondents1 Survey respondents by role in company % of respondents1 Survey respondents by industry % of respondents1 Survey respondents by annual revenue of company % of respondents1 20 15 15 13 10 8 7 6 6 Sales Operations IT/computer services Purchasing Top management Shipping/logistics Engineering R&D/Innovation/Product design Marketing B2B Pulse Decision-Maker Pulse #2: Respondent Overview Pulse #1 closed on April 6, 2020 Pulse #2 closed on April 28, 2020 1Percentages may not sum to 100 due to rounding. Source: McKinsey COVID-19 B2B Decision-Maker Pulse #2 4/20–4/28/2020, (n = 1,473)