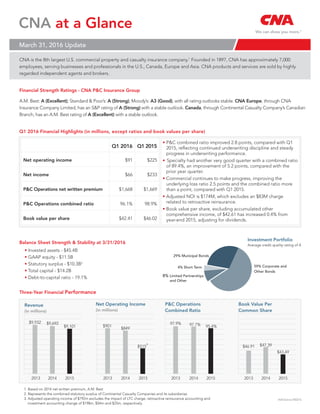
1. Revenue
(in millions)
20152014
$9,932
Three-Year Financial Performance
20152014
$515
3
$849
20152014
95.4%97.7%97.9%
2015
$46.91 $47.39
2013
$9,101
$9,692
2013
$901
2013 2013 2014
$43.49
AtAGlance 050216
Net Operating Income
(in millions)
P&C Operations
Combined Ratio
Book Value Per
Common Share
CNA at a Glance
A.M. Best: A (Excellent); Standard & Poor’s: A (Strong); Moody’s: A3 (Good), with all rating outlooks stable. CNA Europe, through CNA
Insurance Company Limited, has an S&P rating of A (Strong) with a stable outlook. Canada, through Continental Casualty Company’s Canadian
Branch, has an A.M. Best rating of A (Excellent) with a stable outlook.
Q1 2016 Q1 2015
Net operating income $91 $225
Net income $66 $233
P&C Operations net written premium $1,668 $1,669
P&C Operations combined ratio 96.1% 98.9%
Book value per share $42.41 $46.02
Financial Strength Ratings - CNA P&C Insurance Group
Q1 2016 Financial Highlights (in millions, except ratios and book values per share)
Balance Sheet Strength & Stability at 3/31/2016
• Invested assets - $45.4B
• GAAP equity - $11.5B
• Statutory surplus - $10.3B2
• Total capital - $14.2B
• Debt-to-capital ratio - 19.1%
1. Based on 2014 net written premium, A.M. Best
2. Represents the combined statutory surplus of Continental Casualty Companies and its subsidiaries
3. Adjusted operating income of $792m excludes the impact of LTC charge, retroactive reinsurance accounting and
investment accounting change of $198m, $54m and $25m, respectively
Average credit quality rating of A
Investment Portfolio
4% Short Term
29% Municipal Bonds
59% Corporate and
Other Bonds
8% Limited Partnerships
and Other
CNA is the 8th largest U.S. commercial property and casualty insurance company.1
Founded in 1897, CNA has approximately 7,000
employees, serving businesses and professionals in the U.S., Canada, Europe and Asia. CNA products and services are sold by highly
regarded independent agents and brokers.
• P&C combined ratio improved 2.8 points, compared with Q1
2015, reflecting continued underwriting discipline and steady
progress in underwriting performance.
• Specialty had another very good quarter with a combined ratio
of 89.4%, an improvement of 5.2 points, compared with the
prior year quarter.
• Commercial continues to make progress, improving the
underlying loss ratio 2.5 points and the combined ratio more
than a point, compared with Q1 2015.
• Adjusted NOI is $174M, which excludes an $83M charge
related to retroactive reinsurance.
• Book value per share, excluding accumulated other
comprehensive income, of $42.61 has increased 0.4% from
year-end 2015, adjusting for dividends.
March 31, 2016 Update