
Recommended
More Related Content
Viewers also liked
Viewers also liked (9)
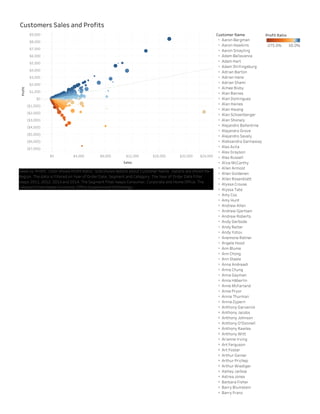
Customers Sales and Profits_
- 1. $0 $4,000 $8,000 $12,000 $16,000 $20,000 $24,000 Sales ($7,000) ($6,000) ($5,000) ($4,000) ($3,000) ($2,000) ($1,000) $0 $1,000 $2,000 $3,000 $4,000 $5,000 $6,000 $7,000 $8,000 $9,000 Profit CustomersSalesandProfits -275.0% 50.0% ProfitRatioCustomerName AaronBergman AaronHawkins AaronSmayling AdamBellavance AdamHart AdamShillingsburg AdrianBarton AdrianHane AdrianShami AimeeBixby AlanBarnes AlanDominguez AlanHaines AlanHwang AlanSchoenberger AlanShonely AlejandroBallentine AlejandroGrove AlejandroSavely AleksandraGannaway AlexAvila AlexGrayson AlexRussell AliceMcCarthy AllenArmold AllenGoldenen AllenRosenblatt AlyssaCrouse AlyssaTate AmyCox AmyHunt AndrewAllen AndrewGjertsen AndrewRoberts AndyGerbode AndyReiter AndyYotov AnemoneRatner AngeleHood AnnBlume AnnChong AnnSteele AnnaAndreadi AnnaChung AnnaGayman AnnaHäberlin AnneMcFarland AnnePryor AnnieThurman AnnieZypern AnthonyGarverick AnthonyJacobs AnthonyJohnson AnthonyO'Donnell AnthonyRawles AnthonyWitt ArianneIrving ArtFerguson ArtFoster ArthurGainer ArthurPrichep ArthurWiediger AshleyJarboe AstreaJones BarbaraFisher BarryBlumstein BarryFranz BarryFranzösisch BarryGonzalez BarryPond Salesvs.Profit.ColorshowsProfitRatio.SizeshowsdetailsaboutCustomerName.Detailsareshownfor Region.ThedataisfilteredonYearofOrderDate,SegmentandCategory.TheYearofOrderDatefilter keeps2011,2012,2013and2014.TheSegmentfilterkeepsConsumer,CorporateandHomeOffice.The CategoryfilterkeepsFurniture,OfficeSuppliesandTechnology.