Quinnipiac University Poll of PA Voters June 2014
•
0 likes•362 views

A poll conducted by Quinnipiac University of Pennsyvlania voters asking several questions about Marcellus Shale drilling in the state. The poll shows, as it has consistently shown since 2011, that Pennsylvanian's support drilling by an overwhelming majority.

Recommended
Recommended
More Related Content
More from Marcellus Drilling News
More from Marcellus Drilling News (20)
Recently uploaded
Recently uploaded (20)
Quinnipiac University Poll of PA Voters June 2014
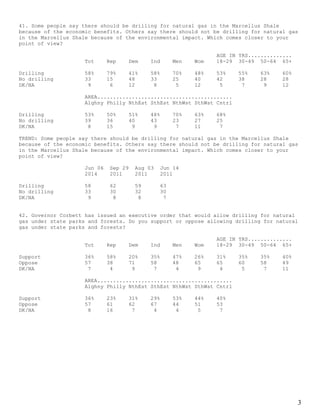
- 1. 3 41. Some people say there should be drilling for natural gas in the Marcellus Shale because of the economic benefits. Others say there should not be drilling for natural gas in the Marcellus Shale because of the environmental impact. Which comes closer to your point of view? AGE IN YRS.............. Tot Rep Dem Ind Men Wom 18-29 30-49 50-64 65+ Drilling 58% 79% 41% 58% 70% 48% 53% 55% 63% 60% No drilling 33 15 48 33 25 40 42 38 28 28 DK/NA 9 6 12 8 5 12 5 7 9 12 AREA........................................... Alghny Philly NthEst SthEst NthWst SthWst Cntrl Drilling 53% 50% 51% 48% 70% 63% 68% No drilling 39 36 40 43 23 27 25 DK/NA 8 15 9 9 7 11 7 TREND: Some people say there should be drilling for natural gas in the Marcellus Shale because of the economic benefits. Others say there should not be drilling for natural gas in the Marcellus Shale because of the environmental impact. Which comes closer to your point of view? Jun 06 Sep 29 Aug 03 Jun 14 2014 2011 2011 2011 Drilling 58 62 59 63 No drilling 33 30 32 30 DK/NA 9 8 8 7 42. Governor Corbett has issued an executive order that would allow drilling for natural gas under state parks and forests. Do you support or oppose allowing drilling for natural gas under state parks and forests? AGE IN YRS.............. Tot Rep Dem Ind Men Wom 18-29 30-49 50-64 65+ Support 36% 58% 20% 35% 47% 26% 31% 35% 35% 40% Oppose 57 38 71 58 48 65 65 60 58 49 DK/NA 7 4 9 7 4 9 4 5 7 11 AREA........................................... Alghny Philly NthEst SthEst NthWst SthWst Cntrl Support 36% 23% 31% 29% 53% 44% 40% Oppose 57 61 62 67 44 51 53 DK/NA 8 16 7 4 4 5 7
- 2. 4 43. Does Corbett's executive order make you more likely to vote for him, less likely, or doesn't it make a difference? AGE IN YRS.............. Tot Rep Dem Ind Men Wom 18-29 30-49 50-64 65+ More likely 13% 23% 5% 11% 16% 9% 11% 13% 11% 13% Less likely 39 19 55 39 33 44 47 41 37 33 No difference 46 57 37 47 50 43 41 44 50 49 DK/NA 2 1 3 3 1 4 1 2 1 5 AREA........................................... Alghny Philly NthEst SthEst NthWst SthWst Cntrl More likely 20% 4% 8% 13% 20% 16% 11% Less likely 39 42 45 42 32 37 35 No difference 38 47 46 43 48 45 52 DK/NA 2 7 1 2 1 2 2