
Recommended
Recommended
More Related Content
What's hot
What's hot (8)
More from Marc C. Bros de Puechredon
Recently uploaded
Recently uploaded (20)
World tourism day
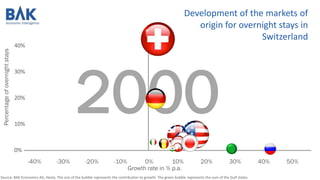
- 1. 2000 40% 30% 20% 10% 0% Growth rate in % p.a. -40% -30% -20% -10% 0% 10% 20% 30% 40% 50% Development of the markets of origin for overnight stays in Switzerland Source: BAK Economics AG, Hesta. The size of the bubble represents the contribution to growth. The green bubble represents the sum of the Gulf states. Percentageofovernightstays
- 2. 40% 30% 20% 10% 0% Growth rate in % p.a. -40% -30% -20% -10% 0% 10% 20% 30% 40% 50% Development of the markets of origin for overnight stays in Switzerland Source: BAK Economics AG, Hesta. The size of the bubble represents the contribution to growth. The green bubble represents the sum of the Gulf states. 2001 Percentageofovernightstays
- 3. 2002 40% 30% 20% 10% 0% Growth rate in % p.a. -40% -30% -20% -10% 0% 10% 20% 30% 40% 50% Development of the markets of origin for overnight stays in Switzerland Source: BAK Economics AG, Hesta. The size of the bubble represents the contribution to growth. The green bubble represents the sum of the Gulf states. Percentageofovernightstays
- 4. 2003 40% 30% 20% 10% 0% Growth rate in % p.a. -40% -30% -20% -10% 0% 10% 20% 30% 40% 50% Development of the markets of origin for overnight stays in Switzerland Source: BAK Economics AG, Hesta. The size of the bubble represents the contribution to growth. The green bubble represents the sum of the Gulf states. Percentageofovernightstays
- 5. 2004 40% 30% 20% 10% 0% Growth rate in % p.a. -40% -30% -20% -10% 0% 10% 20% 30% 40% 50% Development of the markets of origin for overnight stays in Switzerland Source: BAK Economics AG, Hesta. The size of the bubble represents the contribution to growth. The green bubble represents the sum of the Gulf states. Percentageofovernightstays
- 6. 2005 40% 30% 20% 10% 0% Growth rate in % p.a. -40% -30% -20% -10% 0% 10% 20% 30% 40% 50% Development of the markets of origin for overnight stays in Switzerland Source: BAK Economics AG, Hesta. The size of the bubble represents the contribution to growth. The green bubble represents the sum of the Gulf states. Percentageofovernightstays
- 7. 2006 40% 30% 20% 10% 0% Growth rate in % p.a. -40% -30% -20% -10% 0% 10% 20% 30% 40% 50% Development of the markets of origin for overnight stays in Switzerland Source: BAK Economics AG, Hesta. The size of the bubble represents the contribution to growth. The green bubble represents the sum of the Gulf states. Percentageofovernightstays
- 8. 2007 40% 30% 20% 10% 0% Growth rate in % p.a. -40% -30% -20% -10% 0% 10% 20% 30% 40% 50% Development of the markets of origin for overnight stays in Switzerland Source: BAK Economics AG, Hesta. The size of the bubble represents the contribution to growth. The green bubble represents the sum of the Gulf states. Percentageofovernightstays
- 9. 2008 40% 30% 20% 10% 0% Growth rate in % p.a. -40% -30% -20% -10% 0% 10% 20% 30% 40% 50% Development of the markets of origin for overnight stays in Switzerland Source: BAK Economics AG, Hesta. The size of the bubble represents the contribution to growth. The green bubble represents the sum of the Gulf states. Percentageofovernightstays
- 10. 2009 40% 30% 20% 10% 0% Growth rate in % p.a. -40% -30% -20% -10% 0% 10% 20% 30% 40% 50% Development of the markets of origin for overnight stays in Switzerland Source: BAK Economics AG, Hesta. The size of the bubble represents the contribution to growth. The green bubble represents the sum of the Gulf states. Percentageofovernightstays
- 11. 2010 40% 30% 20% 10% 0% Growth rate in % p.a. -40% -30% -20% -10% 0% 10% 20% 30% 40% 50% Development of the markets of origin for overnight stays in Switzerland Source: BAK Economics AG, Hesta. The size of the bubble represents the contribution to growth. The green bubble represents the sum of the Gulf states. Percentageofovernightstays
- 12. 2011 40% 30% 20% 10% 0% Growth rate in % p.a. -40% -30% -20% -10% 0% 10% 20% 30% 40% 50% Development of the markets of origin for overnight stays in Switzerland Source: BAK Economics AG, Hesta. The size of the bubble represents the contribution to growth. The green bubble represents the sum of the Gulf states. Percentageofovernightstays
- 13. 2012 40% 30% 20% 10% 0% Growth rate in % p.a. -40% -30% -20% -10% 0% 10% 20% 30% 40% 50% Development of the markets of origin for overnight stays in Switzerland Source: BAK Economics AG, Hesta. The size of the bubble represents the contribution to growth. The green bubble represents the sum of the Gulf states. Percentageofovernightstays
- 14. 2013 40% 30% 20% 10% 0% Growth rate in % p.a. -40% -30% -20% -10% 0% 10% 20% 30% 40% 50% Development of the markets of origin for overnight stays in Switzerland Source: BAK Economics AG, Hesta. The size of the bubble represents the contribution to growth. The green bubble represents the sum of the Gulf states. Percentageofovernightstays
- 15. 2014 40% 30% 20% 10% 0% Growth rate in % p.a. -40% -30% -20% -10% 0% 10% 20% 30% 40% 50% Development of the markets of origin for overnight stays in Switzerland Source: BAK Economics AG, Hesta. The size of the bubble represents the contribution to growth. The green bubble represents the sum of the Gulf states. Percentageofovernightstays
- 16. 2015 40% 30% 20% 10% 0% Growth rate in % p.a. -40% -30% -20% -10% 0% 10% 20% 30% 40% 50% Development of the markets of origin for overnight stays in Switzerland Source: BAK Economics AG, Hesta. The size of the bubble represents the contribution to growth. The green bubble represents the sum of the Gulf states. Percentageofovernightstays
- 17. 2016 40% 30% 20% 10% 0% Growth rate in % p.a. -40% -30% -20% -10% 0% 10% 20% 30% 40% 50% Development of the markets of origin for overnight stays in Switzerland Source: BAK Economics AG, Hesta. The size of the bubble represents the contribution to growth. The green bubble represents the sum of the Gulf states. Percentageofovernightstays
- 18. 2017 40% 30% 20% 10% 0% Growth rate in % p.a. -40% -30% -20% -10% 0% 10% 20% 30% 40% 50% Development of the markets of origin for overnight stays in Switzerland Source: BAK Economics AG, Hesta. The size of the bubble represents the contribution to growth. The green bubble represents the sum of the Gulf states. Percentageofovernightstays
- 19. 2018 Percentageofovernightstays 40% 30% 20% 10% 0% Growth rate in % p.a. -40% -30% -20% -10% 0% 10% 20% 30% 40% 50% Development of the markets of origin for overnight stays in Switzerland 1st half-yearSource: BAK Economics AG, Hesta. The size of the bubble represents the contribution to growth. The green bubble represents the sum of the Gulf states.