SlideShare a Scribd company logo
1 of 7
Download to read offline
Undergraduate Males
Race/ethnicity
Serve(d) in the army
Financial situation
Hours/week spent exercising
0.0%
10.0%
20.0%
30.0%
40.0%
50.0%
60.0%
70.0%
80.0%
White/Caucasian
Hispanic
Asian
Black
Middle Eastern
Pacific Islander
American Indian
0.0%
10.0%
20.0%
30.0%
40.0%
50.0%
60.0%
70.0%
80.0%
90.0%
100.0%
Never served
ROTC
Active
0.0%
10.0%
20.0%
30.0%
40.0%
50.0%
60.0%
Comfortable
No problem
Struggle
0.0%
5.0%
10.0%
15.0%
20.0%
25.0%
30.0%
35.0%
40.0%
45.0%
Less than 1
1hr - 4hr
5+
Hours/week spent on schoolwork
Average bedtime during the week
Average bedtime during the weekend
Average wake-up time during the week
0.0%
5.0%
10.0%
15.0%
20.0%
25.0%
30.0%
35.0%
40.0%
45.0%
50.0%
3 hrs or less
4 - 7 hrs
8+
0.0%
5.0%
10.0%
15.0%
20.0%
25.0%
30.0%
35.0%
40.0%
45.0%
9 PM - 10 PM
11 PM - 12 AM
1 AM - 2 AM
3 AM +
0.0%
5.0%
10.0%
15.0%
20.0%
25.0%
30.0%
35.0%
40.0%
45.0%
50.0%
9 PM - 10 PM
11 PM - 12 AM
1 AM - 2 AM
3 AM +
0.0%
5.0%
10.0%
15.0%
20.0%
25.0%
30.0%
35.0%
40.0%
45.0%
5 AM - 6 AM
7 AM - 8 AM
9 AM - 10 AM
11 AM +
Average wake-up time during the weekend
How many days/week you take a nap
Typical nap length
Times binge drinking in the past two weeks
0.0%
5.0%
10.0%
15.0%
20.0%
25.0%
30.0%
35.0%
40.0%
45.0%
50.0%
7 AM - 8 AM
9 AM - 10 AM
11 AM - 12 PM
1 PM +
0.0%
5.0%
10.0%
15.0%
20.0%
25.0%
30.0%
35.0%
40.0%
45.0%
None
1 - 2 days
3 - 4 days
5 days +
0.0%
5.0%
10.0%
15.0%
20.0%
25.0%
30.0%
35.0%
40.0%
45.0%
50.0%
<1 hr
1 - 2 hrs
2 - 3 hrs
0.0%
5.0%
10.0%
15.0%
20.0%
25.0%
30.0%
35.0%
None
1 -2 times
3 - 5 times
6 +
Most used substances
AUDIT scores
Intervened in situations
Why did you not intervene?
0.0%
2.0%
4.0%
6.0%
8.0%
10.0%
12.0%
14.0%
16.0%
Cigarettes
Marijuana
Amphetamines
Tranquilizers
Cocaine
Ecstasy
0.0%
10.0%
20.0%
30.0%
40.0%
50.0%
60.0%
70.0%
No - low risk
Risky drinker
High risk
Alcoholic threshold
0.0%
10.0%
20.0%
30.0%
40.0%
50.0%
60.0%
Someone drinking too
much
Someone experiencing
sig. emo distress
Someone using hurtful
language
Someone at risk of being
sexually assaulted
0.0%
5.0%
10.0%
15.0%
20.0%
25.0%
30.0%
None of my business
Didn't feel confident
Didn’t know what to do
Assumed someone else
would do it
Afraid of embarrassing
oneself
Afraid friends wouldn't
support
Felt unsafe
How competitive do you find the student body
Diagnosed disorders
Prescribed medications
Meeting threshold for disorders
0.0%
10.0%
20.0%
30.0%
40.0%
50.0%
60.0%
70.0%
Very competitive
Average
Not competitive
0.0%
1.0%
2.0%
3.0%
4.0%
5.0%
6.0%
7.0%
8.0%
Eating disorder
Anxiety Disorder
Mood Disorder
Attention
disorder/learning
disability
Substance Abuse
Disorder
0.0%
1.0%
2.0%
3.0%
4.0%
5.0%
6.0%
Psychostimulants
Anti-anxiety
Sleep Medication
Antidepressants
0.0%
5.0%
10.0%
15.0%
20.0%
25.0%
30.0%
35.0%
40.0%
Generalized Anxiety
Disorder
Major Depression
Eating Disorder
Days/week emotional/mental problems hurt academic performance
NSSI
How often did you hurt yourself
Suicidal thoughts/attempts
0.0%
5.0%
10.0%
15.0%
20.0%
25.0%
30.0%
35.0%
40.0%
45.0%
50.0%
None
1 - 2 days
3 - 5 days
6 +
0.0%
1.0%
2.0%
3.0%
4.0%
5.0%
6.0%
7.0%
8.0%
Punched/banged object
to hurt self
Punched/banged self
Bit self
Scratched self
Pulled own hair
Burned self
Cut self
0.0%
2.0%
4.0%
6.0%
8.0%
10.0%
12.0%
<once a month
2 - 3 times/month
1 - 2 times/wk
0.0%
1.0%
2.0%
3.0%
4.0%
5.0%
6.0%
7.0%
Seriously think about
attempting suicide
Make a plan for
attempting suicide
Attempt suicide
Barriers to seek help
Who would you talk to if you thought you needed help?
12.7% use CAPS counseling services
2.4% use CAPS psychiatric services
75.9% think most people would willingly accept someone receiving
services
50.0% think most people view receiving services as a sign of personal
failure
42.7% think most people would think less of someone receiving
services
88.5% would willingly accept someone who was receiving services
12.6% view receiving services as a sign of personal failure
9.6% would think less of someone receiving services
66.8% thought therapy/counseling is helpful
40.3% thought medication is helpful
27.7% felt they needed help for emotional/mental problems
9.6% talked to an academic personnel about their mental health
8.4% found the personnel supportive
60.2% report receiving support from family
60.8% report receiving support from friends
0.0%
1.0%
2.0%
3.0%
4.0%
5.0%
6.0%
7.0%
8.0%
9.0%
Deal with it
Stress is Normal
Question Needs
Problem will get better
No time
Support from
family/friends
0.0%
5.0%
10.0%
15.0%
20.0%
25.0%
30.0%
35.0%
40.0%
Professor
No one
Academic Advisor
Dean
Student Services
Faculty
Teaching Assistant

More Related Content

Similar to Richmond Dean Document

Penicuik presenta survey results
Penicuik presenta survey resultsPenicuik presenta survey results
Penicuik presenta survey resultsComeniusMODY
 
Stress in Relatie tot 7 Alledaagse Dingen op het Werk
Stress in Relatie tot 7 Alledaagse Dingen op het WerkStress in Relatie tot 7 Alledaagse Dingen op het Werk
Stress in Relatie tot 7 Alledaagse Dingen op het Werkmulderpc
 
Race etchnslide 2010 2013 onlymales
Race etchnslide 2010 2013 onlymalesRace etchnslide 2010 2013 onlymales
Race etchnslide 2010 2013 onlymalesscynic69
 
Wmst298 d group-project_presentation
Wmst298 d   group-project_presentationWmst298 d   group-project_presentation
Wmst298 d group-project_presentationSubhashree Nayak
 
Active Ageing Index
Active Ageing  IndexActive Ageing  Index
Active Ageing IndexAshok Eapen
 
Terry Trussler Gay Health at Work
Terry Trussler Gay Health at WorkTerry Trussler Gay Health at Work
Terry Trussler Gay Health at WorkCBRC
 
Work wellbeing book launch
Work wellbeing book launchWork wellbeing book launch
Work wellbeing book launchMark McCrindle
 

Similar to Richmond Dean Document (9)

Penicuik presenta survey results
Penicuik presenta survey resultsPenicuik presenta survey results
Penicuik presenta survey results
 
Stress in Relatie tot 7 Alledaagse Dingen op het Werk
Stress in Relatie tot 7 Alledaagse Dingen op het WerkStress in Relatie tot 7 Alledaagse Dingen op het Werk
Stress in Relatie tot 7 Alledaagse Dingen op het Werk
 
Race etchnslide 2010 2013 onlymales
Race etchnslide 2010 2013 onlymalesRace etchnslide 2010 2013 onlymales
Race etchnslide 2010 2013 onlymales
 
Lgbt risks presentation
Lgbt risks presentationLgbt risks presentation
Lgbt risks presentation
 
Speak To Your Health! Survey Presentation 2012
Speak To Your Health! Survey Presentation 2012Speak To Your Health! Survey Presentation 2012
Speak To Your Health! Survey Presentation 2012
 
Wmst298 d group-project_presentation
Wmst298 d   group-project_presentationWmst298 d   group-project_presentation
Wmst298 d group-project_presentation
 
Active Ageing Index
Active Ageing  IndexActive Ageing  Index
Active Ageing Index
 
Terry Trussler Gay Health at Work
Terry Trussler Gay Health at WorkTerry Trussler Gay Health at Work
Terry Trussler Gay Health at Work
 
Work wellbeing book launch
Work wellbeing book launchWork wellbeing book launch
Work wellbeing book launch
 

Richmond Dean Document

  • 1. Undergraduate Males
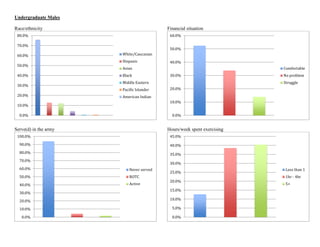
 Race/ethnicity Serve(d) in the army Financial situation Hours/week spent exercising 0.0% 10.0% 20.0% 30.0% 40.0% 50.0% 60.0% 70.0% 80.0% White/Caucasian Hispanic Asian Black Middle Eastern Pacific Islander American Indian 0.0% 10.0% 20.0% 30.0% 40.0% 50.0% 60.0% 70.0% 80.0% 90.0% 100.0% Never served ROTC Active 0.0% 10.0% 20.0% 30.0% 40.0% 50.0% 60.0% Comfortable No problem Struggle 0.0% 5.0% 10.0% 15.0% 20.0% 25.0% 30.0% 35.0% 40.0% 45.0% Less than 1 1hr - 4hr 5+
  • 2. Hours/week spent on schoolwork Average bedtime during the week Average bedtime during the weekend Average wake-up time during the week 0.0% 5.0% 10.0% 15.0% 20.0% 25.0% 30.0% 35.0% 40.0% 45.0% 50.0% 3 hrs or less 4 - 7 hrs 8+ 0.0% 5.0% 10.0% 15.0% 20.0% 25.0% 30.0% 35.0% 40.0% 45.0% 9 PM - 10 PM 11 PM - 12 AM 1 AM - 2 AM 3 AM + 0.0% 5.0% 10.0% 15.0% 20.0% 25.0% 30.0% 35.0% 40.0% 45.0% 50.0% 9 PM - 10 PM 11 PM - 12 AM 1 AM - 2 AM 3 AM + 0.0% 5.0% 10.0% 15.0% 20.0% 25.0% 30.0% 35.0% 40.0% 45.0% 5 AM - 6 AM 7 AM - 8 AM 9 AM - 10 AM 11 AM +
  • 3. Average wake-up time during the weekend How many days/week you take a nap Typical nap length Times binge drinking in the past two weeks 0.0% 5.0% 10.0% 15.0% 20.0% 25.0% 30.0% 35.0% 40.0% 45.0% 50.0% 7 AM - 8 AM 9 AM - 10 AM 11 AM - 12 PM 1 PM + 0.0% 5.0% 10.0% 15.0% 20.0% 25.0% 30.0% 35.0% 40.0% 45.0% None 1 - 2 days 3 - 4 days 5 days + 0.0% 5.0% 10.0% 15.0% 20.0% 25.0% 30.0% 35.0% 40.0% 45.0% 50.0% <1 hr 1 - 2 hrs 2 - 3 hrs 0.0% 5.0% 10.0% 15.0% 20.0% 25.0% 30.0% 35.0% None 1 -2 times 3 - 5 times 6 +
  • 4. Most used substances AUDIT scores Intervened in situations Why did you not intervene? 0.0% 2.0% 4.0% 6.0% 8.0% 10.0% 12.0% 14.0% 16.0% Cigarettes Marijuana Amphetamines Tranquilizers Cocaine Ecstasy 0.0% 10.0% 20.0% 30.0% 40.0% 50.0% 60.0% 70.0% No - low risk Risky drinker High risk Alcoholic threshold 0.0% 10.0% 20.0% 30.0% 40.0% 50.0% 60.0% Someone drinking too much Someone experiencing sig. emo distress Someone using hurtful language Someone at risk of being sexually assaulted 0.0% 5.0% 10.0% 15.0% 20.0% 25.0% 30.0% None of my business Didn't feel confident Didn’t know what to do Assumed someone else would do it Afraid of embarrassing oneself Afraid friends wouldn't support Felt unsafe
  • 5. How competitive do you find the student body Diagnosed disorders Prescribed medications Meeting threshold for disorders 0.0% 10.0% 20.0% 30.0% 40.0% 50.0% 60.0% 70.0% Very competitive Average Not competitive 0.0% 1.0% 2.0% 3.0% 4.0% 5.0% 6.0% 7.0% 8.0% Eating disorder Anxiety Disorder Mood Disorder Attention disorder/learning disability Substance Abuse Disorder 0.0% 1.0% 2.0% 3.0% 4.0% 5.0% 6.0% Psychostimulants Anti-anxiety Sleep Medication Antidepressants 0.0% 5.0% 10.0% 15.0% 20.0% 25.0% 30.0% 35.0% 40.0% Generalized Anxiety Disorder Major Depression Eating Disorder
  • 6. Days/week emotional/mental problems hurt academic performance NSSI How often did you hurt yourself Suicidal thoughts/attempts 0.0% 5.0% 10.0% 15.0% 20.0% 25.0% 30.0% 35.0% 40.0% 45.0% 50.0% None 1 - 2 days 3 - 5 days 6 + 0.0% 1.0% 2.0% 3.0% 4.0% 5.0% 6.0% 7.0% 8.0% Punched/banged object to hurt self Punched/banged self Bit self Scratched self Pulled own hair Burned self Cut self 0.0% 2.0% 4.0% 6.0% 8.0% 10.0% 12.0% <once a month 2 - 3 times/month 1 - 2 times/wk 0.0% 1.0% 2.0% 3.0% 4.0% 5.0% 6.0% 7.0% Seriously think about attempting suicide Make a plan for attempting suicide Attempt suicide
  • 7. Barriers to seek help Who would you talk to if you thought you needed help? 12.7% use CAPS counseling services 2.4% use CAPS psychiatric services 75.9% think most people would willingly accept someone receiving services 50.0% think most people view receiving services as a sign of personal failure 42.7% think most people would think less of someone receiving services 88.5% would willingly accept someone who was receiving services 12.6% view receiving services as a sign of personal failure 9.6% would think less of someone receiving services 66.8% thought therapy/counseling is helpful 40.3% thought medication is helpful 27.7% felt they needed help for emotional/mental problems 9.6% talked to an academic personnel about their mental health 8.4% found the personnel supportive 60.2% report receiving support from family 60.8% report receiving support from friends 0.0% 1.0% 2.0% 3.0% 4.0% 5.0% 6.0% 7.0% 8.0% 9.0% Deal with it Stress is Normal Question Needs Problem will get better No time Support from family/friends 0.0% 5.0% 10.0% 15.0% 20.0% 25.0% 30.0% 35.0% 40.0% Professor No one Academic Advisor Dean Student Services Faculty Teaching Assistant