2. Executive Summary
Introduction
Small-Scale Fisheries
Investment Blueprints
The Mariscos Strategy
The Mangue Strategy
The Isda Strategy
Industrial-Scale Fisheries
Investment Blueprints
The Merluza Strategy
The Sapo Strategy
National-Scale Fisheries
Investment Blueprint
The Nexus Blue Strategy
3. ENCOURAGE CAPITAL PUBLICATION DISCLAIMER
This publication has been prepared solely for informational purposes, and has
been prepared in good faith on the basis of information available at the date of
publication without any independent verification. The information in this publication
is based on historical or current political or economic conditions, which may be
superseded by later events. Encourage Capital, LLC (Encourage Capital) does not
guarantee or warrant the accuracy, reliability, adequacy, completeness or currency
of the information in this publication nor its usefulness in achieving any purpose.
Charts and graphs provided herein are for illustrative purposes only. Nothing
contained herein constitutes investment, legal, tax, or other advice nor is it to
be relied on in making an investment or other decision. Readers are responsible
for assessing the relevance and accuracy of the content of this publication. This
publication should not be viewed as a current or past recommendation or a
solicitation of an offer to buy or sell securities or to adopt any investment strategy.
The information in this publication may contain projections or other forward-looking
statements regarding future events, targets, forecasts or expectations described
herein, and is only current as of the date indicated. There is no assurance that such
events, targets, forecasts or expectations will be achieved, and any such events,
targets, forecasts or expectations may be significantly different from that shown
herein. Past performance is not indicative of future results. Encourage Capital will
not be liable for any loss, damage, cost or expense incurred or arising by reason of
any person using or relying on information in this publication.
4.
5. TABLE OF CONTENTS
The Merluza Strategy 1
The Merluza Strategy 2
Key Value Drivers 4
Profile of the Merluza Strategy Fishery 5
Species Life History 5
Stock Profile and Current Status 5
Hake-Squid Interactions 9
Stock Management Approach and Challenges 11
Regulatory Context 11
Illegal Fishing Activity 12
Closures and Size Limits 12
Total Allowable Catch (TAC) and Quotas 13
Gear and Environmental Impacts 13
Current Supply Chain 15
Hake 15
Squid 16
Socioeconomic Profile 17
The Merluza Impact Strategy 18
Impact Investment Thesis 18
Step 1: Fishery Management Improvements 20
The Transition to Jumbo Squid 22
Management and Implementation 23
Sustainable Fishing Rewards Program 24
Fishery Management Improvement Budget 26
Step 2: Acquisition of Fishing Quota 29
Targeted Impacts 30
The Merluza Commercial Investment Thesis 31
Step 3: Launch and Operate Hakeco 31
Value Proposition 31
Summary of Business Strategy and Concept 31
Raw Material Sourcing Strategy and Harvest Planning 32
Operations 34
Squid 35
Management and Roles 38
Competition 38
6. TABLE OF CONTENTS (continued)
The Merluza Strategy Financial Assumptions & Drivers 39
Revenue Model and Prices 39
Cost Structure 41
The Merluza Strategy Transaction Structure 43
Sources of Funds 43
Program Related Investment (PRI) 43
Potential Chilean Grant Support 43
Uses of Funds 44
Structure and Governance 44
Summary of Returns 45
Sensitivity Analysis 45
Key Merluza Strategy Risks and Mitigants 47
APPENDIX 50
Operational and Financial Projections 50
7. FIGURES
FIGURE 1: Typical Size Range within Hake Landings 2
FIGURE 2: Spatial Distribution of Hake Biomass 6
FIGURE 3: Historical Landings and Quota Allocation for Common Hake 6
FIGURE 4: Trends in Total Biomass According to Subpesca in Orange (2011) and Tascheri et al (2014) 7
FIGURE 5: Relative Frequency of Individuals by Length (cm). Dark Represents
the Fraction Under 37 cm (IFOP 2014) 8
FIGURE 6: Index of Relative Abundance of Giant Squid in Research Vessel
Hauls During the Period of Stock and Landings Decline 10
FIGURE 7: Artisanal Hake Landings by Gear Type (IFOP 2012) 14
FIGURE 8: Trends in CPUEs in the Artisanal Fishery in Valparaiso and San Antonio 15
FIGURE 9: Main Export Destinations for Common Hake Landed by Industrial Sector 15
FIGURE 10: The Merluza Strategy Investments 19
FIGURE 11: Artisanal Shares Incorporated into the Management Improvements 20
FIGURE 12: Transition to Squid Fishing by Caleta, Including Percentage of Vessels
Transitioned and Additional Landings 23
FIGURE 13: Fisheries Management Company Staff 23
FIGURE 14: Profit Share Program Expansion (FMF and Premium) 25
FIGURE 15: Annual FMC Budget 26
FIGURE 16: FMC Expense Categories 27
FIGURE 17: Evolution of FMC Capital Expenditures over 10 Years 27
FIGURE 18: FMC Operating Costs over 10 Years 28
8. FIGURES (continued)
FIGURE 19: Fishery Management Expenses as a Share of Hake Revenues 29
FIGURE 20: Supply Chain Visualization 32
FIGURE 21: Hake and Squid Raw Material Sourcing Relative to TAC 33
FIGURE 22: HakeCo Staff 38
FIGURE 23: Revenue Contribution by Different Channels 39
FIGURE 24: Price Per Product Type 40
FIGURE 25: Relative Hake and Squid Economics 40
FIGURE 26: Breakdown of COGS by Expense Category 41
FIGURE 27: Breakdown of SGA by Expense Category 41
FIGURE 28: Cost Structure for Consolidated Company 42
FIGURE 29: Total Sources of Funds 43
FIGURE 30: Use of Funds for FIPCo, HakeCo and Consolidated HoldCo 44
FIGURE 31: Capital Structure (Note: PRI Is Optional and Not Included in Base Case) 44
FIGURE 32: Summary of Returns and Impact Metrics 45
9. ImpactInvestingforSustainableGlobalFisheriesAVIBRANTOCEANSINITIATIVE
1
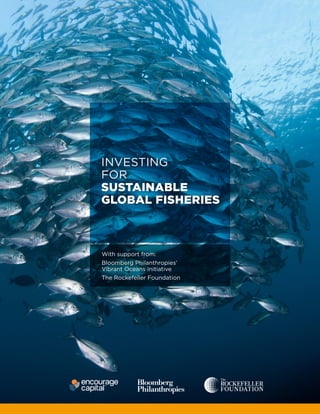
THE MERLUZA STRATEGY:
AN INDUSTRIAL-SCALE FISHERIES INVESTMENT IN CHILE
While Project Merluza is based on analysis of actual fishing communities, fishing conditions, and commercial business operations to
incorporate realistic assumptions of costs, returns, and risks affecting the potential outcomes of the project, Encourage Capital has
synthesized its findings into a general case study that we hope can be used as a roadmap for fishery stakeholders interested in impact
investing opportunities more broadly in the sustainable fisheries space. As such, most of the company and programmatic references herein
use pseudonyms in place of the actual names of the organizations on which the analysis was based. Where used, such pseudonyms will be
used consistently throughout the remainder of this text.
5
Calculated as the NPV of the total annual premium payout over the 10-year investment horizon, discounted by 4.0%, the Chilean rate of inflation.
6
Assuming two fishers per vessel on average across the hake and squid fishery
7
Based on total allowable catch in year ten versus current, applying a processing yield of 44% and assuming portion size of 200 g.
This figure represents the number of additional meals available in perpetuity if the stock recovered to 75% of BMSY
.
Encourage Capital has worked with support from Bloomberg Philanthropies and
The Rockefeller Foundation to develop an impact-investing strategy supporting the
implementation of sustainable fishing improvements in the distressed common hake fishery
in Chile. The Merluza Strategy is a hypothetical $17.5 million impact investment to restore the
hake fishery to its full biological and economic potential.
The $17.5 million would fund the implementation of comprehensive fishery management
improvements across the fishery, acquire 36% of the total fishing rights (or “quota”) in
the fishery, and create a new hake processing and distribution business incorporating
jumbo squid products and sales. The Merluza Strategy targets the generation of a 16.4%
base-case equity return with upside potential up to 35%, while simultaneously restoring hake
stock to 75% of its biomass at Maximum Sustainable Yield (BMSY
), generating $104 million5
in additional income for fishers divided among nearly 1,8006
fishers across 12 caletas and
delivering 136 million additional legal hake meals-to-market annually.7
Common Hake
(Merluccius gayi)
Illustration by Brett Affrunti
10. ImpactInvestingforSustainableGlobalFisheriesAVIBRANTOCEANSINITIATIVE
2
The Chilean Common Hake (Merluccius gayi), or
“merluza común” as it is known in Spanish, has
been Chile’s most economically and culturally
significant fishery over the last century, supporting
more than 7,000 fishers at its peak with a biomass
of over 1.5 million metric tons (mt). Over the course
of the commercial history of the fishery, it has
experienced a cyclical pattern of extreme abundance
and overfishing-driven depletion. This pattern was
punctuated by two major collapses in the 1960s
and early 2000s. The most recent collapse in the
early 2000s is widely attributed to the combination
of overfishing and predation by jumbo squid—an
invasive predator from northern waters—which
suddenly appeared in tremendous abundance. Ten
years following this collapse, the stock biomass is
estimated to be less than 200,000 mt, with the
average size of landed fish falling by more than 10
centimeters8
and as many as 5,000 artisanal fishers
exiting the fishery.9
In February 2013, passage of the Nueva Ley de Pesca
y Acuicultura N°20.657 (the Fishing Law) opened
the door for comprehensive reform in hake fishery
management. This law required, for the first time,
that fishing limits be set by scientific committee, the
goal being to isolate management of the stock from
the political and commercial pressures that led to
its collapse in the early 2000s. In a single year, the
scientific committee succeeded in reducing the Total
Allowable Catch (TAC) for common hake by more
than 50%.
Unfortunately, the ambitious scope of the new law
was not met with commensurate resources or political
will to properly enforce it. In fact, since the law was
passed, overfishing has continued largely unabated,
with as much as three times the TAC being harvested
illegally and sold to the domestic market each year as
unreported landings. With only a handful of industrial
vessels, all equipped with Vessel Monitoring Systems
(VMS) and onboard monitors, fishing the entirety
of the industrial quota, the illegal harvest is widely
understood to stem from the artisanal sector.
THE MERLUZA STRATEGY
FIGURE 1: Typical Size Range within Hake Landings
8
R. Alarcon, et al, “Estimation of the Biomass of Jumbo Squid (Dosidicus gigas) Off Central Chile and Its Impact on Chilean Hake,” CalCOFI
Report 49, 2008.
9
E. Plotnek, “Barriers to Marine Stewardship Council Certification in the Artisanal South Pacific Hake Fishery in Chile,” Universidad del Pais
Vasco, 2014, supported by information from Sernapesca.
11. ImpactInvestingforSustainableGlobalFisheriesAVIBRANTOCEANSINITIATIVE
3
Curtailing this illegal harvest has proven particularly
challenging for regulators, for a variety of reasons.
First, nearly all artisanal common hake vessels
measure less than 12 meters in length and, as such,
are neither obliged to carry VMS nor required to
unload at designated ports. Fish are landed at up
to 35 landing sites (known in Chile as caletas, or
coves), in many cases by unlicensed vessels with
little or no official quota allocation. Moreover,
these landings are infrequently if ever weighed or
inspected by the authorities.10
These challenges are compounded, and in fact
reinforced, by the fragmented and highly inefficient
supply chain into which the product is fed. Over
the course of up to a week, the fish wind their way
toward Santiago, the capital city, by truck—often
unrefrigerated—and changing hands between as
many as five intermediaries. Along the way, much of
the product spoils and few if any attempts are made
to distinguish the legality or origins of the fish.
Once in Santiago, brokers at the country’s primary
seafood terminal, known as the Terminal Pesquero
Metropolitano, oversee the sale and distribution of
70% to 90% of all common hake landings (nearly
all of which is sold domestically). Leveraging
their dominant market position and networks
of intermediaries, this cartel is able to establish
artificially low beachside (or “ex-vessel”) prices
nationally, while coordinating among themselves
to evade inspections by the Chilean fisheries
authorities (SERNAPESCA). A lack of alternative
commercialization pathways and dependence on
intermediaries to transport their product to market
conspires to lock hake fishers across the country into
a low-margin, volume-driven production model that
incentivizes overfishing and poor product quality.
To combat this confluence of fishery management
and supply chain issues, The Merluza Strategy
proposes the investment of $17.5 million to implement
comprehensive fishery management improvements,
acquire industrial fishing quota, and create a new
processing and distribution business for hake and
jumbo squid. Merluza’s innovative approach would
reduce the hake fishing effort by at least 27%, utilizing
robust data collection and technology systems to
improve fisher compliance with sustainable fishing
practices, and offering financial incentives that reward
sustainability over time.11
At its heart, The Merluza Strategy seeks to
dramatically improve the stock status and
commercialization of the common hake fishery
and, in the process, meaningfully improve artisanal
fisher livelihoods in the most important hake-fishing
caletas in Chile. If successful, Merluza would restore
the common hake stock to 75% of its biomass at
Maximum Sustainable Yield (BMSY
)12
within a 10 year
time frame, allowing for increased landings of up
to 70,000 mt per year, and putting the stock on a
path to full recovery.13
In addition, through dramatic
improvements in the harvest, handling, and supply
chain, Merluza targets a payout of $104 million in
additional revenue to fishers over 10 years, to be
divided among 1,800 participant artisanal fishers,
plus the creation of approximately 136 million
additional seafood meals. Merluza is expected to
generate a levered equity return of 16.4% in the base
case over a 10-year horizon, with additional upside in
the case of a more robust stock recovery.
IMPACT AND FINANCIAL RETURNS
• Increase hake stock biomass by 177% in the base case, and 269% in the upside case.
• Increase incomes for almost 1,800 artisanal fishers across 12 communities through premium payout of over $58,000
per fisher, or a total of $104 million over the 10-year hold period in the base-case scenario.14
• Increase meals-to-market by 685 million meals over the 10-year hold period of the investment, and 136 million
annually thereafter in perpetuity.
• Targets a base-case 16.4% levered equity return over the 10-year hold period
10
C. Leal, et al, “What Factors Affect the Decision Making Process When Setting TACs?: The Case of Chilean Fisheries,” Marine Policy 34, 2010.
11
This reduction only includes the retirement of 20% of Merluza’ quota holdings and a vessel retrofit program shifting hake fishing effort to
the squid fishery in Region VII. The actual reduction in hake fishing mortality should be much larger as IUU fishing is reduced in each of the
target caletas through improved management plans, backed by robust monitoring, enforcement, and economic incentives.
12
Biomass at MSY has been estimated by the Instituto de Fomento Pesquero (IFOP) to be approximately 630,000 mt and by University of
California, Santa Barbara to be approximately 625,000 mt. All references herein to biomass at MSY refer to the IFOP projection
13
Full recovery is considered to be 100% of BMSY
.
14
These numbers are discounted to present value.
12. ImpactInvestingforSustainableGlobalFisheriesAVIBRANTOCEANSINITIATIVE
4
The Merluza Strategy can be conceived of as a pay-
for-performance mechanism through which the return
to investors is tied directly to the extent to which
the fishery management improvements they finance
are successful in increasing the total stock biomass
and landings. Merluza presents a compelling impact
investing opportunity for the following reasons:
KEY VALUE DRIVERS
VALUE DRIVERS DESCRIPTION
Implements effective fishery
management improvements
The Merluza Strategy presents an opportunity to support and enhance critical
aspects of the implementation of Chile’s groundbreaking new Fishing Law, freeing
authorities to focus their limited public resources on monitoring and enforcement,
while leveraging novel technologies and partnerships to deliver comprehensive
fishery management improvements more effectively at lower cost.
Creates an investment position
that appreciates in value as the
stock recovers
The acquisition of fishing quotas, in combination with the creation of a hake
and squid processing and distribution business, generate increasing asset
values as the hake stock recovers.
Leverages strong regulatory
enabling conditions
Chile’s new Fisheries and Aquaculture Law, passed in 2013, creates a strong
foundation for investment into the fishery with scientifically determined
total allowable catch (TAC) volumes and a robust transferable quota system
that limits fishing effort and seeks to manage stocks in accordance with
maximum sustainable yield.
Uses innovations to increase
fisher compliance
The use of onboard data capture technologies, dockside catch accounting, and
other data systems, in combination with financial market incentives to reward
fishers for sustainable practices, can increase fisher compliance with fishery
management improvements, reducing the overall amount of illegal fishing activity.
Establishes best-in-class
partnerships
Merluza would seek to partner with complementary operating partners,
including NGOs, social enterprises, academic institutions, and seafood
industry experts to offer the strongest possible leadership and execution
of the overall strategy. In addition to these formal operating partners, the
project would actively engage regulators, retailers, food service companies,
and other actors aligned in the goal of eliminating illegal hake fishing.
Engages experienced
commercial management
Merluza would recruit experienced, mission-aligned seafood executives with
a commitment to sustainably sourced products, to launch and execute its
hake and squid processing and distribution business, drawing from a rich
network of individuals in Chile’s well-developed seafood sector.
Leverages a strong commercial
market position
Merluza’s ownership of 60% of the industrial quota (or 37% of total quota,
including industrial and artisanal quota) and linkages enabling sourcing of
71% of the artisanal landings would give the strategy tremendous leverage
in the fishery and provide a dominant market position for the Company. The
Company would be the only vertically integrated, fully-traceable seafood
company sourcing exclusively from artisanal fishers, and the largest supplier
of both common hake and jumbo squid in the country.
In addition, there is a meaningful opportunity to reconfigure the existing
supply chain and convert the 200%–500% margin currently associated with
transport inefficiencies and waste into Merluza enterprise value.
Supported by strong underlying
demand fundamentals
Merluza expects to benefit from the positive socioeconomic trends in Chile,
as well as Chilean consumers’ shift in food preferences toward healthier,
responsibly sourced products. In addition, the growing awareness of the illegal
hake issue sparked by government, NGO, and media campaigns is driving
demand for legal and traceable seafood products in Chile. This growing
demand, combined with sustainable sourcing requirements among Chilean
and international retailers, is increasing pressure to adhere to sustainable and
responsible sourcing policies in Chile.
Positive investment climate Chile is rated as Investment Grade by all three major rating agencies, has one of
the lowest sovereign risk premiums in Latin America, and is considered one of
the most attractive countries in which to invest in the region.
13. ImpactInvestingforSustainableGlobalFisheriesAVIBRANTOCEANSINITIATIVE
5
PROFILE OF THE MERLUZA STRATEGY FISHERY
SPECIES LIFE HISTORY
The Chilean common hake, or South Pacific hake, is a groundfish species of the family Merlucciidae. This
family is in the same taxonomic order, Gadiformes, as cod and haddock and shares many life history
characteristics with those more widely known species. Although generally associated with the benthos
(seafloor), common hake inhabit the shallow to upper continental slope between 50 and 500m depth and
ranging some 1,500 miles along the Chilean coastline from Coquimbo to Puerto Montt.15
Juvenile hake tend
to be found near the coast, with individuals moving to deeper waters as they mature and returning to the
coast to spawn.16
Common hake occur in a wide range of salinities and tolerate a variety of environmental conditions, making
it a resilient species whose abundance is primarily limited by human fishing pressure, predation by jumbo
squid, and competition with other species. Much like cod, this hardiness combined with tremendous
fecundity facilitates huge populations which, in turn, play a critical top-down control role on the ecosystems
they inhabit. It also makes the species susceptible to biological tipping points that lead to dramatic
collapses when the population structure is altered by changes in fishing and natural mortality.
The common hake has an estimated lifespan of 17 to 21 years in females and 11 to 15 years in males, and is
an asynchronous spawner, capable of reproducing more than once in a single breeding season.17
Eggs and
larvae are found throughout the year along the Chilean coast, although the most significant spawning takes
place between July and November. A secondary smaller spawning period occurs between December and
February.18
This dual spawning period is notable, given that the current commercial closed-season extends
for only one month, leaving the stock particularly vulnerable during the remaining spawning periods.
Expanding this closed season is a priority of conservation practitioners and Merluza alike.
STOCK PROFILE AND CURRENT STATUS
The fishery has historically supported both an industrial and an artisanal fleet, both of which operate in
Regions IV through X of Chile (see Figure 2). The industrial fleet is prohibited from fishing within the first
five nautical miles of the shore, which is reserved for the exclusive use of the artisanal fleet. Fishing rights, in
this case transferable quotas, are currently allocated 60% to the industrial sector and 40% to the artisanal
sector, although actual landings do not reflect this split as a result of illegal and underreported harvest by
the artisanal sector.
15
D. Queirolo et al, (2013), “Gillnet selectivity for Chilean hake (Merluccius gayi gayi Guichenot, 1848) in the Bay of Valparaíso,” Journal
of Applied Ichthyology 29(4): 775–81.
16
San Martin, et al, “Temporal Distribution of Juvenile Hake of Central Southern Chile,” Aquatic Living Resources, 2011.
17
V. Ojeda, et al, “Validación de los métodos aplicados en la estimación de edad y crecimiento, y determinación de la mortalidad en merluza
común en la zona centro-sur,” Informe Final FIP, 1997.
18
C. Vargas and L. Castro, “Spawning of the Chilean Hake Merluccius Gayi in the Upwelling System of Talcahuano in Relation to
Oceanographic Features,” Scientia Marina 65(2), 2001.
14. ImpactInvestingforSustainableGlobalFisheriesAVIBRANTOCEANSINITIATIVE
6
FIGURE 2: Spatial Distribution of Hake Biomass19
FIGURE 3: Historical Landings and Quota Allocation for Common Hake21
Legend
TMS Caletas
SANTIAGO
San Pedro
Portales
San Antonio
Llico
Duao
La Trinchera
Maguillines - Constitución
Loanco
Pelluhue
Cocholgue-Coliumo
Tumbes
Membrillo
The first official records of commercial hake harvest
in Chile date back to the 1930s, initially based out
of the ports of Valparaíso and San Antonio.20
The
fishery had two peak landing periods in the late
1960s and early 2000s, both of which were followed
by dramatic collapses in biomass (see Figure 3).
19
S. Lillo, et al, “Evaluación hidroacústica de merzula común, ano 2011,” Final Report, FIP Project 2011, Instituto de Fomento Pesquero, 2012.
20
Instituto de Fomento Pesquero (IFOP), “Merluza común,” Segundo Informe – Final, 2014.
21
Subpesca, “Cuota Global Anual de Captura de Merluza Comun,”, Subsecretaria de Pesca, Valparaiso, 2011.
140,000
60,000
40,000
20,000
80,000
100,000
120,000
Landings(tons)
Quota
Industrial
Artisanal
Total
1940
1942
1944
1946
1948
1950
1952
1954
1956
1958
1960
1962
1964
1966
1968
1970
1972
1974
1976
1978
1980
1982
1984
1986
1988
1990
1992
1994
1996
1998
2000
2002
2004
2006
2008
2010
2012
2013
Years
REGION CALETAS
INCORPORATED
INTO MERLUZA
% OF
ARTISANAL
QUOTA
IV – 4.30%
V San Pedro,
Puertecito,
Portales,
Membrillo
32.90%
VI – 3.80%
VII Llico, Duao,
La Trinchera,
Maguillines,
Loanco,
Pelluhue
27.90%
VIII Cochologüe 30.80%
IX – 0.20%
XIV-X – 0.10%
Total 100%
15. ImpactInvestingforSustainableGlobalFisheriesAVIBRANTOCEANSINITIATIVE
7
FIGURE 4: Trends in Total Biomass, According to SUBPESCA (in Orange) (2011) and Tascheri, et al 23, 24
The collapse in the early 2000s, during which the
stock biomass fell by as much as 90%, is believed
to have been caused by a confluence of overfishing
and the sudden appearance and dramatic rise in
abundance of jumbo squid (Dosidicus gigas)—a
major predator of the common hake. This spike
in overfishing was government sanctioned to an
extent, as SUBPESCA, the quota-setting fishery
authority at the time, dramatically overestimated
the stock biomass in 2002 (see Figure 4), and
subsequently set the TAC far higher than could be
supported by the hake population.22
Over the period of 2002 to 2014, the estimated
stock biomass fell from 1.6 million mt to between
200,000 and 300,000 mt (see Figure 4). Currently,
the stock biomass is believed by the Instituto de
Fomento Pesquero (IFOP)—a private, nonprofit
organization that provides the technical background
and scientific assessments for the regulation and
management of the sector—to be approximately
27% of total biomass at MSY, although many
academics and practitioners are anecdotally more
pessimistic.25
SERNAPESCA has classified the stock
as overexploited since 2005 and at risk of collapse.26
Of particular concern is the almost complete
absence of individuals over the age of five, with as
high as 94% of the catch comprising age classes
younger than three years. Moreover, between
2004 and 2010, the average length of individuals
landed by both the industrial and artisanal sectors
has decreased from 46cm to 33cm in total
length,27
below the estimated 37cm size at which
the fish sexually matures.28
In 2012, over 70% of
the population was believed to be below 37cms.
Additionally, there is evidence of a reduced length
at the onset of sexual maturity due to the heavy
22
H. Arancibia and S. Niera, “An Overview of the Chilean Hake (Meluccius gayi) Stock, a Biomass Forecast, and the Jumbo Squid (Dosidicus
gigas) Predator-Prey relationship Off Central Chile,” CalCOFI Report 49, 2008.
23
Subpesca, “Cuota Global Anual de Captura de Merluza Comun,” Subsecretaria de Pesca, Valparaiso, 2011.
24
Tascheri, et al, “Estatus Y Posibilidades de Explotacion Biologicamente Sustenables de los Principales Recursos Pesqueros Nacionales,”
Segundo Informe – Final, 2014.
25
Stock status is indicated by the spawning stock biomass (SBB) relative to an unexploited population (SSB0
). Target reference point is
0.5SSB0
, and 0.2SSB0
is the limit reference point below which the stock would be at risk of collapse. 0.3SSB0
is a precautionary reference
point and between 0.3 and 0.5SSB0
the stock would be assumed to be fully exploited (IFOP 2014). In the early 1970s, SSB was below
SSB0
, but it then experienced sustained growth until 1996. Between 1996 and 2005 SSB was drastically reduced to 12% SSB0
and came to
an overexploited state with risk of collapse.
26
R. Alarcón, et al, “Biología reproductiva de merluza común,” Informe Final, Corregido Proyecto FIP 2006–16, 2009.
27
D. Queirolo et al, (2013), “Gillnet Selectivity for Chilean Hake (Merluccius gayi gayi Guichenot, 1848) in the Bay of Valparaíso,” Journal of
Applied Ichthyology 29(4): 775–81.
28
R. Alarcon and H. Arancibia (1993), “Talla de primera madurez sexual y fecundidad parcial en la merluza comun, Merluccius gayi gayi,”
Cienc. Tec. Mar. 16, 33–45.
1999 2000 2001 2002 2003 2004 2005 2006 2007 2008 2009 2010 2011 2012 2013
1600
1400
1200
1000
800
600
400
200
Total
Tascheri
et al 2014
Total
Subpesca
2011
Milestons
ESTIMATES OF BIOMASS OF COMMON HAKE (1998-2013)
16. ImpactInvestingforSustainableGlobalFisheriesAVIBRANTOCEANSINITIATIVE
8
FIGURE 5: Relative Frequency of Individuals by Length (cm). Dark Represents the Fraction Under 37 cm. (IFOP 2014)
fishing mortality exerted on younger age classes,
creating a genetic drift toward a population
of smaller fish on average. This trend toward
smaller, younger fish has significant biological
and commercial implications and is believed to be
another factor hampering a robust recovery.29
See
Figure 5.
29
R. Tascheri, et al, “Monitoreo de las capturas de merzula común,” Informe Final FIP 2005–07, 2005.
0.20
0.15
0.10
0.05
0.25
10.5
14.5
18.5
22.5
26.5
30.5
34.5
38.5
42.5
46.5
50.5
54.5
58.5
62.5
66.5
70.5
74.5
78.5
82.5
86.5
90.5
94.5
98.5
2004
0.20
0.15
0.10
0.05
0.25
10.5
14.5
18.5
22.5
26.5
30.5
34.5
38.5
42.5
46.5
50.5
54.5
58.5
62.5
66.5
70.5
74.5
78.5
82.5
86.5
90.5
94.5
98.5
2003
0.20
0.15
0.10
0.05
0.25
10.5
14.5
18.5
22.5
26.5
30.5
34.5
38.5
42.5
46.5
50.5
54.5
58.5
62.5
66.5
70.5
74.5
78.5
82.5
86.5
90.5
94.5
98.5
2005
0.20
0.15
0.10
0.05
0.25
10.5
14.5
18.5
22.5
26.5
30.5
34.5
38.5
42.5
46.5
50.5
54.5
58.5
62.5
66.5
70.5
74.5
78.5
82.5
86.5
90.5
94.5
98.5
2011
0.20
0.15
0.10
0.05
0.25 2012
10.5
14.5
18.5
22.5
26.5
30.5
34.5
38.5
42.5
46.5
50.5
54.5
58.5
62.5
66.5
70.5
74.5
78.5
82.5
86.5
90.5
94.5
98.5
PROPORTION OF JUVENILE FISH IN COMMERCIAL LANDINGS OVER TIME
17. ImpactInvestingforSustainableGlobalFisheriesAVIBRANTOCEANSINITIATIVE
9
Since 2005, the stock has remained well below
its limit reference points despite the dramatic
reduction in quotas.30
This decline is likely
attributable to a continuation of the same factors
that led to the original collapse, including:
• High levels of predation by jumbo squid
• Undeclared/illegal removals (including bycatch
and discards) in both sectors, but particularly
illegal, unreported, and unregulated (IUU) fishing
in the artisanal sector
• Continued legal overfishing due to scientific
committee TAC recommendations in excess of
the replenishing capacity of the stock due to poor
data regarding the extent of illegal fishing and
squid-related mortality
Jumbo squid are the largest and most abundant
marine invertebrate in the southeastern Pacific,
with individuals reaching lengths of 3 meters and
up to 50 kg in weight.31
The species has an average
lifespan of 1 to 1.5 years and breeds only once in
its life. The life history strategies and population
structure of this species are known to be heavily
influenced by environmental factors, particularly
El Niño events,32
making its abundance fairly
unpredictable. However, its short lifespan, wide
trophic niche, and relative hardiness make the
species remarkably resilient.33
Despite the species’
abundance and widespread distribution, spanning
from southern Chile to the Pacific Northwest,
remarkably little is known about its ecology.
From 1978 to 1990, jumbo squid essentially
disappeared from Chilean waters, which scientists
attribute to changes in oceanographic conditions
as a result of El Niño events in the early 1980s. Then
in 1990, the species suddenly returned to Chilean
waters, where it remained at varying degrees of
abundance—even supporting a commercial fishery
for a time in Region IV—until it disappeared again
from Chilean waters, likely in connection with the
El Niño events of 1997–1998. In 2001, however, the
species made a sudden and dramatic return to
Chile’s coast and has remained abundant ever since
(see Figure 6).34, 35
HAKE-SQUID INTERACTIONS
30
Limit reference points set boundaries that are intended to constrain harvesting within safe biological limits in which the stocks can
produce maximum sustainable yield. Fishery management strategies should ensure that the risk of exceeding limit reference points is
very low. If a stock falls below a limit reference point or is at risk of falling below such a reference point, conservation and management
action should be initiated to facilitate stock recovery. The fishing mortality rate that generates maximum sustainable yield should be
regarded as a minimum.
31
Nigmatullin, et al, “A Review of the Biology of the Jumbo Squid Dosidcus gigas,” Fisheries Research 54, 2001.
32
H.T. Hoving, et al, “Extreme Plasticity in Life — History Strategy Allows a Migratory Predator (Jumbo Squid) to Cope with a Changing
Climate,” Global Change Biology, 19: 2089–2103.
33
Seafood Watch. Jumbo Squid. http://www.seafoodwatch.org/-/m/sfw/pdf/reports/mba_seafoodwatch_jumbosquidmexicoreport.pdf.
34
F. Rocha and M.A. Vega, “Overview of the Cephalopod Fisheries in Chilean,Waters,” Fisheries Research 60, 2003.
35
Schmiede and Acuna, “Regreso de las jibias (Dosidicus gigas) a Coquimbo,” Revista Chilena de la Historia Natural, 1992.
18. ImpactInvestingforSustainableGlobalFisheriesAVIBRANTOCEANSINITIATIVE
10
FIGURE 6: Index of Relative Abundance of Giant Squid in Research Vessel Hauls During the Period of Stock and Landings Decline36
The fact that this emergence coincided with the
collapse of the common hake stock has fueled
significant controversy in the fishing sector, leading
to renewed efforts to study its role in the ecosystem.
Although much remains unknown, recent studies
show that in Chile, more so than in other parts of the
squid’s range, the species feeds at a higher trophic
level,37
with stomach content analysis revealing
common hake as a dietary staple.38
Though few scientists deny that squid exert
meaningful top-down pressure on common hake,
the degree to which squid predation caused the
collapse of hake fishery and are inhibiting its
recovery is still subject to broad disagreement.
Studies range from attributing little to no role to
squid while others estimate that as much as 90%
of the hake biomass disappeared due to squid
predation.39
Despite these extremes, the emerging
consensus is that the collapse of the stock could
only have occurred through the combination of
predation and high levels of overfishing.40, 41, 42
The
extent of squid mortality has historically been
included in annual stock assessments for hake;
however, in 2015, mortality from squid was removed
from the model, allowing the quota to rise despite
an actual fall in hake biomass.
36
S. Lillo, et al, “Evaluación hidroacústica de merzula común, ano 2011,” Final Report, FIP Project 2011–03, Instituto de Fomento Pesquero, 2012.
37
G. Ruiz-Cooley, “Tracking Large Scale Patterns of o13C and o15N Along the E Pacific Using Epi-mesopelagic Squid as, Indicators,”
Ecosphere 3(7), 2012.
38
Ulloa, et al, “Habitos alimentarios de Dosidicus gigas frente a la costa centro-sur de Chile,” Revisa Chilena de Historia Natural 79, 2006.
39
Ibanez et al, “El impacto ecologico de calamari Dosidicus gigas sobre las poblaciones de pesces en el Oceano Pacifico”, Amici
Molluscarum 21(7), 2013.
40
Ibanez, et al, “El impacto ecologico de calamari Dosidicus gigas sobre las poblaciones de pesces en el Oceano Pacifico,” Amici
Molluscarum 21(7), 2013.
41
Alarcon-Munoz, et al, “Jumbo Squid Biomass Off Central Chile: Effects on Chilean Hake,”CalCOFI 49, 2008.
42
L. Zeidberg and B. Robinson, “Invasive Species Expansion by the Humboldt Squid in the Eastern North Pacific,” National Academy of
Sciences 104, 2007.
2
2000 2001 2002 2003 2004 2005 2006 2007 2008 2009 2010 2011 2012
3
1
Abundance
relative to
year 2000:
1x ————3x
19. ImpactInvestingforSustainableGlobalFisheriesAVIBRANTOCEANSINITIATIVE
11
The implementation of a new fisheries and
aquaculture law in 2013 ushered in several major
changes in fisheries management in Chile. The new
law established that all commercial fisheries require
management committees that must follow the
recommendation of a scientific committee when it
comes to setting annual catch limits (not exceeding
recommendations by more than 5%), with the goal
of managing stocks to BMSY
.43
Additionally, all closed-
access fisheries, including those of the common
hake, require a management plan, developed by the
specific management committee for that fishery,
which once approved, become legally binding.44
The
scientific committees determine the total allowable
catch limits and quota allocation range based on
robust, age-structured stock assessment models
informed by the best available science. Although
these committees are not immune to political
and social pressure, they provide a much more
independent and rigorous approach to catch limit
setting than existed in the past, and are a dramatic
step forward in fisheries management in Chile.
Three institutions—SUBPESCA, IFOP, and
SERNAPESCA—are responsible for management,
implementation, and enforcement of the Fishing
Law. SUBPESCA, also known as the Undersecretary
of Fisheries and Aquaculture, belongs to the
Ministry of Economy, Development and Tourism, and
regulates and manages fisheries and aquaculture
through policies and standards development.
IFOP, the Fisheries Development Institute, is a
private, nonprofit organization that provides the
technical background and scientific assessments
for the regulation and management of the
sector. SERNAPESCA, the National Fisheries and
Aquaculture Service, also belongs to the Ministry of
Economy, Development and Tourism, is responsible
for monitoring and enforcement of the Fishing Law,
and provides the official statistics from landing data.
Artisanal and industrial fishers play an advisory role
in decision-making through participation in various
councils and species-level management committees.
For the hake, the management committee is formed
by members from representatives of the industrial
(three members) and artisanal sectors (seven
members), SUBPESCA Subpesca (one member),
SERNAPESCA Sernapesca (one member), and
the processing industry (one member). Of note,
the Fishing Law mandates that a management
committee for the hake be formed by August 2014,
with a management plan approved shortly thereafter.
As of now, the management committee is in place;
however, a management plan has not been ratified.45
STOCK MANAGEMENT APPROACH AND CHALLENGES
REGULATORY CONTEXT
43
E. Plotnek, “Barriers to Marine Stewardship Council Certification in the Artisanal South Pacific Hake Fishery in Chile,” Universidad del País
Vasco, 2014.
44
E. Plotnek, “Barriers to Marine Stewardship Council Certification in the Artisanal South Pacific Hake Fishery in Chile,” Universidad del País
Vasco, 2014.
45
E. Plotnek, “Barriers to Marine Stewardship Council Certification in the Artisanal South Pacific Hake Fishery in Chile,” Universidad del País
Vasco, 2014.
The new law established that all commercial fisheries require management
committees that must follow the recommendation of a scientific committee
when it comes to setting annual catch limits (not exceeding recommendations
by more than 5%), with the goal of managing stocks to BMSY
.
20. ImpactInvestingforSustainableGlobalFisheriesAVIBRANTOCEANSINITIATIVE
12
The most critical challenge from a sustainability
standpoint in this fishery is illegal, unreported, and
unregulated (IUU) fishing in the artisanal sector,
since the industrial sector has reduced effort
significantly in recent years and is well-regulated.
IUU fishing refers to that done outside the harvest
limits, such as during closures, in protected areas, or
landing fish under the legal size limits. It also refers
to fishing trips and removals of biomass that are not
officially declared or wrongly reported and are thus
not captured by official records. Informal estimates
from regulators, nonprofits, and fishers themselves
suggest that illegal landings by artisanal fishers
are in the range of two to four times the reported
landings, depending on the caleta. Market data
suggests that at least three times the total allowable
catch is being sold on the domestic market.46
It
appears that the 50% reduction of the TAC in
2014, rather than cutting fishing pressure, only led
to dramatic underreporting, and may in fact have
served to empower informal supply chain actors
willing to commercialize illegal landings.
Harvest by unregistered vessels, which in turn
do not have quota allocations, is another issue
challenging the fishery. It is believed that up to 30%
of the vessels in the artisanal fishery might not be
registered, with this issue particularly prevalent in
Region VII.47
After the massive earthquake in 2010,
the government gave out hundreds of unlicensed
vessels and subsidies to agriculturalists in this
region in an effort to restore economic livelihoods,
effectively converting many farmers to hake fishers.
These fishers were unlicensed, were untrained, and
had an entirely different ethic toward the sea than
did hake fishers in Regions V and VIII, who had
been harvesting the stock for generations. As a
result of these factors, Region VII has the highest
levels of illegal hake fishing. The Merluza Strategy
seeks to address this issue through large-scale
vessel registration programs and gear transitions,
which are described in more detail in the Impact
Investment Thesis section below.
In the industrial fishing fleet, the main concern is
discarding, which is prohibited by law. Although there
is no size limit for hake, undersized hake are believed
to be discarded, given the lower commercial value
and processing yield of small fish. Stock assessments
attempt to account for these IUU issues, but since
the magnitude of underreporting of landed fish in the
artisanal fishery and discarding by industrial fishers
is largely unknown, errors in these assumptions and
consequences on stock assessments are potentially
substantial. SUBPESCA has recently instituted an
on-board observer program on industrial trawlers to
further investigate discards and bycatch in the sector.
While the industrial fleet has minimal mesh size of
100mm set by law, there is no mesh size limit for
the artisanal gillnet fishery. Since 2005, an escape
panel in the nets for juveniles is also mandatory for
industrial fishers. Trawling, and in fact all industrial
harvest, is banned within five nautical miles from
the coast, leaving nearshore populations entirely
to the artisanal sector. Moreover, there is a closed
season in the fishery that extends for a single
month during one of the peak hake spawning
seasons, which applies to all fleets targeting
hake. It is, however, permissible to catch hake as
a nontarget species in other fisheries during this
closure. There is no established minimal landing
size limit for any of the fleets.
ILLEGAL FISHING ACTIVITY
CLOSURES AND SIZE LIMITS
46
E. Plotnek, “Barriers to Marine Stewardship Council Certification in the Artisanal South Pacific Hake Fishery in Chile,” Universidad del País
Vasco, 2014.
47
SERNAPESCA personal communications.
21. ImpactInvestingforSustainableGlobalFisheriesAVIBRANTOCEANSINITIATIVE
13
In the common hake fishery, various schemes for
assigning the annual TAC are applied. The TAC of
the industrial fishery is split into quotas for each
individual vessel. The TAC of the artisanal fleet is first
split by region and then split by area and organization,
known as a Régimen Artesanal de Extracción (RAE).
Each RAE has a charter and set of bylaws that bind
member fishers to a set of fishery management and
commercialization practices. The artisanal fleet has by
law a minimum share of 35% of the quota, with quotas
set in 2015 at 60% to the industrial fleet and 40% to
the artisanal fleet.
Industrial
The industrial fleet exclusively uses demersal trawls.
Compared to bottom trawls, the demersal trawls
have no doors to continuously plough into the
seabed, although they can touch or get dragged
atop the seabed. Hake aggregations are located by
acoustic sonars, so the majority of the catch is hake,
but the gear is known to be of low selectivity.
Data from research vessels suggest that at least
75% of the capture from demersal trawls at the
depth of 200–400 meters is common hake, 9%
jumbo squid (Dosidicus gigas), 3.5% nylon shrimp
(Heterocarpus reedi), 2.6% blue squat lobster
(Cervimunida johni), 1.7% was red squat lobster
(Pleuroncodes monodon), and 1.4% Chilean grenadier
(Coelorinchus chilensis). The remaining 3% consist of
Besugo (Epigonus crassicaudus), Pacific sandperch
(Prolatilus jugularis), bigeye flounder (Hippoglossina
macrops), Patagonian grenadier (Macruronus
magellanicus), American elephantfish/cockfish
(Callorhinchus callorhynchus), snoek (Thyristes atun),
and kite ray (Zearaja chilensis).48
The kite ray (Zearaja
chilensis) found in the survey is the only one listed as
vulnerable by the IUCN.49
There is currently no systematic information
gathered on bycatch and discards in this fishery.
Estimates of catch discards in the industrial
sector vary widely, depending on the source, with
anecdotal reporting suggesting a range between 2%
(according to the industry50
) and 5%–7% (according
to the IFOP51
). SUBPESCA’s on board observer
program should help to shed further light on the
extent of these issues.
Artisanal
The total size of the artisanal hake fleet remains
largely unknown, with 2,368 vessels officially
licensed with SERNAPESCA but probably closer to
500–700 active vessels. The most important regions
for artisanal fishing by landings are Regions V, VII,
and VIII, which have a share of around 90% of the
total artisanal quota allocation.52
Artisanal capture
occurs almost exclusively by gillnets, with only 1%
to 2% of fishers operating longlines with a small
number of hooks (essentially handlines with more
than one hook). Longlines have historically been
the gear of choice in the artisanal sector and tend
to be more selective and to yield higher quality fish;
however, a massive shift toward gillnets occurred
with the collapse of the stock in the early 2000s, as
shown in Figure 7.
TOTAL ALLOWABLE CATCH (TAC) AND QUOTAS
GEAR AND ENVIRONMENTAL IMPACTS
48
H. Arancibia and S. Niera, “An Overview of the Chilean Hake (Meluccius gayi) Stock, a Biomass Forecast, and the Jumbo Squid (Dosidicus
gigas) Predator-Prey Relationship Off Central Chile,” CalCOFI Report 49, 2008.
49
The IUCN Redlist of Threatened Species, “Zearaja chilensis,” www.iucnredlist.org, 2015.
50
Congelados Pacifico representative manager, personal communication.
51
Instituto de Fomento Pesquero (IFOP), “Merluza común,” Segundo Informe – Final, 2014.
52
Subsecretaria de Pesca y Acuicultura de Chile, Departamento de Pesquerías, “Estado de Situación de las Principales Pesquerías Chilenas,”
Marzo, 2014
22. ImpactInvestingforSustainableGlobalFisheriesAVIBRANTOCEANSINITIATIVE
14
Gillnet
Long line
1998
1999
2000
2001
2002
2003
2004
2005
2006
2007
2008
2009
2010
2011
2012
30,000
10,000
5,000
15,000
20,000
25,000
ThousandsofTons
FIGURE 7: Artisanal Hake Landings by Gear Type (IFOP 2012)53
53
Instituto de Fomento Pesquero (IFOP), “Merluza común,” Segundo Informe – Final, 2014.
54
D. Queirolo, et al, (2013), “Gillnet Selectivity for Chilean Hake (Merluccius gayi gayi Guichenot, 1848) in the Bay of Valparaíso,” Journal of
Applied Ichthyology 29(4): 775–81.
55
D. Queirolo, et al, (2014), “Composición de especies en la pesquería artesanal de enmalle de merluza común Merluccius gayi gayi en Chile
central,” Revista de biología marina y oceanografía 49(1): 61–69.
56
Queirolo et al, “Caracterización de las Redes de Enmalle en la Pesqueria Artesanal de la Merluza Común,” FIP 2009–23, Pontificia
Universidad Católica de Valparaíso, 2011.
57
Instituto de Fomento Pesquero (IFOP), “Merluza común,” Segundo Informe – Final, 2014.
This rapid shift in gear type was a response to the
diminished size and abundance of hake populations
in artisanal fishing zones. This change in the hake
population is further reflected in the shrinking mesh
sizes, decreasing on average from 8.9cm in 2006
to 6.4cm in 2012.54
Generally, mesh size decreases
from north to south, ranging from less than 5cm
in Valparaíso to 8.4cm in Cocholgüe.55
These
decreasing mesh sizes have a direct impact on the
size of fish caught. A study by Queirolo, et al found
that mesh sizes of 5.2, 6.8, and 7.6cm landed fish of
30.9, 40.2, and 43.9cm on average, respectively.56
Since 2005, the majority of hake landings have
been well below what scientists and regulators
think should be the minimum size limit of 37cm in
all fishing areas except for San Antonio (Region
V), where average landing size remained slightly
above the reference size.57
This size-selectivity is
problematic, since the majority of the population
has not reached sexual maturity by the time it
is harvested, and since capture of juvenile hake
impairs stock recovery by limiting reproduction.
Catch per unit effort (CPUE) has also declined
substantially with the stock collapse in the early
2000s, although there is substantial variability
across sites. CPUEs of 100–300kg per fishing trip
were recorded in Region V, 300–800kg per fishing
trip in Region VII, and 600–1200kg per fishing trip in
Region VIII (Figure 8).
23. ImpactInvestingforSustainableGlobalFisheriesAVIBRANTOCEANSINITIATIVE
15
FIGURE 8: Trends in CPUEs in the Artisanal Fishery in Valparaiso and San Antonio
FIGURE 9: Main Export Destinations for Common Hake Landed by Industrial Sector
Industrial
The industrial hake supply-chain is characterized by
a high level of vertical integration, with three major
players—Blumar and Congelados Pacifico working
as a single joint venture, and Pesquera Grimar—
harvesting, processing, and exporting nearly all
the industrial landings. Industrial hake is harvested
by two vessels, flows through up to three large
processing plants, and is packaged and shipped.
The main markets for industrial common hake are
the United States and Europe (Figure 9).
In terms of artisanal bycatch, there is limited
comprehensive data available; however, a study by
Queirlo, et al, of 34 caletas and 772 vessels found
that the bottom-set gillnet fishery had bycatch of
roughly 5% by weight. The main bycatch species
were lemon crab (Cancer porteri), squat lobster
(Pleuroncodes monodon), and lorna drum
(Sciaena deliciosa).58
CURRENT SUPPLY CHAIN
HAKE
1998
1999
2000
2001
2002
2003
2004
2005
2006
2007
2008
2009
2010
2011
2012
120
90
60
30
0
150
San AntonioValparaiso
1998
1999
2000
2001
2002
2003
2004
2005
2006
2007
2008
2009
2010
2011
2012
700
600
500
400
300
200
100
0
800
performance(g/anz)
performance(g/anz)
50%
United States
16%
Others
5% Spain
5% Germany
8% Poland
16% Italy
24. ImpactInvestingforSustainableGlobalFisheriesAVIBRANTOCEANSINITIATIVE
16
Artisanal
In contrast, the artisanal supply chain for common
hake is highly fragmented, opaque, and inefficient,
with all of the product destined for the domestic
market and as much as 90% of that passing
through the country’s largest seafood terminal, the
Terminal Pesquero Metropolitano in Santiago.59
The
perishable nature of the product, coupled with the
fact that most caletas do not have facilities to store
products longer than a few hours after arrival to
port, leaves artisanal fishers with very little market
power. Hake landings typically change hands three
to five times on their way to Santiago, with the
markup from dock to final sale to consumer
ranging from 200% to 500%, absent any value-
added processing.
Moreover, an entrenched group of traders at the
Terminal Pesquero have established an oligopoly
through which they are able to exclude other
vendors, set artificially low ex-vessel prices
nationwide, coordinate among themselves to avoid
SERNAPESCA inspections, and pay premiums
for fish harvested during closed seasons or bad
weather events.60
These artisanal supply chain
dynamics are widely believed to be facilitating, if
not driving, much of the overfishing problem.
Data from the Food and Agriculture Organization
of the United Nations (FAO) indicates no landings
of Humboldt squid prior to the mid-1960s,
with commercial fisheries in Latin America first
established in Peru and Mexico, and with Japanese
backing arriving in the 1970s. The industry only
began to take off in the early 1990s, with total catch
in 1999 of 134,000 mt in Latin America. Today,
global production has grown to over 900,000 mt,61
with Peru accounting for 52% of landings in 2012,
followed by China (27%) and Chile (15%).62
Currently, the largest squid importers are China,
Japan, Italy, Spain, and the United States. The
demand for jumbo squid surged in 2013, driven
primarily by expanding demand from China,
combined with an uptick in demand from new
markets such as Russia, Singapore, and Brazil. Over
the last decade, Peru has become an increasingly
important player, with reported landings above
400,000 mt per year. Peru is trying to consolidate
the artisanal fishery for jumbo squid by introducing
new legislation aimed at bringing the artisanal
sector into the export business.63
In Chile, the industrial seafood companies have
started to invest in infrastructure to monetize the
recent abundance of this resource. One example is
the joint venture between Seafrost and Industrial
Pesquera Santa Mónica, called “Fripusa,” which
plans to expand cold storage facilities in Chile and
add processing capacity. The extent of industrial
harvest, however, is limited to only 20% of the TAC
of 200,000 mt, with the remainder being given to
the artisanal sector. Artisanal fishers in Chile have
also been actively trying to increase their harvest
and processing capacity for squid, as nearly 50%
of the TAC in 2014 went unfished despite strong
international wholesale prices. Federations in San
Antonio and La Serena have received government
sponsorship to build processing plants, but there
is a clear need for larger-scale commercialization
channels and export expertise.
SQUID
59
Instituto de Fomento Pesquero (IFOP), “Merluza común,” Segundo Informe – Final, 2014.
60
Sernapesca personal communication
61
FAO 2014. FAO Online Queries, Global capture database.
62
Food and Agriculture Organization of the United Nations, Globefish.org News Archive, 2014.
63
Food and Agriculture Organization of the United Nations, Globefish.org News Archive, 2014.
25. ImpactInvestingforSustainableGlobalFisheriesAVIBRANTOCEANSINITIATIVE
17
There is surprisingly little robust data on the current
socioeconomic conditions of hake fishers in Chile,
likely because of the general informality of the
artisanal sector and the fact that fishers tend to
be organized around landing sites (caletas) rather
than distinct fishing communities that can be easily
demarcated and profiled. The 2007 census and
more recent academic research, however, provides
some insights.
In 2007, the national census reported that 1,224
people were employed either directly or indirectly
in the artisanal hake fishery. This significantly
underestimates the number of hake fishers, given
that 96% of these respondents were in Regions V
and VIII, which now constitute only two of the three
major hake fishing hubs. This statistic also highlights
the recent and dramatic rise of Region VII as a
major player in the hake industry, a trend that only
began in 2010, following the earthquake.
The census also reveals a thoroughly male-
dominated sector, with men comprising 98.9% of
fishers. This dominance is further reflected in the
gender pay gap, with men making 168,000 CLP/
month (US$ 2,947/year) in 2007 and women only
106,000 CLP/month (US$ 1,859/year). This amounts
to less than one-third of the national average
income in 2007. Even compared to other fishers,
artisanal hake fishers were earning 53% of the mean
income of the fishing sector as a whole.64
Of the respondents, 77% reported being the sole
income earner for their families—compounding the
economic implications of the hake collapse. This
economic vulnerability is exacerbated by low levels
of coverage from formal social and welfare programs.
Only 0.1% of fishers reported insurance coverage for
catastrophic illness, 0.5% had renter’s or employment
insurance, 12% had life insurance, and 28% had some
form of pension. More positively, 91% reported having
some form of health insurance.65
These statistics stand in stark contrast to fishers
operating in the industrial sector, who earned
335,000 CLP/month (US$ 5,877/year) in 2007,
roughly 73% of the national per capita income and
8% higher than the average fishing sector income.
As of 2010, there were a estimated 2,400 employees
in the industrial hake sector—400 operating the
fleet and 2,000 involved in processing.66
SOCIOECONOMIC PROFILE
64
Instituto Nacional de Estadísticas de Chile, “Censo Agropecuario y Forestal,” 2007.
65
Arancibia, et al, “Evaluación de estrategias de recuperación en la pesquería de merluza común,” Universidad de Concepción, FIP 2009–22, 2010.
26. ImpactInvestingforSustainableGlobalFisheriesAVIBRANTOCEANSINITIATIVE
18
THE MERLUZA IMPACT STRATEGY
IMPACT INVESTMENT THESIS
The Merluza Strategy’s impact thesis is predicated on the assumption that by reducing overall fishing
effort through a comprehensive set of interventions affecting over 70% of the stock, hake mortality can
be sufficiently reduced to allow the stock to recover, thus improving fisher livelihoods and increasing food
supplies over time.
Specifically, Merluza aims to restore the hake fishery to 75% of its estimated biomass at maximum
sustainable yield67
over a 10-year period, increasing hake landings by 177%, and delivering at least 136 million
additional seafood meals to market each year, while setting it on a path to full recovery.68
To accomplish these impact objectives, The Merluza Strategy proposes the following bundled set of investments
(See Figure 10):
Step 1: Invest $2.0 million up front into comprehensive fishery management improvements in the 12 largest
hake-fishing caletas*. The investment would fund the establishment of a new team and fisheries management
company (“FMC”) that would implement a wide range of fisheries management improvements. These
activities would include the implementation of full vessel monitoring and catch documentation coverage,
replacement of all nets below a minimum mesh size, the retrofitting as many as 70% of hake fishing vessels
in the region with the highest IUU fishing to instead fish jumbo squid, and the coordination of extensive
technical assistance and broader stakeholder engagement programs.
Step 2: Invest $9.4m into the acquisition of 60% of the industrial hake quota, 80% of which would be
re-allocated to artisanal fishers in Merluza caletas, while 20% would be held, unfished and in reserve, to
reduce fishing mortality and support stock recovery.69
The quota ownership would give Merluza a means
by which to immediately legalize a large portion of the IUU landings in the participant caletas. Quota would
only be allocated to caletas fully engaged in Merluza improvement activities and where Sernapesca was
present to inspect and certify all landings as legal. The quota asset would also give investors significant
upside exposure to a stock recovery, as the value of the quota could rise dramatically with the stabilization
and restoration of the fishery.
Step 3: Invest $6.1 million70
into the creation of a vertically integrated hake and squid processing and distribution
company (called “HakeCo” or “the Company”) that would source and commercialize hake and squid from the
participant caletas, reconfiguring the prevailing supply chain, while modernizing artisanal fishing and landing
practices to generate higher value for lower volumes. HakeCo would use financial incentives to reward fishers
complying with fishery management improvements, paying an estimated 50% price premium relative to current
market ex-vessel prices for all raw materials that met Merluza compliance standards.
67
IFOP and University of California–Santa Barbara estimate biomass levels at MSY of approximately 630,000 mt.
68
Full recovery would be to at least 100% of biomass at MSY.
69
This is the maximum share of industrial quota that can go unfished without being reallocated.
70
This represents only the initial costs to establish the commercial operations.
* Merluza budgets an additional $2.5 million in fishery management expenses over the investment term funded by cash flow from operations.
27. ImpactInvestingforSustainableGlobalFisheriesAVIBRANTOCEANSINITIATIVE
19
The proposed bundling of the investments into
fishery management improvements with the
HakeCo reflects the notion that fishery improvement
efforts must be supported by clear and immediate
market-based incentives to achieve compliance.
Fishery improvement efforts that attempt to curtail
harvest without offering economic alternatives, such
as the 2014 TAC reduction, have the potential to
create controversy and conflict without necessarily
moving the needle on stock recovery because they
fail to address the interrelated social, biological,
and economic drivers of overfishing. The Merluza
Strategy attempts to address these multiple drivers
while building on the strong foundation laid by the
new Fishing Law.
Steps 1 and 2 will be described in the Impact
Strategy section of this report, while Step 3 will
be described in the Commercial Investment Thesis
section further below.
The Merluza Strategy aims to restore the hake fishery to 75% of its
estimated biomass at maximum sustainable yield over a 10-year
period, increasing hake landings by 177%, and delivering at least
136 million additional seafood meals to market each year, while
setting it on a path to full recovery.
HARVEST HANDLING
COLD CHAIN/
TRANSPORT PROCESSING DISTRIBUTION
STEP 1: Invest $2.0 million up front in
fishery management improvements*
STEP 2: Invest $9.4 million to acquire fishing quota
STEP 3: Invest $6.1 million to launch and operate HakeCo
FIGURE 10: The Merluza Strategy Investments
* Merluza budgets an additional $2.5 million in fishery management improvement expenses over the investment term
28. ImpactInvestingforSustainableGlobalFisheriesAVIBRANTOCEANSINITIATIVE
20
INITIATION
YEAR
CALETA REGION SHARE OF TOTAL
ARTISANAL QUOTA
BY CALETA (2015)
CUMULATIVE SHARE
OF ARTISANAL QUOTA
INCORPORATED INTO STRATEGY
1 Cocholgüe VIII 18% 18%
1 San Antonio V 11% 29%
1 Portales V 10% 39%
1 Duao VII 11% 50%
2 Maguillines VII 5% 55%
2 Pelluhue VII 4% 59%
2 Loanco VII 3% 62%
2 El Membrillo V 3% 65%
3 San Pedro V 2% 67%
3 Llico VII 2% 69%
4 La Trinchera VII 1% 70%
4 Tumbes VIII 1% 71%
FIGURE 11: Artisanal Shares Incorporated into the Management Improvements
The fishery management improvements proposed
by Merluza and implemented by the newly
established FMC would be directed at the artisanal
sector, for two primary reasons. First, the artisanal
sector is the largest contributor to the IUU fishing
that is believed to be preventing the hake’s recovery.
Second, Merluza proposes the acquisition of 60% of
the industrial quota, 80% of which would be leased
to participant caletas and 20% of which would
be left unfished as a recovery reserve. This action
would further reduce the relevance, from a fisheries
management perspective, of the industrial sector.
Merluza proposes a rollout of the management
improvements into four participant caletas in year 1,
another four in year 2, expanding to a total of 12
by year 4. This approach leads to high organizational
and fixed asset costs in the first three years,
which are necessary to gain the market leverage
required to drive systemic reform in the fishery.
The proposed caleta-level rollout schedule is detailed
in Figure 11 below, along with the associated share
of the artisanal landings of hake incorporated in the
Merluza portfolio.
STEP 1: FISHERY MANAGEMENT IMPROVEMENTS
29. ImpactInvestingforSustainableGlobalFisheriesAVIBRANTOCEANSINITIATIVE
21
CORE
FISHERIES
MANAGEMENT
COMPONENTS
ACTIVITIES PROPOSED MANAGEMENT IMPROVEMENTS
Stakeholder
Engagement
Government
Engagement
• Partner with advocacy groups to lobby the government to
expand the seasonal closure period by one month and institute
area closures to protect reproductive individuals during spawning
• Co-create product label with SERNAPESCA to verify the
Company’s product as legal and sustainable
• Conduct workshops with SERNAPESCA authorities to help
integrate Catch Documentation System (CDS) data into annual
stock assessments
• In year 3, begin workshops and training to transition CDS
management to SERNAPESCA for rollout nationally and to
other species
Community
Engagement
• Design and oversee implementation of caleta-specific fishery
management plans outlining proper harvest, landing, and
catch-documentation practices, as well as key environmental
considerations regarding ecosystem impacts, closed seasons,
bycatch, discards, and bait use
• Provide extensive technical assistance to participant fishers
to ensure their full understanding of Merluza management
improvements and to build knowledge and capacity around jumbo
squid harvest, thus ensuring full transition away from hake
• Conduct consumer awareness campaign with fishers, nonprofit
partners, regulators, and retailers highlighting IUU fishing issues
• Prepare and publicly disseminate annual report on fishery
improvement plan progress against target benchmarks, with
external audits every three years
Policy Rules
and Tools
Exclusive Access
Rights
• Ensure that quota allocations—a form of exclusive access—is
monitored and properly enforced through installation of Vessel
Monitoring Systems (VMS) and an enhanced SERNAPESCA
presence in the caletas
• Register all vessels in the participant caletas
Fishing Rules • Purchase all fish from participant fishers to eliminate discarding,
but only pay premium for fish larger than 35cm initially and 38cm
by year 5
• Replace all destructive gear, including gillnets with a mesh size
below 7cm, and incentivize use of hand-lines through price
premiums, given the higher selectivity of the gear and quality of
fish landed
• Expand seasonal closure (described above)
Reduce Fishing
Effort
Stock Recovery • Purchase 60% of industrial quota and leave 20% reserve unfished
for 10 years (see Acquisition of Fishing Quota, below)
• Retrofit 70% of vessels in the Merluza caletas in Region VII caletas
to fish jumbo squid
• Dramatically reduce and minimize IUU fishing in the 12 largest hake
landing sites in Chile
The primary elements of the fishery management improvements in the target caletas are outlined below:
30. ImpactInvestingforSustainableGlobalFisheriesAVIBRANTOCEANSINITIATIVE
22
CORE
FISHERIES
MANAGEMENT
COMPONENTS
ACTIVITIES PROPOSED MANAGEMENT IMPROVEMENTS
Compliance Catch Accounting • Design, implement, and operate Catch Documentation System
in each caleta
• Install weighing stations in caletas, staffed by the Company
and SERNAPESCA, to ensure that landings comply with
quota allocations and are properly accounted for in fishery
management data
Product Traceability • Design and implement full traceability system, from buying
stations to final point of sale by HakeCo
Biological Monitoring
and Assessment
• Fund and support existing research to map out sensitive
ecosystems and spawning grounds in target caletas
• Fund and support existing research on hake-squid interactions and
impact on hake mortality
Local Enforcement
Systems
• Sign contracts with the leadership of each of the 12 caletas
stipulating that in exchange for access to all loaned infrastructure
(vessel equipment, ice machines, etc.) and quotas, the caleta
must comply with the guidelines of the fishery management plan;
any caleta found in breach of the agreement could lose all future
access to these valuable assets as well as the 50% premium paid
for raw materials by the Company
• Codify fishery management improvement activities into the bylaws
of each caleta and/or “Regimen Artesanal de Extracción” (RAE),
leaving violators subject to losing access to future quota allocation
as well as the ability to participate in the Company’s supply chain
In Region VII, where the highest levels of IUU
fishing are reported, Merluza proposes to invest
in the gear and infrastructure necessary to divert
a large portion of this fleet toward the harvest of
jumbo squid, with HakeCo providing a profitable
commercialization channel for fishers. In the squid
fishery, there is no allocation of quota to individuals,
but rather a global TAC with caps set on the
artisanal and industrial sectors. This approach,
albeit an imperfect one from a fisheries
management approach, would facilitate new
entrants from Merluza caletas.71
A proposal for the
vessel transition is outlined in Figure 12.72
Not all
vessels will be transitioned, as some have official
quota allocations that will be repatriated if left
unfished and transferred outside of the Merluza
caletas, which would counteract the goals of
the strategy. As such, the goal in Region VII is to
transition primarily those fishers with little or no
quota to squid fishing to rationalize hake landings
with legal harvest limits.
THE TRANSITION TO JUMBO SQUID
The Merluza Strategy proposes to invest in the gear and infrastructure
necessary to divert a large portion of this fleet toward the harvest of
jumbo squid, with HakeCo providing a profitable commercialization
channel for fishers.
71
This may change as the fishery comes under more careful management.
72
This chart is largely indicative, as the actual retrofits would be based on the willingness of fishers in each caleta to participate and the
relative landings versus quota allocation of each vessel.
31. ImpactInvestingforSustainableGlobalFisheriesAVIBRANTOCEANSINITIATIVE
23
CALETAS REGION % VESSEL
TRANSITIONED TO SQUID
ADDITIONAL SQUID
LANDINGS – 2020 (MT)
TOTAL SQUID
LANDINGS – 2020 (MT)
Cocholgüe VIII – – 9,000
Puertecito-
Pacheco
Altamirano
V – – 9,000
Portales V – – 4,500
Duao VII 70% 5,544 5,544
Maguillines VII 70% 3,185 3,185
Pelluhue VII 70% 3,185 3,185
Loanco VII 70% 1,960 1,960
El Membrillo V – – –
San Pedro V – – –
Llico VII 70% 840 840
La Trinchera VII 70% 525 525
Tumbes VIII – – –
TOTAL 15,239 37,739
POSITION ANNUAL SALARY (USD) NUMBER
General Manager $144,000 1
VP Operations $72,000 1
Executive Associate $21,600 1
Administrative Assistant $18,000 2
FIGURE 12: Transition to Squid Fishing by Caleta, Including Percentage of Vessels Transitioned and Additional Landings
FIGURE 13: Fisheries Management Company Staff
Conversations with these fishers reveal a keen
interest in finding alternatives to hake fishing
so long as proposals present a better economic
value proposition. As previously discussed, for
most fishers in Region VII, hake fishing is not their
historical vocation, but rather an activity of last
resort forced on them by the destructive impacts
of the 2010 tsunami. As SERNAPESCA continues to
expand and assert its authority to levy fines, seize
vessels and trucks, and even revoke quotas—all
recent developments in Chile—illegal fishing will
present an increasingly significant risk.
Fortunately, Merluza estimates that illegal fishers
in this region earn between US $5,000 and $7,500
per year from the sale of illegal hake, whereas legal
harvest of jumbo squid—facilitated by the provision
of the right gear and a reliable commercialization
path—could yield over $14,000 per year, with fewer
days at sea and lower risk of prosecution.
Merluza would create a dedicated subsidiary, referred
to hereafter as the Fisheries Management Company
(FMC), staffed by a team of experienced fisheries
personnel to ensure sound design, implementation,
and operational management of the fishery
management improvements (see Figure 13).
MANAGEMENT AND IMPLEMENTATION
32. ImpactInvestingforSustainableGlobalFisheriesAVIBRANTOCEANSINITIATIVE
24
Merluza proposes that the team be lean and that
the implementation of the fishery management
improvements be primarily contracted to technical
service providers. The FMC would manage these
service providers and be responsible for reporting
progress to investors and the broader stakeholder
network of the project. Moreover, FMC would have
control over the budget and financing of the fishery
management improvements, would work closely
with HakeCo, and would seek wherever possible to
use the services of community members to espouse
a greater sense of partnership.
Importantly, because the fishery management
improvements would incorporate implementation of
critical aspects of the Fishing Law, SERNAPESCA’s
limited resources could be focused more effectively
on the necessary and currently inadequate
enforcement activities.
The Merluza Strategy proposes to further partner
with best-in-class technical, academic, and policy
advocacy partners to design and implement the
fishery management improvements, including these:
• Leading NGOs and academic institutions capable
of defining the critical elements of the fishery
management plans and leading elements of
Merluza’s engagement with government authorities
• Existing fishery management improvement
implementing organizations whose efforts could
be incorporated into or expanded on by Merluza
• Shellcatch LLC, a privately held company that
specializes in affordable technology solutions
for boat-to-plate traceability and has strong
relationships with hake caleta leadership and
communities; Shellcatch could serve as a
community liaison and implement certain aspects
of the fishery management improvements
• MarActivo, a Chilean fisheries science and policy
consulting firm that has worked for years to
improve the management and commercialization
of artisanal fisheries, could serve as the primary
implementation partner for a broad range of
fishery management improvements
• Blueyou Consulting, a consulting firm with
global expertise in artisanal fishery management
improvements design, could assume responsibility
for formalizing and crafting the budgets
for fishery management improvements and
aligning improvement efforts with international
certification standards
Finally, The Merluza Strategy would use third-
party verification and auditing of the fishery
management improvements, as well as ensure
their implementation in each fishing site. This
would be intended to create additional discipline
and accountability across the fishery. The auditors
would be asked to conduct formal annual reviews
of fishing practices and management systems,
and to perform “surprise” audits in a handful of
communities each year.
Fishers willing to commit to fisheries management
improvements and serve as suppliers to Merluza’s
sourcing strategy would be eligible to participate
in Merluza’s Sustainable Fishing Rewards Program
(SFRP). Merluza proposes to utilize the SFRP
as an incentive to catalyze and sustain the
implementation of sustainable fishing practices
that support the hake recovery.
SUSTAINABLE FISHING REWARDS PROGRAM
33. ImpactInvestingforSustainableGlobalFisheriesAVIBRANTOCEANSINITIATIVE
25
Raw Material Premium
HakeCo expects to be able to pay 50% more than
prevailing beachside prices for raw materials from
the participant caletas that meet its sourcing criteria.
HakeCo would only source seafood from current
members of the participant caletas, and on the
basis of individual and caleta compliance with the
current sustainability requirements as determined by
local monitoring and annual third-party verification.
Prices for specific volumes of landings would be
paid directly to fishers so long as their membership
in the caletas remains secure. Overall, the increased
prices paid out for raw materials would generate an
estimated $103 million in additional income over 10
years, or nearly $58,000 per fisher in present value
terms73
, as shown in Figure 14.
Fishery Management Fund
In addition, Merluza would distribute 50% of the
proceeds from the sale of its quota holdings, up
to a maximum of $25 million, to endow a Fishery
Management Fund (FMF).74
The FMF would be
structured to support the operating costs of The
Fishery Management Company (FMC) in perpetuity
by using the proceeds of the quota sale to establish
an endowment. The proceeds would be invested
in a low—risk investment portfolio, and annual
interest earned could be used to fund ongoing
fisheries management activities across the hake
fishery. Assuming that the base case allocated a
quota value of $25 million, the FMF could generate
between $750,000 and $1.25 million annually to
continue to support the fishery management
efforts. This mechanism would ensure the continued
implementation and oversight of fishery management
improvements in the caletas following the exit of
Merluza and its subsidiaries from the fishery. The
FMF mechanism would further provide a long-term,
transparent source of funding administered by a
multi-institutional decision-making body that could
decide how best to allocate the fund’s revenue under
competing demands.
The Fishery Management Fund would have the
following governance and membership requirements:
• The FMF must be established as a trust fund,
wholly owned and governed by The Fishery
Management Company.
• FMF’s governance must include six rotating board
members from among the 12 fishing caletas,
each with one vote, plus one voting member
from SERNAPESCA and two from the FMC
management team.
• Any FMC board member has the right to veto
any proposed investment or modification to the
FMF charter.
73
Both figures given in present value terms.
74
The concept and structure of the FMF is borrowed in part from the structures used by The Nature Conservancy’s Water Funds, used in
Ecuador and Colombia.
FIGURE 14: Profit Share Program Expansion (FMF and Premium)
Millions
$50
$40
$30
$20
$10
$60
Ex-Vessel
Value of
Raw Materials
SFRP Premium
Payout
SFRP PREMIUM PAYOUT
YEAR 1 YEAR 5YEAR 2 YEAR 6YEAR 3 YEAR 7 YEAR 9YEAR 4 YEAR 8 YEAR 10
34. ImpactInvestingforSustainableGlobalFisheriesAVIBRANTOCEANSINITIATIVE
26
• Beyond paying the salaries of FMF’s staff, the
board can determine to what use to put the funds
each year, subject to the constraint that they be
directed toward fishery improvement activities in
the caletas. Such uses could include investments
in upgrades to Merluza-installed equipment,
improved monitoring technologies, hake fishery
research projects, and/or costs associated with
sustainability certifications such as the Marine
Stewardship Council or Fair Trade.
Additional Compliance Measures
In addition to the price incentives offered by The
Sustainable Fishing Rewards Program, Merluza
also proposes that HakeCo secure legal contracts
with the leadership of each of the 12 caletas,
stipulating that in exchange for access to all loaned
infrastructure (vessel equipment, ice machines, etc.)
and quotas, the caleta must comply with the fishery
management improvements. Any caleta found
in breach of the agreement could lose access to
these valuable assets as well as the 50% premium
paid for raw materials by the company. All valuable
infrastructure in the communities would be installed
in such a way that it could be quickly removed in
the case of sanctions or other disruptions in the
caleta. This structure is legally enforceable and would
create a self-policing mechanism in which the caleta
leadership could use any of a wide variety of punitive
measures, including revocation of quota allocations,
vessel licenses, or membership to the federation to
deter individual violators. This structure highlights
the important interplay between FMC and HakeCo,
wherein economic incentives and infrastructure
would be used to enforce sustainability activities
where sanctions on individual fishers by HakeCo by
itself would be legally or politically infeasible.
All activities associated with the implementation
of the fishery management improvements would
be the responsibility of FMC. Certain management
improvements would require one-time, upfront
capital expenditures, such as for the purchase
of vessel monitoring equipment, new gear, and
other equipment or infrastructure. However,
most of the management activities would require
ongoing oversight of and execution by third parties
providing these services. The annual FMC budget is
shown in Figure 15.
FISHERY MANAGEMENT IMPROVEMENT BUDGET
FIGURE 15: Annual FMC Budget
$1,600,000
$1,400,000
$1,200,000
$1,000,000
$800,000
$600,000
$400,000
$200,000
Capital
Expenditures
Operating
Expenses
FISHERIES MANAGEMENT COMPANY (FMC) BUDGET
YEAR 1 YEAR 5YEAR 2 YEAR 6YEAR 3 YEAR 7 YEAR 9YEAR 4 YEAR 8 YEAR 10
35. ImpactInvestingforSustainableGlobalFisheriesAVIBRANTOCEANSINITIATIVE
27
The fishery management improvements budget
over the 10-year horizon of the investment is
estimated to be $4.5 million. These expenses break
out, according to the aforementioned fishery
management plan categories, as shown in Figure 16.
Fishery management expenses are expected to
fall dramatically in year 3 of the strategy, given
the rollout into eight of the 12 caletas, specifically
the largest ones, in the first two years. Total costs
in these early years would be driven primarily by
high upfront capital expenditures associated with
design, purchase, and installation of new equipment
in the caletas, including vessel monitoring systems,
catch documentation infrastructure and materials,
and new gears for vessel retrofits. By year 4, no
additional capital expenditures would be needed,
because the management improvements would
have been rolled out to all 12 caletas (see Figure 17).
FIGURE 16: FMC Expense Categories
FIGURE 17: Evolution of FMC Capital Expenditures over 10 Years
FISHERIES MANAGEMENT EXPENSES
8% XXX
16% XX12%
Stakeholder
Engagement
6% Accountability and Reporting
1% Scientific Research 1% Other Capex
9% Vessel Monitoring Systems
6% Net Replacements
4% Catch
Documentation
System
30%
Ongoing
Equipment
Maintenance
11%
Squid Vessel
Retrofits
20%
Weighing
Stations
FMC CAPITAL EXPENDITURES BUDGET (USD)
1.4
1.2
1.0
0.8
0.6
0.4
0.2
Caleta Improvements and Weighing Stations
Catch Documentation and Traceability System
Millions
Squid Vessel Retrofits
Net Replacements
Vessel Monitoring Systems
Other Capex
YEAR 1 YEAR 5YEAR 2 YEAR 6YEAR 3 YEAR 7 YEAR 9YEAR 4 YEAR 8 YEAR 10
36. ImpactInvestingforSustainableGlobalFisheriesAVIBRANTOCEANSINITIATIVE
28
Ongoing FMC operating expenses continue to
increase gradually over time, primarily driven by
stakeholder engagement activities, maintenance
of fishery management equipment installed in
the caletas, ongoing oversight of VMS and CDS
systems, and accountability and reporting measures
such as external audits. See Figure 18 below.
Over time, as shown in Figure 19 FMC’s costs would
diminish dramatically as a share of the projected
hake revenue generated by HakeCo, illustrating the
power of early, comprehensive investment in fishery
improvements leading to biomass increases and
higher profits.
FIGURE 18: FMC Operating Costs over 10 Years
FMC CAPITAL OPERATING EXPENSES BUDGET (USD)
1.3
1.3
0.2
0.2
0.1
0.1
Scientific Research
Millions
Accountability
and Reporting
Ongoing
Equipment
Maintainance
Stakeholder
Engagement
YEAR 1 YEAR 5YEAR 2 YEAR 6YEAR 3 YEAR 7 YEAR 9YEAR 4 YEAR 8 YEAR 10
37. ImpactInvestingforSustainableGlobalFisheriesAVIBRANTOCEANSINITIATIVE
29
In addition, The Merluza Strategy proposes to
acquire 60% of the industrial hake quota (equivalent
to 8,200 mt of hake in 2015) from two industrial
fishing companies that have expressed an interest
in exiting the fishery until the stock recovers. FMC
would manage a quota leasing program, first leasing
the quota to HakeCo at the prevailing market rate.
FMC would then use the leasing fees to pay for a
portion of the fishery improvement activities, while
HakeCo would subsequently lease this quota, at
little or no cost initially, to participant caletas.
FMC would only plan to lease up to 80% of the
quota in any given year. The remaining 20% would
be left unfished, to reduce fishing effort and to help
recover the stock more quickly—the greatest share
of a transferable quota allocation that can remain
unfished by a quota-owning entity over a three-
year period without facing potential seizure and
reallocation by the government.
Upon leasing the quota, HakeCo would distribute
it to the participant caletas based on (1) harvest
efficiency, (2) perceived willingness of caletas to
comply with Merluza fishery improvements, and (3)
ease of enforcement. For example, caletas Puertecito
and Portales are known among NGOs and other
practitioners for being more particularly progressive
in terms of their willingness to adopt fishery
management improvements while also having the
vessel capacity to assume additional quota.
Beyond supporting the impact strategy, the quota
holding enables investors in Merluza to have a secure
financial stake in the future value of the fishery, with
the potential to generate an outsized return should
the fishery recover. Even if holding quota prices
remain constant, an achievement of 75% of BMSY
in
the fishery could increase the aggregate quota value
by four times75
, driving the returns of the project.
STEP 2: ACQUISITION OF FISHING QUOTA
The Merluza Strategy proposes to acquire 60% of the industrial hake
quota (equivalent to 8,200 mt of hake in 2015) from two industrial fishing
companies that have expressed an interest in exiting the fishery until the
stock recovers.
75
Assuming a present value of the total estimated quota value in the tenth year, discounted by the Chilean rate of inflation.
FIGURE 19: Fishery Management Expenses as a Share of HakeCo Revenues
FISHERY MANAGEMENT EXPENSES AS A PERCENTAGE OF HAKECO REVENUE
50%
60%
40%
30%
20%
10%
00
DataLabel
YEAR 1 YEAR 5YEAR 2 YEAR 6YEAR 3 YEAR 7 YEAR 9YEAR 4 YEAR 8 YEAR 10
38. ImpactInvestingforSustainableGlobalFisheriesAVIBRANTOCEANSINITIATIVE
30
The Merluza Strategy targets a range of social and environmental impact returns, as follows:
TARGETED IMPACTS
ENVIRONMENTAL IMPACTS
Biomass Restoration • Recover the hake stock to at least 75% of biomass at MSY by the end of
10 years.76
• Endow Fishery Conservation Fund with up to $25 million from the
proceeds generated through the sale of the hake quota in year 10
Bycatch Reduction • Avoid the bycatch of at least 1,500 mt of nontargeted species over the
first 10 years of the project.77
Habitat Protection N/A
Time Horizon 10 years
SOCIAL IMPACTS
• Increase incomes for almost 1,800 artisanal fishers across 12
communities through raw material premium payouts of over US
$58,000 per fisher over 10 years, or $104 million in total in the
base-case scenario.78
• Empower fishers and fishing communities through the installation of
market infrastructure that increases their bargaining power with buyers
of landed seafood products
Increase in Meals Produced • Generate an additional 62,000 mt in landings annually by year 10 as the
hake stock recovers, producing an estimated 136 million additional hake
meals annually thereafter.
• Generate an additional 15,200 mt in landings annually through new
access to jumbo squid production, delivering an estimated 25 million
additional meals annually thereafter
Time Horizon 10 years
76
According to IFOP and UCSB, a total biomass under MSY management equates to roughly 630,000 mt of total biomass in the water.
77
This assumes that 20% of the industrial quota will go unfished over the course of the 10 years, and that the industrial sector is subject to
at least 5% bycatch rates. There will likely be additional bycatch avoided by transferring quota to the artisanal sector, particularly through
the adoptions of handlines; however, the extent of this reduction is uncertain so it has not been included in the impact return estimate.
78
Returns based on total premium payout over 10 years of project discounted to present value terms, using the Chilean rate of inflation as
the discount rate.
Merluza was able to take advantage of existing
stock assessment models for the common hake
fishery to estimate the range of potential stock
biomass levels and timelines associated with a
restoration of the fishery. In particular, Merluza
consulted models provided by the University of
California Santa Barbara (UCSB) and the Instituto
de Fomento Pesquero (IFOP) to inform its fishery
management improvement proposals.
By comparing the projection scenarios from
each modeling group and flexing the model
assumptions to reflect the timing and scope of
Merluza’ proposed interventions, it was possible
to infer relative probabilities of various recovery
scenarios over the term of the project. Based on
these efforts, Merluza established base-case, upside,
and downside recovery scenarios, with a recovery
to 75% of BMSY
appearing to be the most reasonable
impact target given the scale of the proposed
interventions and the uncertainty surrounding the
biological, economic, and policy context over a
10-year period.
The existing stock assessment models in use for
the fishery do not allow for a refined analysis
of the impact of all of the specific interventions
contemplated in the fisheries management
improvements. Investors and project developers
interested in supporting Merluza could consider
building tailored models that may provide more
refined recovery estimates.
39. ImpactInvestingforSustainableGlobalFisheriesAVIBRANTOCEANSINITIATIVE
31
THE MERLUZA COMMERCIAL INVESTMENT THESIS
STEP 3: LAUNCH AND OPERATE HAKECO
To further capture the value of the investments in fishery management improvements, The Merluza Strategy
proposes to launch a vertically integrated seafood company that harvests, processes, and distributes hake
and jumbo squid products to domestic and international buyers.
VALUE PROPOSITION
Merluza’s commercial value proposition is premised on two key drivers: (1) that implementation of
comprehensive fishery management improvements can restore the stock biomass, allowing for total
landings to increase by up to 270% by year 10; and (2) that ownership of a processing and distribution
business that increases in profitability as a result of expanded throughput, unlocks supply chain efficiencies
through vertical integration, and adds value to products through better handling, processing, and sale into
higher value markets, can reinforce sustainability objectives, while producing attractive financial returns.
SUMMARY OF BUSINESS STRATEGY AND CONCEPT
While the FMC management team would oversee the fishery management activities, HakeCo would seek
to commercialize sustainably harvested hake and squid raw materials from the 12 caletas. This business
would serve as the first vertically integrated commercialization channel for artisanal hake and squid in Chile,
seeking to reconfigure the prevailing supply chain for these products. To some extent, this strategy mirrors
that of the large, and once highly profitable, industrial seafood companies, although HakeCo would not own
vessels or other depreciating assets such as trucks and processing plants. This “asset light” strategy would
improve the Company’s flexibility in adapting to changing stock conditions and would match capacity more
closely to resource availability.
Merluza proposes that HakeCo oversee landing and handling improvements in each of the caletas, including
the installation of buying stations staffed by HakeCo personnel. The buying stations would ensure that
landings are properly weighed, documented, and certified as legal by SERNAPESCA—thus providing
valuable data to inform fishery management efforts and clearly differentiating legal from illegal hake at the
point of origin. Merluza’s investments into the artisanal supply chain would enable it to incorporate much
greater supply volumes from existing hake quota allocations and from increased squid landings, growing its
throughput and profitability. These investments in combination would improve the volume, quality, legality,
and reliability of the hake and squid catch.
40. ImpactInvestingforSustainableGlobalFisheriesAVIBRANTOCEANSINITIATIVE
32
Sourcing Network
One potential supply chain map is outlined in
Figure 20, with all hake and squid from Region V
transported to a Santiago facility for cold storage
and processing, while a significantly larger volume of
squid and hake raw materials from Regions VII and
VIII would be processed at facilities further south. All
hake finished goods would be sold on the domestic
market, while squid would be sold both domestically
and to Asian and regional export markets.
Given the sustainability challenges and rampant
illegality in the hake harvest, HakeCo would focus on
ensuring that only legal hake is landed in participant
caletas. In order to do this, vessel activity must be
closely managed and monitored. Before each vessel
outing, a buying station employee (or SERNAPESCA
official whenever possible), working in tandem
with the FMC’s sustainability compliance systems,
would record the vessel number, occupants, and
departing time. FMC’s program would have installed
VMS on board all vessels, passively recording
harvest locations, duration of fishing activities, and
confirmation of gear type. On the boat, the fishers
would use a biodegradable monofilament net with
a mesh size of 7cm, provided by FMC. Additional
fishing practices used to minimize bycatch and
habitat impacts would be implemented through
FMC’s technical assistance programs and monitored
by FMC and its auditors.
The Merluza Strategy would have access to 71% of
the artisanal hake landings across Chile and 42% of
the 200,000 ton jumbo squid landings incorporated
into the Merluza sustainability program, but would
conservatively target the processing of 40% of the
landings for hake and 17% of the squid. HakeCo
would begin sourcing raw materials from eight
caletas in the first two years and 12 caletas by year 4,
spanning Regions V, VII and VIII. The current quota
allocations and landings of these caletas would be
supplemented with industrial hake quota acquired by
FMC, leased to HakeCo, and delivered to the caletas
to allow for increased landings from quota recipients.
In addition, jumbo squid would provide landings from
an abundant and currently underexploited resource.
The TAC for jumbo squid of 200,000 mt is split 80%
artisanal, 20% industrial, with nearly 50% remaining
unfished in 2014 due to a lack of infrastructure for
harvest and commercialization by the artisanal
RAW MATERIAL SOURCING STRATEGY AND HARVEST PLANNING
FIGURE 20: Supply Chain Visualization
Legend
Buying station
Processing plant
Buying station
to plant
Plant to final
point of sale
Final point
of sale
Squid to Asia
Breading plant
San Pedro
Portales
San Antonio
Llico
Duao
La Trinchera
Maguillines - Constitución
Loanco
Pelluhue
Talcahuano
Cocholgue-Coliumo
Tumbes
Membrillo Recoleta
SANTIAGO
41. ImpactInvestingforSustainableGlobalFisheriesAVIBRANTOCEANSINITIATIVE
33
sector. This TAC is set by scientific committee
based on a stock assessment, and a management
committee is presently being formed to lay out a
management plan for the species. Conversations
with fishers and authorities alike confirm that the
species is extremely abundant, but only a few caletas
have access to the equipment and processing
capacity to exploit the large cephalopod. Figure 21
shows the raw material sourcing plan for both hake
and squid as a percentage of their projected TACs
over time.
Management of Seasonal Supply Volatility
The hake fishing season is open for 11 months per
year with a one-month closed season while the fish
are spawning, and would likely be shortened to 9-10
months per year with Merluza’ proposed extension
of the seasonal closure period. Beyond this,
landings remain relatively consistent throughout the
year. The jumbo squid species can be fished year-
round, and is believed to be abundant along the
entire Chilean coastline as far south as Region VIII,
making it an ideal candidate for harvest while hake
remain scarce. Moreover, HakeCo will have access to
large cold storage facilities in both Regions V and
VIII, where inventory of hake can be stored to allow
for sales year-round.
Caleta Supply Agreements
Merluza seeks to establish long-term supply
agreements with hake fishers to commit to offtake
of a baseline share of hake and squid landings over
time. Leveraging the tools offered by the Sustainable
Fishing Rewards Program, Merluza would link the
premium price paid to fishers with compliance with
the fisheries management improvements, including
certain requirements regarding size, type of gear
used, and other sustainability covenants that would
form the basis of a sustainable sourcing policy for
HakeCo. While a baseline market price would be paid
immediately upon product delivery, premiums would
be paid one month in arrears to ensure adequate
time for verification of fisher compliance with the
sustainability covenants. If fishers were found to
be in breach of the supply agreement terms, they
would lose access to the premium and could face
fines, loss of access to infrastructure leased to them
by the Company, and other penalties. The caleta
leadership could also, if it deemed appropriate,
ban the marketing of products outside the HakeCo
channel, impose fines, and even revoke individual
quota allocations and membership to the fishing
association. HakeCo would ideally seek to establish
a tribunal of fishers, fishing association leadership,
and company representatives responsible for
hearing cases and determining penalties. The supply
agreement terms and covenants could be thought
of as a supplement to the rules imposed within the
context of the jurisdiction of the fishing authority.
FIGURE 21: Hake and Squid Raw Material Sourcing Relative to TAC
RAW MATERIAL SOURCING AS A PERCENTAGE OF TAC
50%
60%
40%
30%
20%
10%
00
DataLabel
% of Hake
Landings
Sourced
% of Squid
Landings
Sourced
YEAR 1 YEAR 5YEAR 2 YEAR 6YEAR 3 YEAR 7 YEAR 9YEAR 4 YEAR 8 YEAR 10